2. catalyst life is a very challenging area of research in chemical
engineering as the activation of methane to undergo coupling
or ring formation is very challenging as its stable and
symmetrical structure results in a high activation energy of
425 kJ/mol together with the lack of functional group to
contribute in polarity or magnetic moment making it less
vulnerable to be attacked by other molecules or ions.3
Researchers tried to study the activity of different metal
catalysts, especially the transition metal catalysts for methane
activation reaction including the different metal and support
combinations which were found to catalyze the reaction giving
a range of end products from ethane and ethylene to liquid
aromatic products.2,4
For instance, various ZSM-5 zeolite
supported metal catalysts exhibit activity in the order Mo > W
> Fe > V > Cr for the methane conversion to benzene product,
where it was also found that the increasing number of Brønsted
acid sites had positive effect on methane conversion.5
Furthermore, other ZSM-5 supported catalysts were being
studied as in the case of the 2.5% loading of tungsten metal
catalyst on ZSM-5 which showed fair performance of 23%
methane conversion with a 96% benzene selectivity when the
1.5% Zn−H2SO4 promoter was applied.6
This high selectivity
toward benzene product was also found with other transition
metals like Mo supported on ZSM-5 in the dehydroaromatiza-
tion of methane, wherein the highest conversion achieved was
in the range of 18% to 20%.2
These may have been due to the
special microporous framework in ZSM-5 which might have
enabled ring formation after an activation of methane to methyl
radicals,5
combining with its Brønsted acidity.7
Moreover, it was
reported that lower coke formation and better conversion in
methane conversion could be achieved in the system of 3 wt %
Mo on ZSM-5 when compared to other supports. However, at
higher temperature the conversion increased up to 10−15 h,
after which the catalyst’s stability started deteriorating.7,8
To solve the problem regarding the activity of the
bifunctional catalyst, Pt and Ru were added. Although Pt
exhibits satisfactory activity, Ru of comparable activity was
more of interest since its bulk price is one-tenth the Pt price,
where a small metal loading of 2% to 5% will be economically
feasible if a substantial yield of higher hydrocarbons is obtained.
Reports on the use of Ru catalyst suggest two-step mechanism
on the methane conversion reaction which was pioneered by
two research groups since 1991 that studied the kinetic and
thermodynamical constraints for the direct conversion of
methane to higher hydrocarbons, where they found that the
Ru, Co, and Pt outperformed Ni, Mo, W and other transition
metals by lowering the activation energy of the exothermic
chemisorption process on the catalyst surface, thus increasing
methane activation and formation of intermediates at moderate
operating conditions.11−13
It was observed that, for the Ru
supported on silica in an oxygen-free methane conversion, the
first step was the activation of methane at 127 to 527 °C
producing intermediate carbonaceous species of methylidene
and vinylidine, wherein the second step of rehydrogenation of
the intermediates at 87 to 107 °C generates ethane as a product
with 13 to 15% yield.12
Another study showed that this same
catalyst methane underwent dissociative adsorption on the
catalyst surface generating three carbonaceous species with an
activation energy of 22 kcal/mol, in which the yield of the
ethane and propane formed after the hydrogenation of aliphatic
hydrocarbons is a function of carbon surface coverage and
hydrogenation temperature.13
Additionally, the advantages of
using Ru catalyst can be illustrated by the optimum Ru−C
bond strength assisting the conversion to surface carbonaceous
species or intermediates which ultimately underwent coupling
or aromatization processes.12
For the case of ZSM-5 supported
Ru catalyst, it was also reported that as high as 80% selectivity
of C12 to C20 products were produced via the conversion of
synthesis gas of CO and H2.14
One of the studies concerning
the Ru catalyst concluded that the addition of Mo/HZSM-5 to
the Ru catalyst could promote the activity of the methane
conversion reaction while increasing benzene product yield
compared to the catalyst without Ru.15
Besides, the strong acid
sites of this catalyst decreased with increasing Ru loading,
whereas the intermediate and weak acid sites increased when
Ru loading was lower than 0.7%.15
Similar study of oxygen-free
methane conversion also proposed that when the Mo loading
was varied from 1 to 3 wt % while keeping the Ru loading
constant at 0.15 wt %, lower coke formation rate was
demonstrated with better stability at the operating condition
of 600 °C although low methane conversion was achieved.16
Despite the positive effect of Ru, the research on the single-
step methane conversion on ZSM-5 supported Ru catalyst has
not yet been studied, and satisfactory reactivity of the catalyst
has not been achieved. As a result, this work was performed to
examine the activity of the Ru catalysts supported on ZSM-5
zeolite (SiO2/Al2O3 ratio of 23:1) and amorphous silica. The
performances of the catalysts were compared at different
operating temperature and metal loading for the activity in a
single-step methane conversion to higher hydrocarbons. In
addition, the activation energies of the first deprotonation step
of methane on these catalysts were predicted via the DFT
analysis.
2. EXPERIMENTAL SECTION
2.1. Catalyst Preparation. Ruthenium catalysts supported on
ZSM-5 and silica were prepared, and the detailed description of
catalyst preparation along with catalyst characterization is provided in
the Supporting Information, S1.
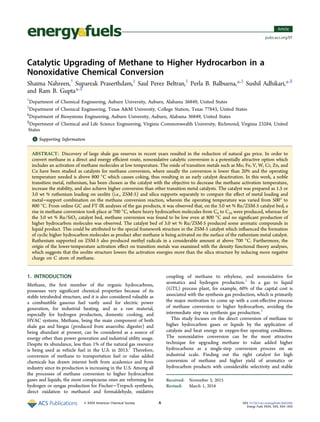
2.2. Experimental Setup and Procedure. A schematic of the
apparatus is illustrated in Figure 1. During the operation, methane of
chemically pure grade, where the flow rate (mL/min) was controlled
by a digital flow meter at a rate of 6 to 8 mL/min, was flowed through
the stainless steel tubular reactor (High Pressure Equipment
Company, Erie, PA) of 0.8 cm internal diameter and 20.4 mL internal
Figure 1. Schematic diagram of experimental setup for direct nonoxidative catalytic upgrading of methane.
Energy & Fuels Article
DOI: 10.1021/acs.energyfuels.5b02583
Energy Fuels XXXX, XXX, XXX−XXX
B
3. volume which was placed inside the electric furnace equipped to
monitor the temperature with a thermocouple (Omega Engineering).
The input pressure of methane was also recoded. The reactor was
packed either with 11 g of Ru/ZSM-5 (4.5 g) and silica sand (6.5 g)
mixture or with 6.4 g of Ru/SiO2 (2.0 g) and silica sand (4.4 g)
mixture. Four catalysts (i.e., 3 wt % Ru/ZSM-5, 1.5 wt % Ru/ZSM-5, 3
wt % Ru/SiO2, pure ZSM-5) were tested. Catalysts were reduced while
flowing H2 at 10 mL/min for 5 h at 500 °C prior to flowing methane.
The outlet line leaving from the reactor was a 316 stainless steel
tubing of 1/16 in. internal diameter and was cooled down with the ice
water bath followed by a double tube heat exchanger using tap water.
After leaving the heat exchanger, the efflux of product gas mixture was
fed to a 30 mL Jerguson gauge with sight glass phase separator, in
which separated gas product existed at the top embedded with a
pressure gauge of 60 psig maximum capacity in order to monitor the
product gas pressure before entering the gas chromatography analyzer.
It was found that a very minute amount of organic liquid product
was collected in the phase separator after 5 h of continuous operation.
Therefore, the liquid product was washed out from the separator using
cyclohexane as a solvent. Operating temperature was varied from 500
to 800 °C with a 100 °C increase with an observed pressure drop that
varied from 15 psia to 17 psia, where the weight hourly space velocity
(WHSV) was obtained in a fixed range of 0.04 to 0.07 h−1
by keeping
the methane flow rate constant in every set of different packing and
temperature.
In order to calculate the conversion of methane, the two-point
calibration line was obtained by first calibrating the GC with 99.9 mol
% CH4 followed by the second calibration with 10 mol % CH4, where
the unconverted methane in the sample was reported in mole fraction,
which is then calculated for methane conversion. The samples
analyzed were collected at a similar point of the operating time
between 15 to 18 h.
2.3. Product Characterization. Gaseous and liquid products were
characterized by several analytic instruments such as gas chromato-
graph (GC), Fourier transform infrared spectroscopy (FTIR),
ultraviolet−visible spectroscopy (UV−vis), and gas chromatogra-
phy−mass spectrometry (GC−MS), and the detailed description is
provided in the Supporting Information, S2.
2.4. Computational Details. 2.4.1. General Computational
Details. Spin-polarized periodic density functional theory (DFT)
calculations were performed via the Vienna ab initio simulation
package (VASP),17−20
in which the Kohn−Sham equations are solved
by self-consistent algorithms. Basis functions were constructed using
the projector augmented wave pseudopotentials (PAW)17
to describe
the core electrons, while the valence electrons were described by plane
wave basis sets with a cutoff energy of 400 eV for all systems. The
exchange-correlation functional was described within the generalized
gradient approximation (GGA) by the revised Perdew−Burke−
Ernzerhof (RPBE).18
Ab initio molecular dynamics simulations
(AIMD) were performed employing the NVT ensemble at 800 °C
with the Nosé−Hoover thermostat, wherein the Nosé mass parameter
of 0.5 and a time step of 1 fs were set. The tritium mass was used
instead of hydrogen mass for H atom in all AIMD simulations. The
Brillouin zone integration was constructed through a Monkhorst−
Pack19
grid of 1 × 1 × 1 (Γ-point) sampling for both DFT and AIMD
calculations. The Gaussian smearing method of 0.05 eV smearing
width was applied for the partial occupancies. For all systems, the
convergence criteria were 10−4
and 10−3
eV for successive electronic
and ionic steps, respectively.
2.4.2. Models of Ru Supported on ZSM-5 and Amorphous Silica.
Ru/ZSM-5 catalyst was modeled based on the crystallographic data of
the 96T cluster ZSM-520
via Materials Studio 6.0 software. In order to
represent the real ZSM-5 structure with the SiO2/Al2O3 ratio of 23:1
as in our experiment, Al atoms were substituted into the imported
structure aforementioned. The position of Al in the ring was suggested
to be on the T12 site of the 10T sinusoidal ring,21
where one Al was
placed at T12 position of each 10T sinusoidal ring as illustrated in
Figure 2. The Ru/ZSM-5 model was constructed from the optimized
ZSM-5 structure by the adsorption of the Ru atom between two
oxygen atoms connecting to the substituted Al atom in the 10T ring as
shown in Figure 2. The optimized structure of Ru/ZSM-5 was
reconstructed from the 96T cluster down to the 10T cluster as shown
in Figure 3. The dangling bonds of the terminal O atoms in the cluster
were saturated by H atoms, where the position of each H atom was
designated by the following two-step procedure.22
In the first step, all
of the Si atoms connected to the terminal O atoms in the
reconstructed 10T cluster were changed into H atoms. The O−H
bonding distance in the terminal OH groups was set to 0.95 Å in the
second step, wherein the 10T nanocluster model of Ru/ZSM-5 was
created as depicted in Figure 3. Prior to the optimization of this
cluster, the minimization of cluster boundary effects was achieved by
constraining all of the terminal OH groups, whereas the other atoms
were relaxed. For the construction of amorphous silica, labeled as SiO2,
the following procedure was implemented.23
The slab of amorphous
silica surface was first obtained, in which all the undercoordinated Si
atoms were saturated with O atoms followed by the saturation of all
the undercoordinated O atoms with H atoms. In order to model Ru/
SiO2 catalyst, after the optimization of the SiO2 slab, the Ru atom was
adsorbed between two OH groups as shown in Figure 4, where the
terminal two H atoms were assumed to desorb as H2 from the Ru
atom analogous to previous reports.24
The Ru on amorphous silica
system was reconstructed after optimization from the 27-Si-atom
surface down to a nanocluster size of Si2O7Ru as shown in Figure 5,
wherein all of the terminal O atoms were saturated by H atoms and all
of the O−H bond lengths were set to 0.95 Å similar to the
construction of Ru/ZSM-5 mentioned above.
Figure 2. (a) 96T cluster model of ZSM-5; (b) 96T cluster model of
Ru/ZSM-5 catalyst.
Figure 3. 10T nanocluster model of Ru/ZSM-5 catalyst.
Energy & Fuels Article
DOI: 10.1021/acs.energyfuels.5b02583
Energy Fuels XXXX, XXX, XXX−XXX
C
4. 2.4.3. Analysis of Atomic Charges. Bader charge analysis29−31
was
employed to obtain the atomic charges, in which the total electronic
charge of an atom is determined by the charge enclosed within the
Bader volume defined by zero flux surfaces. The predicted charges
were obtained for the Ru, C, and H atoms involved in the first
deprotonation step of methane, and the net transferred atomic charges
were compared between Ru/ZSM-5 and Ru/SiO2 systems.
2.4.4. Activation Energy Prediction for Methane Deprotonation
Step. In order to model the deprotonation step, the methane molecule
was built and optimized. It was found that the average bond of the
optimized methane molecule is 1.10 Å with atomic charges of −0.130|
e| for C atom and an average charge of +0.033|e| per H atom. In order
to obtain the activation energy for the first deprotonation step of
methane, the configurations of both reactant and product were
established. The ab initio molecular dynamics (AIMD)28
technique
was applied to initially determine the reactant and product
configurations. Methane adsorbed on the catalyst was designated as
the reactant configuration, whereas the adsorbed H and CH3 species as
products from the first deprotonation step were set as the product
configurations as shown in Figure 6. The reactant configuration as
observed from the AIMD simulations shows that the C−Ru distances
of adsorbed methane on the catalysts were 2.535 and 2.450 Å for Ru/
ZSM-5 and Ru/SiO2, respectively. The product configuration has Ru−
H and C−Ru bond distances of 1.657 and 2.045 Å for Ru/ZSM-5, and
1.684 and 2.041 Å for Ru/SiO2, respectively. The average bond length
of CH4 molecule was obtained directly from the simulation by first
optimizing the CH4 molecule in vacuum environment; then, the
resulting structure was measured for the bond length via Materials
Studio 6.0 software. These AIMD configurations were optimized using
DFT calculations prior to the calculation of the activation energies by
the climbing image nudged elastic band method (cNEB),29,30
wherein
four intermediate images were used for this climbing method
algorithm.
3. RESULTS AND DISCUSSION
3.1. Catalyst Characterizations. With the impregnation of
ruthenium nitrosyl nitrate solution on the ZSM-5, zeolite
support, and calcination at 500 °C, new bonds were created in
between ruthenium metal ion with Al2O3 and SiO2 in zeolite.
Also, presence of ruthenium oxide has been ensured by
comparing the peaks of powder X-ray diffraction patterns of 3.0
wt % Ru/ZSM-5 with Ru2O3 XRD spectra from the literature.31
In Figure 7, a comparison of X-ray diffraction patterns is shown
between pure ZSM-5 zeolite and ruthenium loaded on ZSM-5
support. The presence of ruthenium oxide can be proven on
the catalyst by the characterized peaks at 2θ values of 35° and
54.3° in the spectrum of 3.0 wt % Ru/ZSM-5 which are not
present in the pattern of pure ZSM-5.
Images of the prepared catalysts at micron level have been
taken using a scanning electron microscope (SEM). Energy
dispersive X-ray spectroscopy (EDS) is used along with SEM
imaging (shown in Figure 8) to estimate the composition of
metals and oxygen in the catalyst.
Comparing Figure 8a and Figure 8b, the particle sizes of SiO2
support were significantly larger (6−15 μm) than ZSM-5 (1−5
μm). The dispersed visible white dots on the surface of the
support materials in Figures 8a and 8b and the corresponding
values from the EDS analysis show that the ruthenium is well
dispersed on the surface of support material. The spent catalyst
Figure 4. (a) Amorphous silica (SiO2) slab model; (b) Ru/SiO2
catalyst slab model.
Figure 5. Nanocluster model of Ru/SiO2.
Figure 6. Energy profiles for (a) Ru/ZSM-5 and (b) Ru/SiO2.
Energy & Fuels Article
DOI: 10.1021/acs.energyfuels.5b02583
Energy Fuels XXXX, XXX, XXX−XXX
D
5. (see Figure 8c) of 3.0 wt % Ru/ZSM-5 was clustered with a
much less distinctive dispersed ruthenium metal, which may be
due to the excessive residue carbon covering the surface of
catalyst particles. In addition, when comparing to the pure
ZSM-5 catalyst in Figure 8d the presence of ruthenium in
Figure 8a,b becomes more evident and the particle size of ZSM-
5 was found to be in the same range both as a support material
and as pure catalyst. The elemental analysis results showed that
fresh catalyst sample of 3 wt % Ru/ZSM-5, spent catalyst
sample of 3 wt % Ru/ZSM-5, and fresh catalyst sample of 3 wt
% Ru/SiO2 contain 3.35%, 3.54%, and 2.46% of ruthenium by
weight, respectively. These results also support the statement
that the SEM-EDS analysis of the spent catalyst sample of 3 wt
% Ru/ZSM-5 showed a lower amount of ruthenium than the
actual value due to surface coverage by coke deposition.
Bonds formed in the catalysts containing ruthenium were
principally between the ruthenium metal or metal oxide with
the Al or Si atom in the case of the ZSM-5 support and only
with a Si atom for SiO2. In order to compare these bonds
formed, the peaks in the spectra generated from the Fourier
transform infrared spectroscopy were carried out on the fresh
and spent catalysts on support material and also for pure ZSM-
5 as shown in Figure 9.
Significant differences can be noticed for the area under the
peaks between fresh and spent catalysts. The ZSM-5 supported
catalysts showed higher peak height with a greater area under
the peaks for the fresh catalysts compared to the spent ones.
The decrease in peak height and peak area implies the
deterioration in catalyst activity. No new chemical bonds were
formed in the catalyst with either the reactant or product
molecules as no new peaks were observed in the spectra of the
spent catalyst compared to the spectra of the fresh one. For the
SiO2-supported ruthenium metal catalyst, not much change in
peak heights and peak area was found which can be due to its
low surface activity, thus almost no change in the IR spectra of
the sample taken after 25 h of operation.
The BET surface area and pore volume of fresh and spent
catalysts were compared as shown in Table 1 in order to
determine the stability of the catalyst since, if the surface area
and pore volume change with a significant rate, it can be
assumed that the stability of the catalyst is low.
From Table 1, when comparing among the surface area of
the pure ZSM-5, 1.5 wt % Ru/ZSM-5, and 3.0 wt % Ru/ZSM-5
fresh catalysts, it was found that surface area decreases with
metal loading. On the other hand, in the case of SiO2 it is
evident by the SEM image (Figure 8a) that the support has
larger particle size, hence, possesses lower surface area than in
the case of ZSM-5 as can be seen in Table 1. Significant
difference in surface area was observed between fresh and spent
3.0 wt % Ru/ZSM-5 catalysts indicating coke deposition from
the methane conversion reaction over an operating time of 60
h. However, the pore volume was observed to increase for the
spent catalyst probably due to the transformation of micropores
to meso- and macropores.
Pore structures and sizes of the catalyst support play a very
important role in catalyst activity and conversion. It can be
found from the literature that the channel structure in ZSM-5
creates a framework and micropores and mesopores which
contribute in shape selective catalysis.32
ZSM-5 supported
transition metal catalysts were studied and found to produce
aromatics from direct conversion of methane,4,28
however silica
Figure 7. Comparison of X-ray diffraction spectra of pure ZSM-5 and
3.0 wt % Ru/ZSM-5.
Figure 8. SEM images with EDS analysis of (a) 3.0 wt % Ru/SiO2
fresh catalyst, (b) 3.0 wt % Ru/ZSM-5 fresh catalyst, (c) 3.0 wt % Ru-
ZSM-5 spent catalyst, and (d) pure ZSM-5 fresh catalyst.
Energy & Fuels Article
DOI: 10.1021/acs.energyfuels.5b02583
Energy Fuels XXXX, XXX, XXX−XXX
E
6. supported transition metal catalysts were found to produce
primarily C2 and C3 hydrocarbon gases due to the difference in
pore structure and sizes.10,12
Also other catalysts as Zr(PO)4
supported ruthenium metal produced lighter hydrocarbons (C1
to C5), and it is evident that pore structures and characteristics
of support materials play a very important role in selectivity of
product33
In order to determine the optimum reduction temperature
for the 3.0 wt % Ru/ZSM-5, the calcined sample was analyzed
by the H2 temperature-programmed reduction analysis (TPR).
The results interpreted from the TCD signal indicated that at
the reduction temperature of 110 °C the highest rate of
ruthenium oxide reduction has already been reached. The in
situ reduction was performed at a much higher temperature in
the reactor as previous studies reported that a higher reduction
temperature contributes to the increasing in the active metal
surface area by the removal of an anion part of the metal salt.34
3.2. Reaction Mechanism. The conversion of methane has
been compared among different ruthenium metal catalysts
supported on either a ZSM-5 or silica support. The effects of
metal loading and metal−support combination on methane
conversion mechanism were studied. The proposed reactions
taking place when the bifunctional catalyst of ruthenium metal
supported on ZSM-5 zeolite support is used in a continuous
flow packed bed reactor at operating temperatures higher than
500 °C can be illustrated as
→ * +
Δ
HCH CH
1
2
4 3 2
(1)
→ * +
Δ
CH C 2H4 2 (2)
* ⎯ →⎯⎯⎯⎯⎯⎯ +
−
6CH C H 6H3
ZSM 5
6 6 2 (3)
where the asterisk (*) indicates surface species.
Methane molecules are first chemisorbed on ruthenium
metal, and then dehydrogenation takes place at high temper-
ature.10
The methyl radicals then undergo cyclization in the
ZSM-5 pore structures to produce aromatics.
3.3. Effects of Temperature. The catalyst performance in
a conversion of methane to higher hydrocarbon products and
hydrogen was evaluated based on two criteria: the quality of
product (the presence of higher hydrocarbon molecules in the
product mixture) and the methane conversion. The procedure
was performed by varying the operating temperature while
keeping the feed flow rate and catalyst bed pressure at a
constant range of 5 to 10 mL/min and 15 to 18 psia,
respectively. The product gas analyzed by the FTIR showed no
significant changes in the bond structure from the product gas
for 1.5 wt % Ru/ZSM-5 catalyst, which implied that no alkenes,
alkynes, or aromatic hydrocarbon products were formed even at
higher operating temperature. Similar results were also
observed in the case of 3.0 wt % Ru/SiO2 catalyst. In contrast,
the high metal loading 3.0 wt % Ru/ZSM-5 operated at 700
and 800 °C showed a new spectral peak undetected in either
the 1.5 wt % Ru/ZSM-5 or 3.0 wt % Ru/SiO2 catalysts (not
shown here) eluted at 1615 cm−1
as shown in Figure 10. It was
designated to the unsaturated hydrocarbons or benzene ring
found in the product gas mixture, whereas that peak was not
observed in lower operating temperatures.
Moreover, the characteristics of the product obtained from
temperature range of 700 to 800 °C on the 3.0 wt % Ru/ZSM-
5 were further investigated employing UV−vis spectroscopy
(Figure 11). The figure shows pure cyclohexane (solvent) as
well as the product profiles. The product exhibits two new
peaks between the wavelengths of 220 and 260 nm.
Additionally, the liquid product was separately analyzed as
can be seen in Figure 12, in which the peak designated to
benzene was observed. From both the IR spectra and UV−vis
spectroscopic analyses, it was evident that, at the higher
Figure 9. Comparison of FT-IR spectra of fresh and spent catalysts.
Table 1. BET Surface Area and Pore Size Data for Different
Catalysts
catalyst
surf area (m2
/
g)
pore vol (cm3
/
g)
pore size
(nm)
pure ZSM-5 (fresh)a
403 0.36 3.50
3.0 wt % Ru/ZSM-5
(fresh)
329 0.21 1.29
3.0 wt % Ru/ZSM-5
(spent)
235 0.37 3.12
3.0 wt % Ru/SiO2 (fresh) 177 2.28 25.65
3.0 wt % Ru/SiO2 (spent) 171 1.21 14.16
1.5 wt % Ru/ZSM-5
(fresh)
334 0.31 1.88
1.5 wt % Ru/ZSM-5
(spent)
315 0.20 1.29
a
Calcined at 500 °C for 5 h; same as for other catalysts.
Figure 10. Comparison of FT-IR spectra of product gas mixture at
different operating temperatures on 3.0 wt % Ru/ZSM-5 catalyst bed.
Energy & Fuels Article
DOI: 10.1021/acs.energyfuels.5b02583
Energy Fuels XXXX, XXX, XXX−XXX
F
7. operating temperature range of 700 to 800 °C, CH4 conversion
to aromatic hydrocarbon has taken place on the 3.0 wt % Ru/
ZSM-5 catalyst bed.
3.4. Methane Conversion Analyzed by Online GC. In
Figure 13, it is demonstrated that temperature played a very
significant role in methane conversion. At 500 and 600 °C,
methane conversion was lower than 15% for all the catalysts,
but a rise in conversion was noticed at 700 °C for 3.0 wt % Ru/
ZSM-5 single catalyst bed. At 800 °C, this catalyst showed the
highest conversion among others. This can be explained by the
ruthenium metal contributing to the activation of CH4 to
methyl free radical, in which the special channel structure and
sheets consisting of the chains of five membered rings of ZSM-
5 aid the formation of benzene-like structure from this methyl
radical,28,33
without the formation of carbon black from the
dissociation of methyl radicals. Additionally, higher hydro-
carbons, especially the cyclic structures (e.g., methylcyclohex-
ane, isopropylcyclobutane, dimethylcyclopentane), were also
detected by the GC−MS analysis of the solvent-washed
product. The total product ranges from hydrocarbons of
seven up to as high as 20 carbon atoms. The presence of higher
hydrocarbon in the gas phase of product has also been ensured
by the chromatograms collected from online GC with the
reactor. For 3 wt % Ru/ZSM-5 catalyst packed bed, the product
gas mixtures demonstrated chromatograms with significant area
under the peaks for hydrocarbons chains or cyclic structures
containing higher than four carbons. As the column has been
calibrated with calibration gases consisting of C1 to C4
hydrocarbon gases and it was observed in the product gas
mixture chromatogram that these peaks were eluted after the
retention time of C4 hydrocarbon, it can be assumed that
hydrocarbons consisting of five or more carbon atoms were
produced. For other catalysts no such high hydrocarbon
product peak was found in the chromatogram other than
hydrogen and unconverted methane gas.
3.5. Percent Yield of Hydrogen. Hydrogen yield has the
same trend as methane conversion where the ZSM-5 supported
catalyst held the highest yield at higher temperature, whereas
the silica supported possessed lower hydrogen yield. In
addition, the yield of hydrogen is directly proportional to the
operating temperature for all catalysts.
From Figure 14, it is found that pure ZSM-5 single catalyst
bed contributed to a higher yield of hydrogen at 800 °C
compared to other catalysts at the same temperature. Although
the pure ZSM-5 has highest yield of hydrogen, the conversion
of methane was significantly lower than 3.0 wt % Ru/ZSM-5,
which implies that if only pure ZSM-5 is used, a much lower
amount of higher hydrocarbon will be produced. On the
contrary, even though the 3.0 wt % Ru/ZSM-5 exhibited a
lower yield of hydrogen, a much higher conversion of methane
explained heavier hydrocarbon molecules observed in the
product stream as the rest of the hydrogen was contributing to
the formation of the heavier hydrocarbons.
3.6. Effect of Operating Time. To find out the effect of
operating time on the conversion rate as well as on catalyst life,
60 h of continuous reaction at 800 °C has been conducted on
Figure 11. Comparison between the UV−vis spectra of the liquid
product in solvent from CH4 conversion on 3.0 wt % Ru/ZSM-5
catalyst bed at 800 °C and the pure solvent of cyclohexane.
Figure 12. UV−vis spectrum of product liquid of conversion of CH4
on 3.0 wt % Ru/ZSM-5 catalyst bed at 800 °C.
Figure 13. Conversion of CH4 with operating temperature on
different catalysts.
Figure 14. Percent yield of hydrogen from methane conversion
reaction on different catalyst beds at different operating temperatures.
Energy & Fuels Article
DOI: 10.1021/acs.energyfuels.5b02583
Energy Fuels XXXX, XXX, XXX−XXX
G
8. the 3.0 wt % Ru/ZSM-5 catalyst bed as it exhibited the best
catalytic performance, and product samples were being
analyzed every 2 h with the online GC-TCD. It is observed
from Figure 15 that methane conversion was stable from 5 up
to 35 h; then it increased to 55% at 46 h of operation before it
slightly decreased to 50% at 60 h of operation, which was still
higher than the conversion achieved in the first 35 h.
Not only was the conversion high after 40 h of operation but
it is also perceived that hydrogen yield was high as well in the
range of 30% to 38% between 26 and 50 h of reaction as shown
in Figure 16. Up to 60 h of continuous operation, the
conversion of methane went down slightly, whereas the
hydrogen yield rose up as high as 47%, which was probably
due to methane dissociation to hydrogen and carbon black
formation. As a result, the catalyst activity started to deteriorate.
Considering both methane conversion and hydrogen yield
during the continuous reaction of 60 h on a 3.0 wt % Ru/ZSM-
5, it can be seen that, during 5 to 35 h of operation, the catalyst
performance and product quality were stable and consistent
though hydrogen yield increased slowly. These results showed
an improvement of the catalyst’s life when using Ru compared
to other transition metal catalysts supported on zeolite or
silica.1,2
The amount of coke deposition was measured by
thermogravimetric analysis. A weight loss of 16.5 wt % was
observed from this spent catalyst as the temperature increases
from 22 to 900 °C in 135 min (Figure 17). As a result, high
stability of the 3.0 wt % Ru/ZSM-5 catalyst was confirmed
since a smaller amount of coke (16.5 wt % of catalyst) was
formed even after a long operation time of 60 h. Compared to
other studies where ZSM-5 supported transition metal catalysts
were used, methane conversion started deteriorating after 8 to
10 h of operation, implying early catalyst deactivation for direct
methane conversion reactions.5
Also coke formation was found
to be 18 to 30 wt % at 700 °C for Mo/HMCM-22 catalyst.
3.7. Methane Activation on Ru/ZSM-5 and Ru/SiO2.
The presence of the support is known to affect the activity of
the catalyst as can be seen from the predicted atomic charges
and activation energy for the first deprotonation step of
methane. Bader charge analysis predicted that the charges
transferred to Ru, C, and H atoms in Ru/ZSM-5 are +0.705|e|,
−0.226|e|, and +0.024|e|, respectively, whereas for Ru/SiO2 the
charges transferred are +1.02|e| for Ru atom, −0.106|e| for C
atom, and +0.016|e| for H atom. Thus, it is found that the Ru/
ZSM-5 system induces more negative charge on the C atom
and more positive charge on the H atom than the Ru/SiO2
system does. As expected from the Bader charge analysis, it was
found that the Ru/ZSM-5 catalyst lowers the activation energy,
Ea, for the first deprotonation step of methane more than the
Ru/SiO2 catalyst. The predicted activation energy obtained
from the climbing image nudged elastic band method
(cNEB)3,4
was 19.20 kJ/mol-CH4 for Ru/ZSM-5, while a
higher activation energy of 67.55 kJ/mol-CH4 was predicted for
the Ru/SiO2, which are illustrated in Figure 6. It is also found
that for the first deprotonation step Ru/ZSM-5 has an
exothermic heat of reaction of −4.88 kJ/mol-CH4, while for
the Ru/SiO2 an endothermic heat of reaction of +67.38 kJ/mol-
CH4 was obtained.
4. CONCLUSION
Direct methane conversion to higher hydrocarbon products
was studied in an oxygen free route. Ruthenium supported on
ZSM-5 and SiO2 catalysts was tested for methane conversion,
and the study found that the 3 wt % Ru/ZSM-5 performed the
best, both in conversion and in product quality. Above 40% of
methane conversion was achieved at 800 °C operating
temperature, where C5 to C8 cyclic hydrocarbon were produced
Figure 15. Conversion of methane versus hours of operation on 3.0 wt
% Ru/ZSM-5 catalyst packed bed at 800 °C.
Figure 16. Percent yield of hydrogen versus hours of operation on single catalyst bed of 3.0 wt % Ru/ZSM-5 at 800 °C.
Figure 17. Thermogravimetric analysis results on spent catalyst of 3.0
wt % Ru/ZSM-5 after 60 h of operation.
Energy & Fuels Article
DOI: 10.1021/acs.energyfuels.5b02583
Energy Fuels XXXX, XXX, XXX−XXX
H
9. along with hydrogen. However, lower ruthenium loading of 1.5
wt % did not contribute to producing higher hydrocarbon
products the same as in the case of 3 wt % Ru/SiO2 catalyst
which showed low conversion even at high temperature and no
higher hydrocarbon product was observed. For catalyst
longevity study, 3 wt % Ru/ZSM-5 started to deteriorate
after 40 h of reaction. Compared to other transition metal
catalysts, this bifunctional catalyst (ruthenium metal on ZSM-5
support) has certainly shown potential in catalyst performance
in terms of methane conversion and stable catalyst life at high
operating temperature. Computational results also showed that,
for the first deprotonation step of methane to methyl(CH3)
and hydrogen radicals, the predicted activation energy for Ru/
ZSM-5 was found to be lower than that of the Ru/SiO2. This
may be caused by the more negative charge on C atom induced
by the Ru/ZSM-5 structure. This suggested that the ZSM-5
support has an effect of lowering the activation barrier for the
first deprotonation step of methane, which is an important
initial step toward the formation of higher hydrocarbons.
■ ASSOCIATED CONTENT
*S Supporting Information
The Supporting Information is available free of charge on the
ACS Publications website at DOI: 10.1021/acs.energy-
fuels.5b02583.
Catalyst preparation, characterization, and product
distribution from methane activation (PDF)
■ AUTHOR INFORMATION
Corresponding Authors
*E-mail: balbuena@exchange.tamu.edu (P. B. Balbuena).
*E-mail: sushil.adhikari@auburn.edu. Tel: +1 334 844 3543;
fax: +1 334 844 3530. (S. Adhikari).
*E-mail: rbgupta@vcu.edu (R. B. Gupta).
Notes
The authors declare no competing financial interest.
■ ACKNOWLEDGMENTS
S.N. would like to thank Alabama Agricultural Experiment
Station (AAES) for funding this study (ALA014-1-13006). The
authors are thankful to Zhouhong Wang for his help in
collecting catalyst surface area data. However, only the authors
are responsible for any remaining errors in this manuscript.
■ REFERENCES
(1) Chynoweth, D. P.; Owens, J. M.; Legrand, R. Renewable methane
from anaerobic digestion of biomass,. Renewable Energy 2001, 22, 1−8.
(2) Lunsford, J. H. Catalytic conversion of methane to more useful
chemicals and fuels: a challenge for the 21st century,. Catal. Today
2000, 63, 165−174.
(3) Holmen, A. Direct conversion of methane to fuels and chemicals,.
Catal. Today 2009, 142, 2−8.
(4) Majhi, S.; Mohanty, P.; Wang, H.; Pant, K. K. Direct conversion
of natural gas to higher hydrocarbons: A review,. J. Energy Chem. 2013,
22, 543−554.
(5) Weckhuysen, B. M.; Wang, D.; Rosynek, M. P.; Lunsford, J. H.
Conversion of Methane to Benzene over Transition Metal Ion ZSM-5
Zeolites. J. Catal. 1998, 175, 338−346.
(6) Zeng, J.; Xiong, Z.; Zhang, H.; Lin, G.; Tsai, K. Nonoxidative
dehydrogenation and aromatization of methane over W/HZSM-5-
based catalysts,. Catal. Lett. 1998, 53, 119−124.
(7) Choudhary, T. V.; Aksoylu, E.; Wayne Goodman, D. Non-
oxidative Activation of Methane. Catal. Rev.: Sci. Eng. 2003, 45, 151−
203.
(8) Wang, D.; Lunsford, J. H.; Rosynek, M. P. Characterization of a
Mo/ZSM-5 Catalyst for the Conversion of Methane to Benzene. J.
Catal. 1997, 169, 347−358.
(9) Amariglio, H.; Saint-Just, J.; Amariglio, A. Homologation of
methane under non-oxidative conditions,. Fuel Process. Technol. 1995,
42, 291−323.
(10) Belgued, M.; Amariglio, A.; Lefort, L.; Pareja, P.; Amariglio, H.
Oxygen-Free Conversion of Methane to Higher Alkanes through an
Isothermal Two-Step Reaction on Ruthenium. J. Catal. 1996, 161,
282−291.
(11) Belgued, M.; Amariglio, A.; Pareja, P.; Amariglio, H. Oxygen-
Free Conversion of Methane to Higher Alkanes through an Isothermal
Two-Step Reaction on Platinum (EUROPT-1). J. Catal. 1996, 159,
441−448.
(12) Koranne, M.; Goodman, D.; Zajac, G. Direct conversion of
methane to higher hydrocarbons via an oxygen free, low-temperature
route. Catal. Lett. 1995, 30, 219−234.
(13) Carstens, J.; Bell, A. Methane activation and conversion to
higher hydrocarbons on supported ruthenium. J. Catal. 1996, 161,
423−429.
(14) Kandaswamy, J.; Kibby, L.; Saxton, J. Zeolite supported ruthenium
catalysts for the conversion of synthesis gas to hydrocarbons, and method
for preparation and method of use thereof. US Patent and Trademark
Office, 15-Dec-2011.
(15) Shu, Y.; Xu, Y.; Wong, S.; Wang, L.; Guo, X. Promotional Effect
of Ru on the Dehydrogenation and Aromatization of Methane in the
Absence of Oxygen over Mo/HZSM-5 Catalysts. J. Catal. 1997, 170,
11−19.
(16) Hassan, A.; Sayari, A. Highly active, selective and stable Mo/Ru-
HZSM-5 catalysts for oxygen-free methane aromatization,. Appl.
Catal., A 2006, 297, 159−164.
(17) Blöchl, P. E. Projector augmented-wave method. Phys. Rev. B:
Condens. Matter Mater. Phys. 1994, 50, 17953−17979.
(18) Hammer, B.; Hansen, L.; Nørskov, J. Improved adsorption
energetics within density-functional theory using revised Perdew-
Burke-Ernzerhof functionals. Phys. Rev. B: Condens. Matter Mater. Phys.
1999, 59, 7413−7421.
(19) Pack, J. D.; Monkhorst, H. J. Special points for Brillouin-zone
integrations. Phys. Rev. B 1976, 13, 5188−5192.
(20) Schmidt, W.; Wilczok, U.; Weidenthaler, C.; Medenbach, O.;
Goddard, R.; Buth, G.; Cepak, A. Preparation and morphology of
pyramidal MFI single-crystal segments. J. Phys. Chem. B 2007, 111,
13538−13543.
(21) Olson, D. H.; Khosrovani, N.; Peters, A. W.; Toby, B. H. Crystal
Structure of Dehydrated CsZSM-5 (5.8Al): Evidence for Nonrandom
Aluminum Distribution. J. Phys. Chem. B 2000, 104, 4844−4848.
(22) Gao, J.; Zheng, Y.; Fitzgerald, G. B.; de Joannis, J.; Tang, Y.;
Wachs, I. E.; Podkolzin, S. G. Structure of Mo 2 C x and Mo 4 C x
Molybdenum Carbide Nanoparticles and Their Anchoring Sites on
ZSM-5 Zeolites. J. Phys. Chem. C 2014, 118, 4670−4679.
(23) Ewing, C. S.; Bhavsar, S.; Veser, G.; McCarthy, J. J.; Johnson, J.
K. Accurate amorphous silica surface models from first-principles
thermodynamics of surface dehydroxylation. Langmuir 2014, 30,
5133−5141.
(24) Ewing, C. S.; Hartmann, M. J.; Martin, K. R.; Musto, A. M.;
Padinjarekutt, S. J.; Weiss, E. M.; Veser, G.; McCarthy, J. J.; Johnson, J.
K.; Lambrecht, D. S. Structural and Electronic Properties of Pt 13
Nanoclusters on Amorphous Silica Supports. J. Phys. Chem. C 2015,
119, 2503−2512.
(25) Henkelman, G.; Arnaldsson, A.; Jónsson, H. A fast and robust
algorithm for Bader decomposition of charge density. Comput. Mater.
Sci. 2006, 36, 354−360.
(26) Sanville, E.; Kenny, S. D.; Smith, R.; Henkelman, G. Improved
grid-based algorithm for Bader charge allocation. J. Comput. Chem.
2007, 28, 899−908.
Energy & Fuels Article
DOI: 10.1021/acs.energyfuels.5b02583
Energy Fuels XXXX, XXX, XXX−XXX
I
10. (27) Tang, W.; Sanville, E.; Henkelman, G. A grid-based Bader
analysis algorithm without lattice bias. J. Phys.: Condens. Matter 2009,
21, 084204.
(28) Kresse, G. Ab initio molecular dynamics for liquid metals. J.
Non-Cryst. Solids 1995, 192-193, 222−229.
(29) Henkelman, G.; Jónsson, H. Improved tangent estimate in the
nudged elastic band method for finding minimum energy paths and
saddle points. J. Chem. Phys. 2000, 113, 9978−9985.
(30) Henkelman, G.; Uberuaga, B. P.; Jónsson, H. Climbing image
nudged elastic band method for finding saddle points and minimum
energy paths. J. Chem. Phys. 2000, 113, 9901−9904.
(31) Green, M. L.; Gross, M. E.; Papa, L. E.; Schnoes, K. J.; Brasen,
D. Chemical Vapor Deposition of Ruthenium and Ruthenium Dioxide
Films. J. Electrochem. Soc. 1985, 132, 2677−2685.
(32) Kokotailo, G. T.; Lawton, S. L.; Olson, D. H.; Meier, W. M.
Structure of synthetic zeolite ZSM-5,. Nature 1978, 272, 437−438.
(33) Cheikhi, N.; Ziyad, M.; Coudurier, G. Conversion of methane to
higher alkanes by ruthenium loaded Zr3(PO4)4. Appl. Catal., A 1994,
118, 187−198.
(34) Koopman, P. Characterization of ruthenium catalysts as studied
by temperature programmed reduction. J. Catal. 1981, 69, 172−179.
Energy & Fuels Article
DOI: 10.1021/acs.energyfuels.5b02583
Energy Fuels XXXX, XXX, XXX−XXX
J