SMG Customer Satisfaction Index UK infographic
- 1. Customer Satisfaction Infographic_Customer Satisfaction Infographic 1
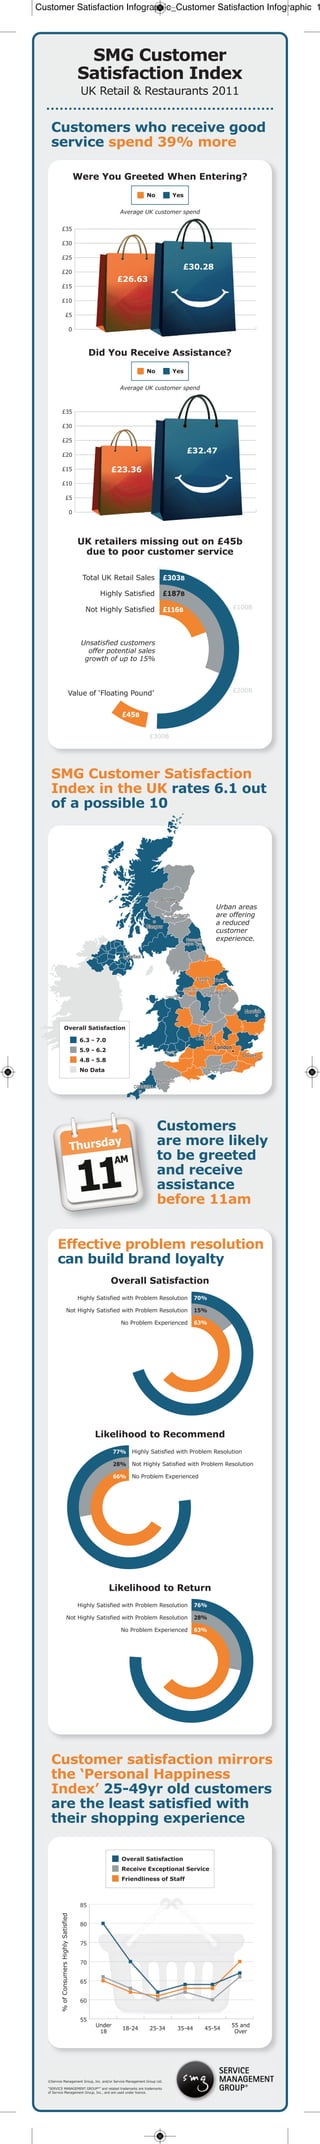
SMG Customer
Satisfaction Index
UK Retail & Restaurants 2011
Customers who receive good
service spend 39% more
Were You Greeted When Entering?
No Yes
Average UK customer spend
£35
£30
£25
£30.28
£20
£26.63
£15
£10
£5
0
Did You Receive Assistance?
No Yes
Average UK customer spend
£35
£30
£25
£20
£32.47
£15 £23.36
£10
£5
0
UK retailers missing out on £45b
due to poor customer service
Unsatisfied customers
offer potential sales
growth of up to 15%
SMG Customer Satisfaction
Index in the UK rates 6.1 out
of a possible 10
Urban areas
are offering
a reduced
customer
experience.
Overall Satisfaction
6.3 - 7.0
5.9 - 6.2
4.8 - 5.8
No Data
Customers
are more likely
to be greeted
and receive
assistance
before 11am
Effective problem resolution
can build brand loyalty
Overall Satisfaction
Likelihood to Recommend
Likelihood to Return
Customer satisfaction mirrors
the ‘Personal Happiness
Index’ 25-49yr old customers
are the least satisfied with
their shopping experience
Overall Satisfaction
Receive Exceptional Service
Friendliness of Staff
©Service Management Group, Inc. and/or Service Management Group Ltd.
“SERVICE MANAGEMENT GROUP®” and related trademarks are trademarks
of Service Management Group, Inc., and are used under licence.