

Empfohlen
Weitere ähnliche Inhalte
Ähnlich wie Brochure 7 26-11 east-court_village
Ähnlich wie Brochure 7 26-11 east-court_village (20)
Kürzlich hochgeladen
Kürzlich hochgeladen (20)
Brochure 7 26-11 east-court_village
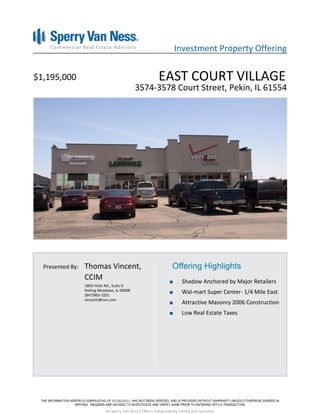
- 1. Investment Property Offering $1,195,000 EAST COURT VILLAGE 3574-3578 Court Street, Pekin, IL 61554 Presented By: Thomas Vincent, Offering Highlights CCIM Shadow Anchored by Major Retailers 1803 Hicks Rd., Suite D Rolling Meadows, IL 60008 (847)963-1031 Wal-mart Super Center- 1/4 Mile East vincentt@svn.com Attractive Masonry 2006 Construction Low Real Estate Taxes 07/26/2011 All Sperry Van Ness® Offices Independently Owned and Operated.
- 2. All materials and information received or derived from Sperry Van Ness/Sentinel Realty Advisors, Inc. (Thomas S. Vincent)(hereinafter collectively “Sperry Van Ness”), its directors, officers, agents, advisors, affiliates and/or any third party sources are provided without representation or warranty by Sperry Van Ness its directors, officers, agents, advisors, or affiliates as to completeness , veracity, or accuracy, condition of the property, compliance or lack of compliance with applicable governmental requirements, developability or suitability, financial performance of the property, projected financial performance of the property for any party’s intended use or any and all other matters. Neither Sperry Van Ness its directors, officers, agents, advisors, or affiliates makes any representation or warranty, express or implied, as to accuracy or completeness of the any materials or information provided, derived, or received. Materials and information from any source, whether written or verbal, that may be furnished for review are not a substitute for a party’s active conduct of its own due diligence to determine these and other matters of significance to such party. Sperry Van Ness will not investigate or verify any such matters or conduct due diligence for a party unless otherwise agreed in writing. EACH PARTY SHALL CONDUCT ITS OWN INDEPENDENT INVESTIGATION AND DUE DILIGENCE. Any party contemplating or under contract or in escrow for a transaction is urged to verify all information and to conduct their own inspections and investigations including through appropriate third party independent professionals selected by such party. All financial data should be verified by the party including by obtaining and reading applicable documents and reports and consulting appropriate independent professionals. Sperry Van Ness makes no warranties and/or representations regarding the veracity, completeness, or relevance of any financial data or assumptions. Sperry Van Ness does not serve as a financial advisor to any party regarding any proposed transaction. All data and assumptions regarding financial performance, including that used for financial modeling purposes, may differ from actual data or performance. Any estimates of market rents and/or projected rents that may be provided to a party do not necessarily mean that rents can be established at or increased to that level. Parties must evaluate any applicable contractual and governmental limitations as well as market conditions, vacancy factors and other issues in order to determine rents from or for the property. Legal questions should be discussed by the party with an attorney. Tax questions should be discussed by the party with a certified public accountant or tax attorney. Title questions should be discussed by the party with a title officer or attorney. Questions regarding the condition of the property and whether the property complies with applicable governmental requirements should be discussed by the party with appropriate engineers, architects, contractors, other consultants and governmental agencies. All properties and services are marketed by Sperry Van Ness in compliance with all applicable fair housing and equal opportunity laws. Sperry Van Ness/Sentinel Realty Advisors, Inc. (Thomas S. Vincent) is independently owned and operated.
- 3. Table of Contents 1 Financial Analysis Executive Summary Investment Information Rent Roll Summary 2 Sales Comparables Sales Comparables Summary 3 Additional Information Pictures Location Map Demographics Report The information listed above has been obtained from sources we believe to be reliable, however, we accept no responsibility for its correctness.
- 4. 1 . Financial Analysis All Sperry Van Ness® Offices Independently Owned and Operated.
- 5. EAST COURT VILLAGE Executive Summary List Price $1,195,000 Price Per GLA $222.95 Price Per Sq.Ft. $222.95 NOI $107,007 CAP 8.95 % Building Sq.Ft. 5,360 Land Acres 0.7500 Occupancy. PROPERTY DESCRIPTION 3574-3578 Court Street, Pekin, IL 61554 Construction Built in 2006-attractive drivit construction. Parking HIGHLIGHTS Approximately a 5:1 ratio Shadow Anchored by Major Retailers Traffic Counts Traffic count on Court St: 17,800 cars Wal-mart Super Center- 1/4 Mile East Ingress/Egress Attractive Masonry 2006 Construction Property is a pad site on large retail development. Principal access is from Court St, secondary access from Veterans Drive. Low Real Estate Taxes Major Tenants Verizon Wireless and Citigroup. Verizon exercised option-5 years remaining. Citibank 18 months remaining. Verizon and Citibank are NNN leases Cross Street Area Tax Parcel No. The area is the retail hub of Pekin. A new Wal-Mart Super Market Peoria Center & Menards are located d within 1/4 mile of the site. The property is part of a re-development with several anchors Sub Market including Hobby Lobby, Tractor Supply and Bergners as well as Year Built 2006 excellent smaller tenants such as Clare's, Payless Shoes and Hallmark. Other major tenants in the area include Staples, Building Class A Advance Auto, Sherwin Williams, Starbucks, Applebees as well Location Class A as several banks. The building faces south, toward Bergner's and Zoning Type Commercial the rear elevation front Court St., providing excellent exposure. Signalized Corner No Property The building faces south toward Bergner's and the rear Street Frontage elevation fronts Court St. providing excellent exposure. No. of Buildings 1 No. of Stories Exclusively Listed By: No. of Tenants 3 No. of Parking Spaces Thomas Vincent, CCIM Parking Ratio 5:1 (847)963-1031 vincentt@svn.com 07/26/2011
- 6. Investment Information EAST COURT VILLAGE 3574-3578 Court Street Pekin, IL 61554 Listing Price $1,195,000 GLA 5,360 Actual CAP 8.95 % Building S.F. 5,360 CAP Percent Occupied 100.00 % Price Per S.F. $222.95 Land Acres 0.7500 Price Per GLA $222.95 Loan Amount Expenses Per S.F. $4.40 Down Payment Loan Description Estimated Annualized Operating Data Actual Scheduled Income $113,880 Tax, CAM, Ins. Reimb. $23,588 Less Vacancy $6,873 Gross Operating Income $130,595 Less Expenses $23,588 Net Operating Income $107,007 Less Loan Payment $0 Pre-Tax Cash Flow $107,007 Cash on Cash Return Estimated Annualized Expenses Highlights Actual Projected Taxes $9,751 Shadow Anchored by Major Retailers Insurance $2,126 Wal-mart Super Center- 1/4 Mile East Off-Site Management $3,000 Attractive Masonry 2006 Construction Trash $3,053 Low Real Estate Taxes Snow Removal $1,496 Landscaping $1,542 Lot Sweeping $571 Utilities $2,049 Total Expenses $23,588 $0 Expenses Per S.F. $4.40 The information listed above has been obtained from sources we believe to be reliable, however, we accept no responsibility for its correctness.
- 7. w w w .s vn .c o m Rent Roll Summary Space Tenant Name Start Date End Date Occupied Vacant Annual Occupied Vacant % of Escalations / Options / Comments Number S.F. S.F. Rent S.F. Rent Rent Total 1 Verizon 4/1/2006 4/30/2016 3,000 $25.00 $75,000 $0 56.0 % 2 Renewal Options- 5 yr terms with increases 2 Citigroup 7/1/2007 1/31/2013 1,800 $16.00 $28,800 $0 33.6 % 1 Renewal Option- 5 yr term 3 All Credit Lenders 12/31/2012 560 $18.00 $10,080 $0 10.4 % Total 5,360 $113,880 $0 100.0 % Potential Annual Income $113,880 Total S.F. 5,360 Avg. Annual Per S.F. $21.25 S.F. Vacancy (%) Rent Vacancy (%) The information listed above has been obtained from sources we believe to be reliable, however, we accept no responsibility for its correctness. All Sperry Van Ness® Offices Independently Owned and Operated.
- 8. 2 . Sales Comparables All Sperry Van Ness® Offices Independently Owned and Operated.
- 9. w w w .s vn .c o m Sales Comparables Summary Sales Comparables - Closed Property Location Sale Price Year Built Bldg S.F. Price/S.F. CAP Parking Spaces Close Photo Prairie Pointe $2,525,150 11,876 $212.63 8.00 % 9010 Allen Rd. Tenants include Edward Jones, Pizza Factory and Great Harvest Bread Peoria,IL Averages $2,525,150 11,876 $212.63 8.00 % Sales Comparables - On Market Property Location Sale Price Year Built Bldg S.F. Price/S.F. CAP Parking Spaces Close Photo Heritage Crossing $3,729,000 2009 12,050 $309.46 8.53 % 60 712 N. McLean Blvd. South Elgin,IL 60177 Fox River Grove Center $2,940,000 2008 14,035 $209.48 8.75 % 70 925 Rt. 22 Automotive tenant on end cap, only retail pocket in community Fox River Grove ,IL 60021 The information listed above has been obtained from sources we believe to be reliable, however, we accept no responsibility for its correctness. All Sperry Van Ness® Offices Independently Owned and Operated.
- 10. w w w .s vn .c o m Property Location Sale Price Year Built Bldg S.F. Price/S.F. CAP Parking Spaces Close Photo Kaneville Center $3,000,000 17,744 $169.07 7.10 % 85 2401 W. Kaneville Rd. On Randall Rd. corridor at signalized intersection. Cap rate based on 75% occupancy. Geneva,IL 60134 Averages $3,223,000 2009 14,610 $229.34 8.13 % 72 The information listed above has been obtained from sources we believe to be reliable, however, we accept no responsibility for its correctness. All Sperry Van Ness® Offices Independently Owned and Operated.
- 11. w w w .s vn .c o m Averages For All Sales Comparables Sale Price Year Built Bldg S.F. Price/S.F. CAP Parking Spaces Close Averages $3,048,538 2009 13,926 $225.16 8.10 % 72 The information listed above has been obtained from sources we believe to be reliable, however, we accept no responsibility for its correctness. All Sperry Van Ness® Offices Independently Owned and Operated.
- 12. 3 . Additional Information All Sperry Van Ness® Offices Independently Owned and Operated.
- 13. Anchors- Claire's & Payless Nearby Shopping Center- Hobby Lobby The information listed above has been obtained from sources we believe to be reliable, however, we accept no responsibility for its correctness.
- 14. Anchors- Sprint & Deals Nearby Bank Building The information listed above has been obtained from sources we believe to be reliable, however, we accept no responsibility for its correctness.
- 15. Bergner's Nearby Firestone The information listed above has been obtained from sources we believe to be reliable, however, we accept no responsibility for its correctness.
- 16. Adjacent Strip Center The information listed above has been obtained from sources we believe to be reliable, however, we accept no responsibility for its correctness.
- 17. w w w .s vn .c o m Location Map The information listed above has been obtained from sources we believe to be reliable, however, we accept no responsibility for its correctness. All Sperry Van Ness® Offices Independently Owned and Operated.
- 18. Demographics Report 3574 Court Street Pekin, IL 61554 1.00 Mile 3.00 Mile 5.00 Mile Ring Ring Ring POPULATION 1990 Population 1,771 25,205 40,575 2000 Population 1,827 25,231 42,114 % Population Change 1990-2000 3.16 % 0.10 % 3.79 % 2008 Total Population 1,899 25,020 42,080 2013 Total Population 1,985 25,349 42,565 % Population Change 2000-2008 3.94 % -0.84 % -0.08 % % Population Change 2008-2013 4.53 % 1.31 % 1.15 % 2008 Total Households 872 10,560 16,823 2013 Total Households 907 10,679 16,988 % Households Change 2000-2008 10.80 % 1.61 % 1.99 % % Households Change 2008-2013 4.01 % 1.13 % 0.98 % 2008 White Population 1,836 24,256 39,940 2008 Black Population 2 51 959 2008 American Indian/Alaska Native 2 36 83 2008 Asian/Hawaiian/Pacific Islander 11 115 203 2008 Other Population (Incl 2+ Races) 47 563 897 2008 Hispanic Population 22 326 602 2008 Non-Hispanic Population 1,877 24,694 41,479 2008 Per Capita Income $32,346 $25,264 $24,061 2008 Median Household Income $49,095 $43,794 $43,365 2008 Average Household Income $70,442 $59,858 $60,184 2008 Household Income < $10,000 43 656 969 2008 Household Income $10,000-$14,999 64 807 1,213 2008 Household Income $15,000-$19,999 29 681 1,179 2008 Household Income $20,000-$24,999 41 625 1,096 2008 Household Income $25,000-$29,999 32 586 1,042 2008 Household Income $30,000-$34,999 87 788 1,217 2008 Household Income $35,000-$39,999 43 611 973 2008 Household Income $40,000-$44,999 58 693 1,071 2008 Household Income $45,000-$49,999 47 580 974 2008 Household Income $50,000-$59,999 82 1,126 1,944 2008 Household Income $60,000-$74,999 94 1,448 2,387 2008 Household Income $75,000-$99,999 191 1,407 1,924 2008 Household Income $100,000-$124,999 32 310 447 2008 Household Income $125,000-$149,999 12 135 231 The information listed above has been obtained from sources we believe to be reliable, however, we accept no responsibility for its correctness.
- 19. 2008 Household Income $150,000-$199,999 10 49 69 2008 Household Income $200,000-$249,999 1 11 14 2008 Household Income $250,000-$499,999 5 46 69 2008 Household Income $500,000+ 0 1 1 2008 Average Household Size 2.14 2.31 2.38 2008 Total Owner Occupied Housing Units 657 7,181 12,007 2008 Total Renter Occupied Housing Units 218 3,371 4,822 2008 Total Daytime Population 3,995 18,656 33,520 2008 Total Daytime Work Population 2,485 7,349 13,311 2008 Total Establishments 216 843 1,533 HOUSEHOLDS 1990 Households 714 10,060 15,962 2000 Households 787 10,393 16,494 % Households Change 1990-2000 10.22 % 3.31 % 3.33 % The information listed above has been obtained from sources we believe to be reliable, however, we accept no responsibility for its correctness.