2. is a passive geophysical method sensitive to groundwater
flow (Sill 1983; Rozycki et al. 2006; Bol`eve et al. 2009,
2011). Indeed, the source current density responsible for
the occurrence of SP signals is directly proportional to the
Darcy velocity. However, the subsurface distribution of
electric resistivity must also be known in order to interpret
SP signals (Jardani et al. 2007). To our knowledge,
SP and resistivity data are rarely used in concert to
localized concentrated seepage in earth dams. In this
study, we apply the SP and direct current (DC) resistivity
methods to a small leaking earthen dam in Colorado
at which focused seepage has been observed on the
downstream toe.
Description of the Geophysical Methods
Electrical Resistivity Tomography
DC resistivity method is an active geophysical
method that employs specific geometrical configurations
of electrode arrays to inject very low-frequency currents
into the subsurface and measure a voltage drop response
at a set of electrodes. The ratio of the measured voltage
drop by the imposed electrical current, corrected for
the geometry of the array, corresponds to an apparent
resistivity. A pseudosection corresponds to a collection of
apparent resistivity measurements (Griffiths and Barker
1993). The pseudosection can be inverted in either two
dimensions (2D) or three dimensions (3D) to produce
an electrical resistivity tomogram (e.g., Loke and Barker
1996) that displays an estimate of the true subsurface
resistivity distribution. This approach is called electrical
resistivity tomography (ERT) and has been broadly used
in hydrogeophysics.
The inverse of the resistivity, the electrical con-
ductivity, is related to two fundamental properties of
the porous soils and rocks, namely the connected
porosity φ and the cation exchange capacity CEC
(Revil 2013a, 2013b):
σ =
1
F
σw + σS (1)
σS ≈
1
Fφ
ρSβ(+) (1 − f ) CEC (2)
where σw (in S/m) corresponds to the pore water con-
ductivity, σS (in S/m) denotes the electrical conductivity
associated with the electromigration of the cations in
the diffuse layer coating the surface of the grains (see
Figure 1a and 1b), F (dimensionless) is the formation
factor related to the porosity by Archie’s law (F = φ− m
,
Archie 1942, m is called the cementation exponent or
first Archie exponent and is typically in the 1.5 to 2.5
range), ρS (in kg/m) denotes the mass density of the solid
phase (typically 2650 kg/m3
for silicates), β(+) (m2
/s/V)
corresponds to the mobility of the counterions in the
diffuse layer, the external part of the electrical dou-
ble layer (see Figure 1b) (β(+)(Na+
, 25◦
C) = 5.2×10⁻⁸
m2
/s/V), f (≈0.90) denotes the fraction of counterions
in the Stern layer (the inner part of the electrical dou-
ble layer), and CEC denotes the CEC (in C/kg) of the
material.
The ERT method has been extensively used on dams
to determine the subsurface architecture of earthen dams
and to perform monitoring of changes in porosity (Nasser
1994; Panthulu et al. 2001; Cho and Yoem 2007; Sjodahl
et al. 2006; Blome et al. 2011). An electrically conductive
pathway can be conductive because of the high porosity
of the material or because of the presence of clay with
a high CEC and therefore a low permeability (Revil and
Cathles 1999). Therefore, ERT is sensitive to the presence
of conductive pore fluids but is not a flow indicator,
and therefore, any interpretation should be carefully
analyzed and informed with additional geophysical and
hydraulic data. As discussed in the following section,
the SP method is naturally a complementary method
to ERT.
The SP Method
The SP method is a passive geophysical technique
directly sensitive to groundwater flow (e.g., Ikard et al.
2012; Revil et al. 2012). It has been extensively used
qualitatively to investigate preferential groundwater flow
pathways in dams and embankments (Ogilvy et al. 1969;
Corwin 1985; Butler et al. 1989; Butler et al. 1990;
Alsaigh et al. 1994; Panthulu et al. 2001; Minsley et al.
2011) and more recently quantitatively (Bol`eve et al.
2007a, 2009, 2011; Moore et al. 2011; Bol`eve et al.
2012). Recent algorithms have been indeed developed
to invert SP data in order to localize preferential
flowpaths using cross-correlation (Rozycki et al. 2006)
and stochastic methods (Ikard et al. 2012) and to estimate
the groundwater flow pattern and Darcy velocity using
deterministic inversion algorithms (Bol`eve et al. 2009,
2011).
A SP mapping survey is simple to perform and
requires only a voltmeter characterized by a high internal
impedance (>10 M ), a cable reel, and two nonpolariz-
ing electrodes to passively measure naturally occurring
voltages.
The occurrence of SP signals associated with ground-
water flow originates at the pore scale. The pore water
inside of a porous material is never electrically neutral.
There is usually an excess of charge in order to com-
pensate for the deficiency of electrical charges on the
mineral surface at the pore walls (Overbeek 1952, see
Figures 1a and 1b). The flow of the pore water is respon-
sible for the advective drag of this excess of electrical
charges (Figure 1c). This advective current density (flow
of charges per unit surface area of a cross section of the
porous material and per unit time) is called the stream-
ing current density in the literature (Overbeek 1952; Sill
1983; Levenston et al. 1999).
Revil and colleagues developed a new formulation of
the streaming current density that is valid for any pore
size (Jardani et al. 2007; Revil and Mahardika 2013). In
this formulation, the source current density is associated
2 S. J. Ikard et al. Groundwater NGWA.org
3. L
R
zr
OMineralsurface
X−
M+
M+
M+
M+
Sternlayer
OHP
Shear plane
M+
M+
A−
M+
M+
o-Plane d-Plane
M+
A−
A−
A−
M+
M+
M+
BulkporesolutionM+
M
+
X−
X−
X−
X−
X−
X−
X−
X−
X−
M+
M+
Sketch of a charged capillary
Sketch of the electrical double layer Source current density
Mineral
Mineral
Pore
Mineral
Flow
(a)
(b) (c)
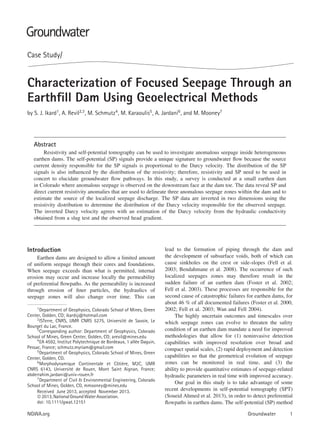
Figure 1. Description of the electrical double layer and the streaming current density. (a) Sketch of a single capillary of
radius R coated by the electrical double layer. (b) Sketch of the electrical double layer showing the Stern layer of sorbed
counterions and the diffusion layer; M+ denotes the metal cations while A− denotes the anions. The charge of the diffuse and
Stern layer counterbalances the charge on the mineral surface. A consequence of the electrical double layer is the existence
of an excess of electrical charge in the pore water, located in the vicinity of the mineral surface. The o-plane refers to the
mineral surface and the d-plane to the interface between the Stern layer and the diffuse layer. (c) The flow of water through
the pore network drags this excess of charge generating a streaming current density (modified from Revil et al. 2011).
with the drag of the effective excess of charge QV caused
by the flow of the pore water and is therefore given by
jS = QVu (3)
where u (in m/s) denotes the Darcy velocity and QV
(in C/m3
) denotes the excess of electrical charge that is
carried along with the flow of the pore water. For pH
comprised between 5 and 8, Jardani et al. (2007) found
that the QV is controlled by the permeability k (in m2
)
and they developed the following empirical relationship:
log10 QV = −9.2 − 0.82 log10 k. (4)
Equation 4 holds for a broad range of porous rocks
and soils (see also an updated data set in Revil and
Mahardika 2013).
In conductive materials, the source current density
jS is responsible for an electrical field and the tangen-
tial component of this electrical field is measured at
the ground surface (e.g., Revil et al. 2012). A classical
mistake is to mix the local potentials in the elec-
trical double layer coating the surface of the grains
with the macroscopic field that is measured in SP
studies. These physical quantities are unrelated to one
another.
With respect to the macroscopic electrical field, the
generalized Ohm’s law for the total current density j is
written as
j = σE + jS (5)
where σ denotes the electrical conductivity of the porous
material. Equation 5 is combined with a conservation
equation for the electrical charge that is written as (Sill
1983)
∇· j = 0 (6)
The combination of Equations. 5 and 6 yields the
following elliptic partial differential equation for the
NGWA.org S. J. Ikard et al. Groundwater 3
4. SP ϕ (in V) (Sill 1983):
∇· (σ∇ϕ) = ∇· jS (7)
The right-hand side of Equation 7 corresponds to
the SP source term associated with the Darcy velocity
distribution and the heterogeneity in the distribution of
the volumetric charge density.
In terms of laboratory measurements, the magnitude
of the SP signals can be estimated from the streaming
potential coupling coefficient. This coefficient is quanti-
fied as follows. We first express Darcy’s law in a saturated
porous media as u = − K∇h, where h (m) denotes the
hydraulic head and K (m/s) the hydraulic conductivity
(Darcy 1856). The streaming potential coupling coeffi-
cient C (in V/m) is defined as the variation of the SP
ϕ for a variation of the hydraulic head h when flow is
allowed through a core sample and the end-faces are not
short-circuited. C is given by
C ≡
∂ϕ
∂h j=0
= −QVKρ (8)
where ρ = 1/σ denotes the electrical resistivity of the
porous material (in m). We will see in the following
how this coefficient can be measured in the laboratory
(Bol`eve et al. 2007b; Malama and Revil 2013).
Forward modeling of the SP signals associated with
groundwater flow was pioneered by Sill (1983). Figure 2
shows the 2D forward modeling of the SP signals
associated with the existence of a preferential seepage
in an earthen dam (hydraulic conductivity K = 10−6
m/s)
with granular sand-silt materials (K = 10−5
m/s) and
with a clay core (K = 10−9
m/s). We see the presence
of a negative anomaly upstream and the presence of
a positive anomaly downstream at the dam toe. The
amplitude of these SP anomalies is controlled both by
the conductivity of the pore water (fresh water implies
higher SP anomalies) and by the head gradient. We
propose the use of SPT, a method recently proposed
initially by Jardani et al. (2007), to use SP signals to
determine the flowpath of an observed seepage in a small
dam in Colorado. The algorithm that will be used for
the inversion of the SP data is described in the next
section.
0.1 0.2 0.3 0.4 0.5 0.6 0.7 0.8 0.9 1
0 2 4 6 8 10 12 14 16 18 20 22 24 28 28
0
2
4
6
8
10
Re (0 mV)fElevation (m)
8 1410 12 16 18 20 22 24 26 28
−6
−4
−2
0
2
4
6
8
10
Self-potential(mV)
.
Ref
Distance (m)
Modeled self-potential
Lake
Water saturation
Clay core
1 mV
2 mV
4 mV
7 mV
7 mV
4 mV
-1 mV
-4 mV
Flow path
Distance (m)
Figure 2. Example of SP modeling on an earthen dam with a clay core. We have created a flowpath with an increased
permeability channeling water through the clay core. The groundwater flow is used to simulate the SP signals. The SP signals
are collected at the ground surface to create the SP profile (adapted from Bol`eve et al. 2009). Note that the position of
the positive SP anomaly coincides with the seepage area. Computation performed with the finite-element package Comsol
Multiphysics 3.5.
4 S. J. Ikard et al. Groundwater NGWA.org
5. Self-Potential Tomography
With the finite-element method, Equation 7 can be
written in matrix form as (Soueid Ahmed et al. 2013)
dp = Km (9)
where dp represents the predicted SP data at a set
of stations, m represents the vector of current density
(for each cell and in 2D, the current density has two
components), and K is called the kernel and corresponds
to the Green’s functions of the problem, which accounts
for the resistivity distribution. An extensive discussion
about the computation of the kernel for the source current
density is given by Jardani et al. (2008), and more
recently, a free software has been developed by Soueid
Ahmed et al. (2013). An important point is that the kernel
cannot be computed correctly without the knowledge of
the resistivity distribution. Therefore, ERT is an important
ingredient of SPT.
The inversion of the SP signal recorded at the
ground surface involves a reconstruction of the spatial
distribution of the amplitude and direction of the source
current density vector m given a set of observed data do
(N -vector of observed SP data). Deterministic inversion
with Tikhonov regularization is used, considering the
minimization of an objective function, which is the sum of
at least two terms. The first term is the data misfit function
for which the difference (according to a given norm,
usually the L2 norm) between the predicted and observed
data should be minimized. However, for potential field
problems, the solution of the inverse problem is highly
nonunique and many models can reproduce the data
equally well. Therefore, a regularizer is added to the cost
function. The idea is to use a groundwater flow model (set
up with a minimum of constraints, for example, flow in
a homogeneous material with the correct topography and
the correct boundary conditions) as prior model (denoted
as m0). The idea is to start the inversion from this model
and to perturb iteratively this prior model using the SP
data as additional constraints.
The objective function to minimize, Pλ
(m), is
defined as
Pλ
(m) = Wd (Km − do) 2
2 + λ2
W m (m − m0) 2
2
(10)
where do denotes the vector of observed SP data, the
subscript 2 corresponds to the L2 norm, λ the regular-
ization parameter that is incorporated with the constraint
0 < λ < ∞, and m = Jx
s , Jz
s corresponds to the model
vector with the two components of the source current
density (x and z components). The model vector has there-
fore 2M components (M is the number of cells used to
discretize the subsurface) and the kernel matrix K has
N × 2M components Kij = Kx
ij , Kz
ij .
In Equation 10, the matrix Wd = diag{1/ 1, . . . , 1/ N }
denotes a diagonal weighting square (N × N ) matrix.
Elements along the diagonal of Wd correspond to the
reciprocal of the standard deviation squared. The matrix
W m = σ2
mI denotes the weighting diagonal matrix that
represents the weight of the a priori model used in the
minimization controlled iteratively from the regularization
parameter.
The minimization of the objective function
∂Pλ
(m)/∂m = 0 is conducted with the Gauss-Newton
algorithm implemented in Matlab (see Richards et al.
2010 and Soueid Ahmed et al. 2013). The program was
initiated with a prior model and λ = 1, which reduces at
each iteration to half of the value at the previous iteration.
After the third iteration, the SP data are reproduced with a
small RMS error of 0.12%. The current density vector is
translated into Darcy velocity using the linear relationship
between current density and Darcy velocity u = jS/QV
for the value of QV that determined from laboratory tests
to quantify the coupling coefficient.
Description of the Test Site
Localization and Geometry
The field site is an earthfill dam (no clay core;
properties described in next section) that impounds a small
reservoir in the Rocky Mountains near Avon, Colorado.
The reservoir is flanked by the steep, brushy sub-alpine
side-slopes of the drainage gulch and collects surface
and groundwater from a 7.8 km2
drainage basin. It has
a normal storage capacity of 24,670 m3. The reservoir
surface area is approximately 8094 m2
at the maximum
storage elevation of 2411 masl (meters above sea level),
and the maximum reservoir depth is 5.8 m at full capacity.
The dam has a structural height of 11 m (referenced to
the downstream dam toe), a hydraulic height of 10 m,
and 1 m of freeboard elevation between the emergency
spillway S1 and embankment crest at the maximum
pool elevation (Figure 3b). The dam is 37 m wide at
the base and is 4.9 m wide at the crest. The crest
is at an elevation of 2412 masl and spans 122 m in
length between the side-slopes of the drainage gulch.
The upstream slope of the embankment is lined with rip-
rap on a 2:1 slope (horizontal:vertical) to an elevation
of 2409 masl and has 3:1 grade below. The downstream
slope has a 2:1 grade to the toe at 2402 masl, where
the downstream slope intersects the natural topography
of the gulch. Portions of the downstream slope near the
toe of the maximum cross section are significantly steeper
(as much as 1.6:1).
The dam has two spillways. The primary spillway
(see Spillway S1 in Figure 3b) is a 630-mm diameter
corrugated metallic pipe through the west abutment into
the reservoir. We have checked that the corrugated
metallic pipe is responsible for a small negative SP
anomaly that does not influence the overall SP map
discussed later. The emergency spillway (shown in
Figure 3b as Spillway S2) on the east abutment is an
open channel graded from 9 m wide at the concrete cutoff
wall marking the spillway crest into a 3.7-m wide channel,
approximately 26 m downstream.
NGWA.org S. J. Ikard et al. Groundwater 5
6. Crest Reservoir at low level
Spillway S1
Reservoir water gauge
Picture of the test site
0 25 50
Meters
Reservoir
Ref.
Inlet
N
P1
P3
P2
P4
P5
P1 1
P10 P8
P7
P6
P12
P9
P1
Position of the profiles
(a)
(b)
Pz1
Spillway S2
S2
S1
Figure 3. Description of the test site. (a) Position of the DC
resistivity and SP profiles for the reconnaissance survey. Five
DC resistivity profiles (P1 to P5) were acquired parallel to
the dam crest with a 2.5-m electrode spacing, and six profiles
(P6, P7, P8, and P10 to P12) were acquired perpendicular to
the dam crest with a 1-m electrode spacing. One profile (P9)
was collected oblique to the East abutment, perpendicular
to a suspected seepage path through the abutment, with
a 1-m electrode spacing. A total of 1049 SP stations were
acquired along DC survey lines with a 1.25-m spacing
parallel to the crest and a 1-m spacing perpendicular to the
crest (Ref. denotes the position of the reference for the SP
measurements). (b) Picture of the reservoir lake at low level
with the position of the two spillways S1 and S2 and the
crest of the earth dam. The overflow pipe is also visible in
the middle of the dam (see “Reservoir water gauge”).
Properties of the Dam Materials
Geotechnical properties and internal zoning of the
dam are unknown. The few available inspection records
and engineering reports (Blair 2003, 2004, 2010a, 2010b)
have assumed that the dam is composed of homogeneous
earthfill resembling soils encountered in test pits exca-
vated at the east abutment of the dam, due to the close
proximity of the test pits to original 1936 borrow area. The
State of Colorado assumes that the dam is homogeneous
earthfill composed of silty clay materials compacted to
95% maximum density during emplacement (Blair 2003,
2004, 2010a, 2010b), but this is unconfirmed. Quantita-
tive geotechnical data regarding the original construction
materials and those used in historical modifications are
not available.
Anomalous Seep
A seep has been observed at the downstream toe
of the maximum cross section of the dam (see “seep
area” in Figure 4). During this study, visible water exiting
the dam at the downstream toe (i.e., seep) was observed
over a distance of few meters parallel to the dam crest
approximately intersecting resistivity line P6 (see position
in Figure 3a). The discharging seepage water flows
continuously under the hydraulic load of the maximum
reservoir storage behind the dam. Visual observations
recorded by field engineers and state regulators on several
occasions over a period of 2 years have indicated that the
seepage exiting the downstream toe is between 0.6 L/s and
1.9 L/s when the reservoir is at full capacity.
Data Acquisition
SP and DC resistivity surveys were completed in
summer 2011 to identify the source of anomalous seepage
emanating from the dam toe. The reservoir water level was
held constant at the maximum storage level (2412 masl)
throughout the survey. The seepage zone water was
observed to be clear. The electrical conductivities of the
reservoir water and seepage water were measured to be
308 μS/cm and 440 μS/cm (at a temperature of 8.7o
C),
respectively, using a conductimeter.
Twelve DC resistivity profiles were collected parallel
and perpendicular to the dam covering the crest, spillways,
downstream slope, and a portion of the downstream topog-
raphy and side-slopes of the drainage gulch (Figure 3a).
Resistivity measurements were acquired with an ABEM
Terrameter SAS4000 using a Wenner array with 64 elec-
trode separated by 2.5 m for profiles parallel to the dam
crest and separated by 1 m for profiles perpendicular to
the crest. The measured contact resistivity between the
electrodes and the ground was less than 1 k . The resis-
tivity measurements were repeated to achieve a standard
deviation of the apparent resistivity that was less than 3%
of the mean value.
The resistivity profiles along the upstream edge (P1)
and downstream edge (P3) of the crest were separated
by 5 m, and DC resistivity profiles on the downstream
slope parallel to the crest (P2, P4, P5) were separated by
about 10 m (Figure 3a). The profiles perpendicular to the
crest (P6 to P12) had an average separation of 16 m. One
additional profile (P9) was performed perpendicular to a
suspected seepage path through the East abutment using
59 electrode takeouts and an electrode separation of 1 m.
A total of 1049 SP stations were monitored along the
DC resistivity profiles with a handheld Fluke 289 volt-
meter and two nonpolarizing Petiau Pb-PbCl2 electrodes
(Petiau 2000). A reference Petiau electrode was buried
in a shallow hole that was excavated above the reservoir
on the east side-slope of the gulch (see position “Ref”
in Figure 3a), and a roving Petiau electrode was used at
each of the 1049 stations. All SP data were measured
as the potential difference between the roving electrode
and the reference electrode. The station separation for
SP measurements was 1.25 m for profiles parallel to the
6 S. J. Ikard et al. Groundwater NGWA.org
7. −16
−20
−15
−10
−5
0
5
10
15
20
0 8 16 24 32 40 48 56
Iteration 4, RMS 5%
Crest
Bedrock
Profile P6 South
P3P1
P2
P4
P5
Depth(inmeters)Self-potential(inmV)
Position (in m)
Aquifer
September 2011
Water
0
−2
−4
−6
−8
−10
−12
−14
Resistivity (in ohm m)
40 50 70 100 200 300
Seep
A2
Path 2
Seep
River
North
Vadose zone
Figure 4. Example of 2D resistivity and SP profile normal to the dam structure (Profile P6, see position in Figure 1a). The
grey area corresponds to the area where seepage A2 can be observed at the ground surface. This seepage is associated with
a relative 20 mV positive SP anomaly with respect to the local minima on its flanks (surrounding values).
crest and 1 m for profiles perpendicular and oblique to
the crest. At each SP station, a shallow hole was exca-
vated to expose moist soil and reduce contact resistance
between the roving electrode and the ground. Stations on
the crest and some stations perpendicular to the west abut-
ment were watered with reservoir water to reduce contact
resistance. The maximum contact resistance for all SP
stations was 40 k and on average was less than 15 k ,
much smaller than the internal impedance of the volt-
meter (100 M ). The potential difference was measured
between the reference and roving Petiau electrodes before
and after acquiring each 1049 station survey to correct
for electrode drift. Telluric currents were assumed to be
negligible due to the small, confined nature of the field
site and were not monitored. Some SP profiles are shown
in Figures 4 to 6 together with the resistivity profiles. A
SP map is shown in Figure 7.
Electrical Resistivity Tomogram (ERT)
The inversion of the apparent resistivity data was
performed with RES2DINV (Loke and Barker 1996)
with the finite-element approach and a Gauss-Newton
algorithm. The 2D DC resistivity profiles and the
associated SP data are shown in Figures 4 to 6. Data
quality was excellent due to a very good contact between
the stainless steel electrodes and the ground (contact
resistance generally < 1 k as discussed earlier).
Five profiles (P1 to P5) were also inverted in 3D
with the software ERTLab (Morelli and Labrecque 1996,
Santarato et al. 2011) using the finite-element method
with tetrahedrons. The 3D inversion only incorporated
the profiles collected parallel to the dam crest, the
profiles normal to the dam were spaced too far apart
to bring pertinent information. The whole data set for
the 3D inversion was composed of 319 electrodes,
2357 quadripoles, and 323 topographic data points. The
inversion converged in three iterations leading to a low
RMS error of 5%. The topography was taken into account
in the inversion. The mesh grid size was equal to 1.25 m in
all directions. The result of the 3D tomography is shown
in Figure 8.
Interpretation of the Geophysical Data
The resistivity profiles show a shallow resistive layer
(resistivity in the range 200 to 300 m) just below the
ground surface, e.g., profile P6 in Figure 4. This layer
NGWA.org S. J. Ikard et al. Groundwater 7
8. −30
−20
−10
0
10
20
0 50 100 150
Profile P2
Self-potential(inmV)
Position (in m)
September 2011
Spillway B
Depth(inmeters)
10
5
0
−5
−10
−15
−20
−25
−30
Iteration 4, RMS 3.0%
Bedrock
Conductive body (Aquifer)
Resistivity (in ohm m)
40 50 70 100 200 300
West East
Figure 5. Example of 2D resistivity and SP profile parallel to the dam crest (Profile P2). The high density of measurement
can be used to determine the standard deviation to be 3 mV. This profile shows the lateral zone of saturation associated with
the aquifer. The SP signals are essentially uniform indicating a rather uniform seepage in the upper part of the dam.
is interpreted as the vadose zone above the capillary
fringe. This is consistent with the fact that the water table
is approximately 1 to 2 m below the ground surface at
piezometer Pz1 (see position in Figure 3a).
The resistivity profiles show areas of low-resistivity
anomalies (on the order of 40 to 50 m, see Figures 4
to 6 and Figure 8). The conductivity of the pore water is
σw = 0.052 S/m (19 m resistivity, 529 μS/cm) measured
in the field in piezometer Pz2 on July 9, 2012 (on
July 9, 2012, the background conductivity in piezometer
Pz1 was measured and was 549 μS/cm). The referenced
values were 440 μS/cm and 308 μS/cm August 9, 2011
during the reconnaissance survey. The porosity of the
dam material is estimated to be around 0.30 (30%).
This implies a formation factor F of about 11 (using
a cementation exponent of 2.0 as default value, see
Archie 1942). σ = 0.025 S/m (using 40 m from the
resistivity tomogram) implies a surface conductivity σS
of 0.020 S/m. This is a rather high value indicating that
the earth material could be clayey. We interpret the low-
resistivity zones as areas of relatively high permeability
and the value of the permeability will be discussed further.
However, as mentioned earlier, great care should be taken
in analyzing resistivity as it is influenced by the clay
content, the clay mineralogy, and porosity.
The low-resistivity area below the crest (see Figure 5)
is interpreted as a seepage zone of the groundwater that
has entered the dam cross section from the reservoir.
Beneath the crest, the phreatic surface is uniformly
distributed in Profile P2 (see Figure 5), suggesting a
uniform entry of reservoir water into the upstream slope of
the dam. The seepage separates into preferential flowpaths
in a downstream direction as shown in Profiles P2 and P5
parallel to the crest (Figure 6). Seepage starts to deviate
from uniform into preferential channels in Profile P4 (not
shown here) along the midsection of the downstream
slope. In Profile P5 (Figure 6), we can clearly observe
three localized channels in the dam shown by conductive
anomalies (see also Figure 8 where these seepages are
named Paths 1, 2, and 3). Flow through the central path
appears to be the primary contribution to the observed
seep at the downstream dam toe (see position of the seep
in Figures 4 and 7). Indeed, the high-conductivity seepage
“Path 2” correlates at its termination with the position of
the observed seep.
SP data are complementary to the 2D/3D electrical
resistivity tomograms in deciphering the position of the
flowpaths. The positive SP anomalies (∼15 to 30 mV
with respect to the reference electrode) are observed
downstream of the dam, in its central portion (see the
8 S. J. Ikard et al. Groundwater NGWA.org
9. −20
−15
−10
−5
0
5
10
15
20
0 50 100 150
Profile P5
Self-potential(inmV)
September 2011
Iteration 4, RMS 5.1%
Depth(inmeters)
10
5
0
−5
−10
−15
−20
−25
−30
Bedrock
Path 2
Spillway S2Spillway S1
Resistivity (in ohm m)
40 50 70 100 200 300
A1
Path 1
Path 3
Green vegetation
Seep
Position (in m)West East
Figure 6. Example of 2D resistivity and SP profile parallel to the dam crest (Profile P5). The high density of measurement
allows determining the value of the standard deviation (about 3 mV). This profile shows three well-developed flowpaths named
Path 1, Path 2, and Path 3. Path 2 is responsible for the observed seepage on the downstream toe of the dam. Its seepage is
associated with a positive SP anomaly with respect to the background value.
anomalies A1 and A2 in Figure 7). The maximum
positive SP anomaly was observed in Profile P6 (see
Figure 4). Note that both spillways were carrying
water during the survey. The positive SP anomalies
on the downstream slope of the dam are interpreted
as zones of water upwelling in the vicinity of the
ground surface (see for instance the simulation shown in
Figure 2). The localization of these zones is consistent
with the position of the preferential flowpaths interpreted
from the DC resistivity profiles. A clear seep is only
observed at the bottom of Profile P6 (see Figure 4).
However, other indicators of seepage (for instance green
and abundant vegetation) have been observed at some
locations on the downstream slope that are consistent
with positive SP anomalies (>10 mV with respect to
the background, see for instance Figure 6). The location
of anomaly A1 in Figure 7 has been consistently
observed over several months to have significantly greener
vegetation with respect to surroundings. This area was
noted to show increased soil moisture content with
respect to surroundings and a “sloshing” sound when
DC electrodes were installed in this location. Tall,
dense vegetation and noxious weeds have been observed
sprouting from the downstream slope at the location of
A2 (Figure 7) during the summers of 2009 and 2010.
A2 and A3 were also observed to have increased soil
moisture (although not as significant as A1) with respect
to surroundings.
Self-Potential Tomography
The goal of this section is to show how the SP
data along Profile P6 can be interpreted quantitatively to
estimate the Darcy velocity. For this purpose, we first
determine the streaming potential coupling coefficient of
a core sample from the dam and then we proceed to invert
the SP data in terms of source current density distribution,
which is then converted into a spatial distribution of Darcy
velocity.
Laboratory Investigation
A sample of material representative of the aquifer
shown in Figure 4 has been collected at a depth of 2 m
with an auger. The sample was estimated to be predom-
inantly silty clay through visual and textural analysis. It
was representative of the texture and composition to the
embankment fill materials described in the lithologic logs.
The embankment fill materials is a disturbed version of
NGWA.org S. J. Ikard et al. Groundwater 9
10. Area 1
Area 2
Elevation(m)
2415
2410
2405
4388300
4388280
4388260
4388240
4388220
Seep
A1
A2A3
Self-potential map (with topography)(a)
(b)
Self-potential(inmV)
25
15
5
−5
−15
−25
Easting (m)372000
372020
372040
372060
372080
Northing (m)
Thresholded resistivity tomography
Seep
Seepage 1
Seepage 2
Seepage 3
Area 1
Area 2
Figure 7. SP and resistivity data. (a) SP map (total of 1049 SP stations). Negative SP anomalies on the abutments and
downstream slope in the approximate range of −15 to −30 mV are a result of flow through preferential paths imaged in
DC resistivity tomography. The positive SP anomalies in areas A1 to A3 may correspond to the upflow of water as shown
in Figure 2. Anomaly A2 indicates the potential for upflow paths near the observed seepage zone. The areas A1 and A3 are
characterized by very green vegetation. “Seep” corresponds to the position of the observed seep downstream the dam. (b)
Threshold resistivity distribution showing the anomalies less than 50 m in magnitude.
the soils excavated from on-site borrow areas, which have
been reported to be silty clays, although no quantitative
geotechnical data are available to confirm this assump-
tion. The silty clay assumption, as well as the textural
characteristics observed and recorded during the sample
excavation, do justify the use of this high value. The
hydraulically conductive nature of the sediments indicated
by the slug test is in agreement with lithologic logs of
piezometer installation. Boring logs for piezometers Pz1
and Pz2 were supplied by Hepworth-Pawlak Geotech-
nical. Borings were drilled on July 28, 2004 using a
track-mounted drill rig during a low pool storage condition
in the reservoir. Unfortunately, geotechnical analysis of
boring samples was not performed in a laboratory. Boring
logs of Pz1 indicate that embankment fill was encountered
between depths of 0 m and 11 m consisting of sandy grav-
elly clay, scattered cobbles. The fill was medium stiff to
very stiff, moist, and dark brown in color. Gravel was
encountered below the embankment fill between depths
of 11 and 15 m. The gravel was noted to be dense, sandy,
and silty with cobbles and small boulders and was red
in color. It was also noted to be moist with saturation
increasing with depth. The water table was encountered
at a depth of 15 m in Pz1 during installation. Pz1 is slot-
ted between depths of 11.5 and 15 m. The lithologic log
in Pz2 indicates that embankment fill was encountered
between depths of 0 m and 4.6 m and has the same char-
acteristics as those encountered in Pz1. The gravel layer
encountered in Pz1 was also encountered in Pz2 between
depths of 4.6 and 8.6 m. The water table was encoun-
tered at a depth of 5.3 m during installation. Pz2 is slotted
between 5 and 8.6 m. The logs show a more hydraulically
conductive layer underneath the embankment fill.
Our goal was to use this sample to get an estimate of
the streaming potential coupling coefficient to connect the
source current density to the Darcy velocity. The experi-
mental setup used is shown in Figure 9a and the streaming
potentials vs. hydraulic heads are shown in Figure 9b.
Water from the reservoir was used for this experiment.
The value of the streaming potential coupling coefficient
is determined from the slope of the streaming potential vs.
hydraulic head data, which is equal to −2.6 ± 0.2 mV/m.
We also measured the resistivity (40 m) and the perme-
ability (k = 3.8 × 10⁻¹²
m2
, corresponding to a hydraulic
10 S. J. Ikard et al. Groundwater NGWA.org
11. (a)
(b)
(c)
Figure 8. 3D electrical resistivity tomogram from Profiles
P1 to P5 (2357 apparent resistivity data). (a) 3D inversion
of the DC resistivity. (b, c) 2D plan view slices at different
depths below the topography. Three potential seepage paths
are shown within the dam, diverging from uniform flow
in a downstream direction. One path is imaged through
each abutment, and one path is imaged beneath the
maximum cross section in the center of the dam. The central
preferential flowpath (Path #2) through the maximum cross
section of the dam appears to be the primary contribution
of flow into the seepage zone (spring) observed in Profile P6
(Figure 4) as well as in the field.
conductivity K = 3.7 × 10⁻⁵
m/s) of the soil sample.
Substituting the value of the permeability into Equation 4,
we obtain QV = 1.5 C/m3
. Using Equation 8, the effec-
tive charge per unit volume is given by QV = −C/ (Kρ).
Using this formula with the measured parameters given
previously yields QV = 1.5 C/m3
. The two estimates
are therefore very close to each other. The value of
QV = 1.5 C/m3will be used to convert the source current
density distribution into Darcy velocity. Using, however,
a single value for QV while the dam is heterogeneous can
only yield a rough estimate of the Darcy velocity. This
will be discussed in the following section.
Inverting the SP Field
The SP data from Profile P6 were inverted to
understand the seep observed in the field at location A2 in
Profile P6 (see Figure 4). We consider N = 55 SP stations
along Profile P6 and we use M = 103 cells to discretize
the subsurface as shown in Figure 10.
The prior model m0 used for the inversion of the SP
data is determined from a simulation of the groundwater
flow assuming the position of the bedrock/aquifer inter-
face (from the resistivity data) and a uniform permeability
R2 = 0.98
Streaming potential coupling coefficient
C = −2.6 ± 0.2 mV m
−1
0 0.2 0.4 0.6 0.8 1.0
Hydraulic head (m)
Differenceofelectricalpotential(mV)
5
4
3
2
Water
Ref
V
Porous samplePermeable
membrane
h
(a) (b)
Figure 9. Measurement of the streaming potential coupling
coefficient for a core sample from the dam. (a) Sketch of
the experimental setup where h denotes the hydraulic head.
(b) The measurements have been made with water from
the reservoir. The value of the streaming potential coupling
coefficient is −2.6 ± 0.2 mV/m.
for the aquifer. We specify the boundary conditions for the
head at the top and bottom of the profile and the ground-
water flow is modeled in steady state. For the matrix Wd,
we use a standard deviation of =3 mV from the data
displayed in Figures 4 to 6. For the matrix W m, we use
σ2
m=100 to let enough freedom to the inverted model to
depart from the prior model m0.
A linear hydrostatic pressure head profile was com-
puted and applied to the upstream slope to vary the
hydraulic head applied to the model boundary based on
relative elevation of the boundary with respect to the high
pool water level. A seepage face was defined at the down-
stream toe where seepage has been observed, as H = 0 m
under saturated conditions and a specified flux equal to
0 m3
/s otherwise. All other model boundaries were given
a specified flux equal to 0 m3
/s.
For the electrical model, a current flow boundary was
applied to the reservoir bed, upstream slope of the dam,
and the downstream seepage face. The current densities at
these boundaries were computed from the electrokinetic
equations that couple the electric field to the Darcy
velocity computed in the hydraulic model.
Modeling results are shown in Figure 10. The
current density vector is translated into Darcy velocity
using the linear relationship between current density and
Darcy velocity (see Equation 3) u = jS/QV using QV
= 1.5 C/m3. The results of the SPT are consistent with
the position of the bedrock (for which the Darcy velocity
should be very small). The two positive SP anomalies
are explained by the convergence of the flow due to the
fact that the bedrock is shallower in the vicinity of these
anomalies. The seepage corresponding to the spring is
shown very well by the inverted Darcy flow, showing a
high Darcy velocity oriented partly upward at the position
of the SP anomaly.
A slug test performed in piezometer Pz1 indicates
that the permeability of the formation is on the order
of 10−12
m2
(K = 10−5
m/s), which is a pretty large
NGWA.org S. J. Ikard et al. Groundwater 11
12. Horizontal distance (m)
0 10 20 30 40 50
Ground surface
Seepage
Crest
Bedrock
Depth(m)
0
Δ
2
4
6
8
10
12
14
Darcy velocity from the self-potential data (P6)
Aquifer
Log10 (Darcy velocity, m/s)
−5.5 −5.0 −4.5 −4.0 −3.5
Fit of the self-potential data
−20
−10
0
10
20(a)
(b)
Self-potential(inmV)
Horizontal distance (m)
Data
Best fit
0 10 20 30 40 50
Pz1
Pz2
Figure 10. Result of the inversion of the SP data along Profile 6 and flow Path #2. (a) Best fit of the experimental data at the
third iteration of the Gauss-Newton algorithm. The standard deviation on the data is considered to be 3 mV from the scatter
in the SP data. (b) Result of the Darcy velocity distribution assuming an excess of charge density of 1.5 C/m and the inverted
source current density obtained at the third iteration. The dashed line represents approximately the interface between the
bedrock and the aquifer determined from the resistivity data. The white area between the water table and the ground surface
corresponds to the vadose zone.
value. From the shape of the vadose zone shown in
Figure 4, the head gradient is estimated to be on the
order of 0.33. Therefore, the Darcy velocity is about
3 × 10⁻⁶
m/s in the vicinity of the piezometer Pz1. The
SP tomogram converted into Darcy velocity distribution
(Figure 10) indicates a higher Darcy velocity on the order
of 3 × 10⁻⁵
m/s in this region so it is possible that the
SP tomogram slightly overestimates the Darcy velocity
possibly because of the value of QV chosen previously.
Conclusions
A small earthen dam exhibiting concentrated internal
seepage and a visible seep at the toe was imaged using
DC resistivity and SP during an instance of maximum
reservoir capacity and therefore peak hydraulic loading. A
series of 2D resistivity profiles were inverted individually
and combined for 3D inversion. SP data were collected
along the resistivity profiles for comparison. The SP data
were inverted to estimate Darcy velocities. The following
conclusions have been reached:
1. Resistivity identifies three potential flowpaths; how-
ever, resistivity is not a direct indicator of permeability
and fluid flow.
2. SP can be directly tied to permeability and the
source current density responsible for the SP signals
is proportional to the Darcy velocity. However, the
12 S. J. Ikard et al. Groundwater NGWA.org
13. distribution of the SP signals is also controlled by the
resistivity distribution.
3. We have proposed a SPT algorithm to image ground-
water flow using the SP signals, collected at the ground
surface of the earth dam and using the resistivity
distribution to reconstruct approximately the distribu-
tion of the Darcy velocity. We identified a flowpath
that agrees with an anomalous seepage observed
on the downstream of the dam toe and we determined
the distribution of the Darcy velocity.
Acknowledgments
This work was supported by the NSF-funded Smart-
Geo Educational Program (Project IGERT: Intelligent
Geosystems; DGE-0801692) and the NSF-funded PIRE
project. We thank Golder Associates, Inc., and Traer Creek
LLC. for logistical support and site access and the three
referees for very constructive comments and the time
spent on our manuscript.
References
AlSaigh, N.H., Z.S. Mohammed, and M.S. Dahham. 1994.
Detection of water leakage from dams by self-potential
method. Engineering Geology 37, no. 2: 115–121.
Archie, G.E. 1942. The electrical resistivity log as an aid in
determining some reservoir characteristics. Transactions
of the American Institute of Mining and Metallurgical
Engineers, 146, 54–62.
Bendahmane, F., D. Marot, and A. Alexis. 2008. Experimental
study of suffusion and backward erosion. Journal of
Geotechnical and Geoenvironmental Engineering 134, no.
1: 57–67.
Blair, J.G. 2010a. Engineer’s inspection report to the State of
Colorado. Unpublished report, 4 p.
Blair, J.G. 2010b. Hazard evaluation, Notthingham reservoir,
DAMID 370119. Unpublished report, 22 p.
Blair, J.G. 2004. Design review. Memorandum, Notthingham
dam modifications 2nd
submittal, DAMID 370119. Unpub-
lished report, 13 p.
Blair, J.G. 2003. Design review. Memorandum, Notthingham
dam modifications, DAMID 370119. Unpublished report,
12 p.
Blome, M., M. Hansruedi, and S. Greenhalgh. 2011. Geoelectric
experimental design—Efficient acquisition and exploitation
of complete pole-bipole data sets. Geophysics 76, no. 1:
15–26.
Bol`eve, A., J. Vandemeulebrouck, and J. Grangeon. 2012. Dyke
leakage localization and hydraulic permeability estimation
through self-potential and hydro-acoustic measurements:
Self-potential “abacus” diagram for hydraulic permeability
estimation and uncertainty computation. Journal of Applied
Geophysics 86: 17–28.
Bol`eve, A., F. Janod, A. Revil, A. Lafon, and J. Fry. 2011.
Localization and quantification of leakages in dams using
time-lapse self-potential measurements associated with salt
tracer injection. Journal of Hydrology 403: 242–252.
Bol`eve, A., A. Revil, F. Janod, J.L. Mattiuzzo, and J.-J. Fry.
2009. Preferential fluid flow pathways in embankment
dams imaged by self-potential tomography. Near Surface
Geophysics 7, no. 5: 447–462.
Bol`eve, A., A. Revil, F. Janod, J.L. Mattiuzzo, and A.
Jardani. 2007a. Forward modelling and validation of a new
formulation to compute self-potential signals associated
with ground water flow. Hydrology and Earth System
Sciences 11: 1–11.
Bol`eve, A., A. Crespy, A. Revil, F. Janod, and J.L. Mattiuzzo.
2007b. Streaming potentials of granular media: Influence of
the Dukhin and Reynolds numbers. Journal of Geophysical
Research 112: B08204. DOI:10.1029/2006JB004673
Butler, D., J.L. Llopis, T.L. Dobecki, M.J. Wilt, R.F. Corwin,
and G. Olhoeft. 1990. Part 2—Comprehensive geophysical
investigation of an existing dam foundation: engineering
geophysics research and development. The Leading Edge
9, no. 9: 44–53.
Butler, D., J.L. Llopis, and C.M. Deaver. 1989. Part
1—Comprehensive geophysical investigation of an
existing dam foundation. The Leading Edge 8, no. 8:
10–18.
Cho, I.K., and J.Y. Yoem. 2007. Crossline resistivity tomography
for the delineation of anomalous seepage pathways in an
embankment dam. Geophysics 72, no. 2: 31–38.
Corwin, R.F. 1985. The self-potential method and its engineering
applications—An overview. Geophysics 50: 282–282.
Darcy, H. 1856. Les fontaines publiques de la Ville de Dijon.
Paris: Dalmont.
Fell, R., C.F. Wan, J. Cyganiewicz, and M. Foster. 2003. Time
for development of internal erosion and piping in embank-
ment dams. Journal of Geotechnical and Geoenvironmental
Engineering 129, no. 4: 307–314.
Foster, M.A., R. Fell, R. Davidson, and C.F. Wan. 2002.
Estimation of the probability of failure of embankment
dams by internal erosion and piping using event tree
methods. ANCOLD Bulletin 121: 75–82.
Foster, M., R. Fell, and M. Spannagle. 2000. The statistics
of embankment dam failures and accidents. Canadian
Geotechnical Journal 37, no. 5: 1000–1024.
Griffiths, D.H., and R.D. Barker. 1993. Two-dimensional
resistivity imaging and modelling in areas of complex
geology. Journal of Applied Geophysics 29: 211–226.
Ikard, S. J., A. Revil, A. Jardani, W. F. Woodruff, M. Parekh,
and M. Mooney. 2012. Saline pulse test monitoring with
the self-potential method to non-intrusively determine the
velocity of the pore water in leaking areas of earth dams
and embankments. Water Resources Research 48: W04201.
Jardani A., A. Revil, A. Bol`eve, and J.P. Dupont. 2008. 3D inver-
sion of self-potential data used to constrain the pattern of
ground water flow in geothermal fields. Journal of Geophys-
ical Research 113: B09204. DOI:10.1029/2007JB005302
Jardani, A., A. Revil, A. Bol`eve, A. Crespy, J. P. Dupont, W.
Barrash and B. Malama. 2007. Tomography of the Darcy
velocity from self-potential measurements. Geophysical
Research Letters 34: L24403.
Jardani, A., A. Revil, F. Akoa, M. Schmutz, N. Florsch, and J.
P. Dupont. 2006. Least squares inversion of self-potential
(SP) data and application to the shallow flow of ground-
water in sinkholes. Geophysical Research Letters 33, 19:
B09204.
Kemna, A., J. Vanderborght, B. Kulessa, and H. Vereecken.
2002. Imaging and characterization of subsurface solute
transport using electrical resistivity tomography (ERT) and
equivalent transport models. Journal of Hydrology 267, no.
3-4: 125–146.
Levenston, M.E., E.H. Frank, and A.J. Grodzinsky. 1999.
Electrokinetic and poroelastic coupling during finite
deformations of charged porous media. Journal of Applied
Mechanics 66: 323–333.
Loke, M.H., and R.D. Barker. 1996. Rapid least-squares
inversion of apparent resistivity pseudosections using a
quasi-Newton method. Geophysical Prospecting 44, no. 1:
131–152.
Malama, B., and A. Revil. 2013. Modeling transient streaming
potentials in falling-head permeameter tests. Ground Water.
DOI:10.1111/gwat.12081
NGWA.org S. J. Ikard et al. Groundwater 13
14. Minsley, B.J., B.L. Burton, S. Ikard, and M.H. Powers. 2011.
Hydrogeophysical investigations at Hidden Dam, Raymond,
California. Journal of Environmental and Engineering
Geophysics 16, no. 4: 145–164.
Moore, J.R., A. Bol`eve, J.W. Sanders, and S.D. Glaser.
2011. Self-potential investigation of moraine dam seepage.
Journal of Applied Geophysics 74: 277–286.
Morelli, G., and D.J. LaBrecque. 1996. Advances in ERT
inverse modelling. European Journal of Environmental and
Engineering Geophysical Society 1, no. 2: 171–186.
Nasser, A. 1994. Investigation of channel seepage areas at
the existing Kaffrein Dam site (Jordan) using electrical
resistivity measurements. Journal of Applied Geophysics
32: 163–175.
Ogilvy, A.A., M.E. Ayed, and V.A. Bogoslovsky. 1969.
Geophysical studies of water leakage from reservoirs.
Geophysical Prospecting 17, no. 1: 36–62.
Overbeek, J.Th.G. 1952. Electrochemistry of the double layer.
In Colloid Science, 1, Irreversible Systems, ed. H.R. Kruyt,
115–193. New York: Elsevier.
Panthulu, T.V., C. Krishnaiah, and J.M. Shirke. 2001. Detection
of seepage paths in earth dams using self-potential and
electrical resistivity methods. Engineering Geology 59, no.
3–4: 281–295.
Petiau, G. 2000. Second generation of lead-lead chloride
electrodes for geophysical applications. Pure and Applied
Geophysics 157: 357–382.
Revil, A., 2013a. Effective conductivity and permittiv-
ity of unsaturated porous materials in the frequency
range 1 mHz–1GHz. Water Resources Research, 49
DOI:10.1029/2012WR012700
Revil, A. 2013b. On charge accumulations in heterogeneous
porous materials under the influence of an electrical field.
Geophysics 78, no. 4: D271–D291.
Revil, A., and H. Mahardika. 2013. Coupled hydromechanical
and electromagnetic disturbances in unsaturated clayey
materials. Water Resources Research 49, no. 2: 744–766.
DOI:10.1002/wrcr.20092
Revil, A., M. Karaoulis, T. Johnson, and A. Kemna. 2012.
Review: some low-frequency electrical methods for
subsurface characterization and monitoring in hydro-
geology. Hydrogeology Journal 20, no. 4: 617–658.
DOI:10.1007/s10040-011-0819-x
Revil, A., W.F. Woodruff, and N. Lu. 2011. Constitutive
equations for coupled flows in clay materials. Water
Resources Research 47: W05548. DOI:10.1029/2010WR0
10002
Revil, A., N. Linde, A. Cerepi, D. Jougnot, S. Matthai, and
S. Finsterle. 2007. Electrokinetic coupling in unsaturated
porous media. Journal of Colloidal and Interface Sciences
313: 315–327.
Revil, A., D. Hermitte, M. Voltz, R. Moussa, J. Lacas,
G. Bourri´e, and F. Trolard. 2002. Self-potential signals
associated with variations of the hydraulic head during an
infiltration experiment. Geophysical Research Letters 29,
no. 7: 1–10.
Revil, A., and L.M. Cathles. 1999. Permeability of shaly sands.
Water Resources Research 35, no. 3: 651–662.
Revil, A., H. Schwaeger, L.M. Cathles, and P. Manhardt.
1999. Streaming potential in porous media. 2. Theory and
application to geothermal systems. Journal of Geophysical
Research 104, no. B9: 20,033–20,048.
Richards, L.A. 1931. Capillary conduction of liquids through
porous media. Physics 1: 318–333.
Richards, K., A. Revil, A. Jardani, F. Henderson, M. Batzle,
and A. Haas. 2010. Pattern of shallow ground water flow at
Mount Princeton Hot Springs, Colorado, using geoelectrical
methods. Journal of Volcanology and Geothermal Research
198: 217–232.
Rozycki, A., J.M.R. Fonticiella, and A. Cuadra. 2006. Detection
and evaluation of horizontal fractures in earth dams
using self-potential method. Engineering Geology 82:
145–153.
Santarato, G., G. Ranieri, M. Occhi, G. Morelli, F. Fischanger,
and D. Gualerzi. 2011. Three dimensional electrical resis-
tivity tomography to control the injection of expanding
resins for the treatment and stabilization of foundation soils.
Engineering Geology 119, no.1-2: 18–30.
Sill, W.R. 1983. Self-potential modeling from primary flows.
Geophysics 48: 76–86.
Sjodahl, P., T. Dahlin, and B. Zhou. 2006. 2.5D resistivity
modeling of embankment dams to assess influence from
geometry and material properties. Geophysics 71, no. 3,
G107–G114.
Soueid Ahmed, A., A. Jardani, A. Revil, and J.P. Dupont. 2013.
SP2DINV: A 2D forward and inverse code for streaming-
potential problems. Computers & Geosciences 59: 9–16.
Wan, C.F., and R. Fell. 2004. Investigation of rate of erosion
of soils in embankment dams. Journal of Geotechnical and
Geoenvironmental Engineering 130, no. 4: 373–380.
14 S. J. Ikard et al. Groundwater NGWA.org