Monthly Market Report ~ November 2015
•
0 gefällt mir•131 views

Residential real estate is experiencing its best year since the recession. Housing demand is healthy, and that is expected to continue until the end of the year. Home sales are actually set to have their best national showing since 2006.

Empfohlen
Empfohlen
Weitere ähnliche Inhalte
Andere mochten auch
Mehr von Scott Browder
Mehr von Scott Browder (20)
Kürzlich hochgeladen
Kürzlich hochgeladen (20)
Monthly Market Report ~ November 2015
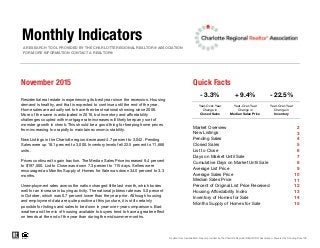
- 1. Monthly Indicators A RESEARCH TOOL PROVIDED BY THE CHARLOTTE REGIONAL REALTOR® ASSOCIATION FOR MORE INFORMATION CONTACT A REALTOR® November 2015 Quick Facts Market Overview 2 New Listings 3 Pending Sales 4 Closed Sales 5 List to Close 6 Days on Market Until Sale 7 Cumulative Days on Market Until Sale 8 Average List Price 9 Average Sales Price 10 Median Sales Price 11 Percent of Original List Price Received 12 Housing Affordability Index 13 Inventory of Homes for Sale 14 Months Supply of Homes for Sale 15 All data from CarolinaMLS. Report provided by the Charlotte Regional REALTOR® Association. Powered by ShowingTime 10K. - 3.3% + 9.4% - 22.5% Year-Over-Year Change in Closed Sales Year-Over-Year Change in Median Sales Price Year-Over-Year Change in Inventory Residential real estate is experiencing its best year since the recession. Housing demand is healthy, and that is expected to continue until the end of the year. Home sales are actually set to have their best national showing since 2006. More of the same is anticipated in 2016, but inventory and affordability challenges coupled with mortgage rate increases will likely keep any sort of monster growth in check. This should be a good thing for keeping home prices from increasing too rapidly to maintain economic stability. New Listings in the Charlotte region decreased 4.7 percent to 3,042. Pending Sales were up 18.1 percent to 3,000. Inventory levels fell 22.5 percent to 11,666 units. Prices continued to gain traction. The Median Sales Price increased 9.4 percent to $197,000. List to Close was down 7.3 percent to 115 days. Sellers were encouraged as Months Supply of Homes for Sale was down 34.0 percent to 3.3 months. Unemployment rates across the nation changed little last month, which bodes well for an increase in buying activity. The national jobless rate was 5.0 percent in October, which was 0.7 percent lower than the year prior. Although housing and employment data are quite positive at this juncture, it is still certainly possible for listings and sales to be down in year-over-year comparisons. Bad weather and the mix of housing available to buyers tend to have a greater effect on trends at the end of the year than during the midsummer months.
- 2. Market Overview Key market metrics for the current month and year-to-date. Key Metrics Historical Sparklines 11-2014 11-2015 + / – YTD 2014 YTD 2015 + / – Note: CarolinaMLS did not include “showable” under contract listings in the “Pending Sales” stats before July 2012. Listing agents report listings as “Under Contract-Show” earlier in the transaction. As a result, the new “Pending Sales” stats trend higher and the new “Months Supply of Inventory” stats trend lower since July 2012. | Data is refreshed regularly to capture changes in market activity. Figures shown may be different than previously reported. Current as of December 5, 2015. $231,703 $242,436 + 4.6% Average List Price $250,455 $268,973 + 7.4% $268,188 $279,762 + 4.3% Median Sales Price Average Sales Price $227,426 $240,663 + 5.8% Inventory of Homes for Sale - 7.3% 124 116 - 6.5% + 1.0%+ 1.1% 94.1% 95.0% Percent of Original List Price Received 168 15,050 158 - 5.9% -- 94.0% All data from CarolinaMLS. Report provided by the Charlotte Regional REALTOR® Association. Powered by ShowingTime 10K. | 2 5.0 154 - 8.3% - 22.5% - 34.0% 11,666 3.3 167 -- -- -- Housing Affordability Index -- -- Months Supply of Homes for Sale New Listings Pending Sales Closed Sales + 1.7% 2,540 3,000 + 18.1% 34,175 39,648 + 16.0% 50,9913,192 3,042 - 4.7% 50,126 + 12.4%37,254 List to Close 124 115 2,523 2,439 - 3.3% 33,139 $193,000 + 6.6% 95.0% $180,000 $197,000 + 9.4% $181,000 11-2012 11-2013 11-2014 11-2015 11-2012 11-2013 11-2014 11-2015 11-2012 11-2013 11-2014 11-2015 11-2012 11-2013 11-2014 11-2015 11-2012 11-2013 11-2014 11-2015 11-2012 11-2013 11-2014 11-2015 11-2012 11-2013 11-2014 11-2015 11-2012 11-2013 11-2014 11-2015 11-2012 11-2013 11-2014 11-2015 11-2012 11-2013 11-2014 11-2015 11-2012 11-2013 11-2014 11-2015
- 3. New Listings A count of the properties that have been newly listed on the market in a given month. Month Prior Year Current Year + / – December 2,566 2,715 +5.8% January 4,105 3,967 -3.4% February 4,015 4,004 -0.3% March 5,321 5,590 +5.1% April 5,410 5,575 +3.0% May 5,337 5,383 +0.9% June 5,043 5,168 +2.5% July 4,909 5,238 +6.7% August 4,481 4,666 +4.1% September 4,186 4,350 +3.9% October 4,127 4,008 -2.9% November 3,192 3,042 -4.7% 12-Month Avg 4,391 4,476 +1.9% Data is refreshed regularly to capture changes in market activity. Figures shown may be different than previously reported. Current as of December 5, 2015. All data from CarolinaMLS. Report provided by the Charlotte Regional REALTOR® Association. Powered by ShowingTime 10K. | 3 3,397 3,192 3,042 2013 2014 2015 November 2,000 3,000 4,000 5,000 6,000 7,000 8,000 1-2004 1-2005 1-2006 1-2007 1-2008 1-2009 1-2010 1-2011 1-2012 1-2013 1-2014 1-2015 Historical New Listing Activity 49,781 50,126 50,991 2013 2014 2015 Year To Date +1.7%-6.0% -4.7% +0.7%
- 4. Pending Sales Month Prior Year Current Year + / – December 1,888 2,227 +18.0% January 2,473 2,973 +20.2% February 2,560 3,121 +21.9% March 3,445 4,052 +17.6% April 3,349 4,263 +27.3% May 3,634 4,124 +13.5% June 3,501 4,001 +14.3% July 3,531 3,781 +7.1% August 3,222 3,700 +14.8% September 2,980 3,348 +12.3% October 2,940 3,285 +11.7% November 2,540 3,000 +18.1% 12-Month Avg 3,005 3,490 +16.1% All data from CarolinaMLS. Report provided by the Charlotte Regional REALTOR® Association. Powered by ShowingTime 10K. | 4 A count of the properties on which contracts have been accepted in a given month. Pending contracts include “Under Contract-Show” and “Under Contract-No Show” statuses. Note: CarolinaMLS did not include “showable” under contract listings in the “Pending Sales” stats before July 2012. Listing agents report listings as “Under Contract-Show” earlier in the transaction. As a result, the new “Pending Sales” stats trend higher and the new “Months Supply of Inventory” stats trend lower since July 2012. | Data is refreshed regularly to capture changes in market activity. Figures shown may be different than previously reported. Current as of December 5, 2015. 2,449 2,540 3,000 2013 2014 2015 November 1,000 1,500 2,000 2,500 3,000 3,500 4,000 4,500 5,000 1-2004 1-2005 1-2006 1-2007 1-2008 1-2009 1-2010 1-2011 1-2012 1-2013 1-2014 1-2015 Historical Pending Sales Activity 32,396 34,175 39,648 2013 2014 2015 Year To Date +16.0%+3.7% +18.1% +5.5%
- 5. Closed Sales A count of the actual sales that have closed in a given month. Month Prior Year Current Year + / – December 2,705 3,088 +14.2% January 2,119 2,278 +7.5% February 2,014 2,310 +14.7% March 2,674 3,301 +23.4% April 3,042 3,500 +15.1% May 3,313 3,834 +15.7% June 3,720 4,565 +22.7% July 3,692 4,273 +15.7% August 3,607 3,798 +5.3% September 3,237 3,703 +14.4% October 3,198 3,253 +1.7% November 2,523 2,439 -3.3% 12-Month Avg 2,987 3,362 +12.3% November Data is refreshed regularly to capture changes in market activity. Figures shown may be different than previously reported. Current as of December 5, 2015. All data from CarolinaMLS. Report provided by the Charlotte Regional REALTOR® Association. Powered by ShowingTime 10K. | 5 2,482 2,523 2,439 2013 2014 2015 November 1,000 1,500 2,000 2,500 3,000 3,500 4,000 4,500 5,000 5,500 1-2004 1-2005 1-2006 1-2007 1-2008 1-2009 1-2010 1-2011 1-2012 1-2013 1-2014 1-2015 Historical Closed Sales Activity 31,663 33,139 37,254 2013 2014 2015 Year To Date +12.4%+1.7% -3.3% +4.7%
- 6. List to Close “List to Close” provides the total number of days specific to the MLS number from “Listing Date” to “Sold Date.” Month Prior Year Current Year + / – December 129 128 -0.9% January 136 130 -4.4% February 136 131 -3.3% March 129 129 -0.3% April 132 118 -10.7% May 120 116 -3.0% June 119 113 -5.2% July 119 107 -10.1% August 119 108 -8.6% September 124 112 -9.9% October 122 113 -7.4% November 124 115 -7.3% 12-Month Avg 125 117 -6.4% Data is refreshed regularly to capture changes in market activity. Figures shown may be different than previously reported. Current as of December 5, 2015. All data from CarolinaMLS. Report provided by the Charlotte Regional REALTOR® Association. Powered by ShowingTime 10K. | 6 127 124 115 2013 2014 2015 November 100 110 120 130 140 150 160 170 1-2004 1-2005 1-2006 1-2007 1-2008 1-2009 1-2010 1-2011 1-2012 1-2013 1-2014 1-2015 Historical List to Close 128 124 116 2013 2014 2015 Year To Date -6.5%-2.4% -7.3% -3.1%
- 7. Days on Market Until Sale Month Prior Year Current Year +/– December 99 76 -23.4% January 103 77 -25.4% February 102 80 -21.3% March 100 78 -21.4% April 100 69 -31.2% May 80 67 -16.4% June 71 61 -14.7% July 69 58 -16.5% August 70 58 -17.0% September 73 61 -16.3% October 71 61 -13.6% November 71 62 -13.5% 12-Month Avg 100 80 -20.1% Data is refreshed regularly to capture changes in market activity. Figures shown may be different than previously reported. Current as of December 5, 2015. All data from CarolinaMLS. Report provided by the Charlotte Regional REALTOR® Association. Powered by ShowingTime 10K. | 7 Days on Market (“DOM”) tracks the days on market for a property specific to the MLS number. “DOM” accrues for “Active” and “Under Contract-Show” statuses. “DOM” does not include any days that the listing is in “Under Contract-No Show,” “Temporarily off Market,” “Closed/Sold,” “Expired” and “Withdrawn” statuses. 94 71 62 2013 2014 2015 November 40 50 60 70 80 90 100 110 120 130 140 1-2004 1-2005 1-2006 1-2007 1-2008 1-2009 1-2010 1-2011 1-2012 1-2013 1-2014 1-2015 Historical Days on Market 95 81 65 2013 2014 2015 Year To Date -19.0%-24.5% -13.5% -15.4%
- 8. Cumulative Days on Market Until Sale Month Prior Year Current Year +/– December 115 92 -20.3% January 118 91 -22.5% February 117 98 -16.2% March 118 96 -18.3% April 127 85 -32.7% May 106 81 -23.2% June 92 73 -20.8% July 85 69 -19.0% August 86 71 -17.2% September 85 72 -15.4% October 86 73 -15.4% November 85 71 -16.9% 12-Month Avg 100 80 -20.1% Data is refreshed regularly to capture changes in market activity. Figures shown may be different than previously reported. Current as of December 5, 2015. All data from CarolinaMLS. Report provided by the Charlotte Regional REALTOR® Association. Powered by ShowingTime 10K. | 8 Cumulative Days on Market (“CDOM”) functions like “DOM”; however, “CDOM” tracks the days on market for a property over multiple listings on the property. When a new listing is entered, the “CDOM” only resets to zero if the previous listing closed (as in sold), or if the previous listing has been off market (expired or withdrawn) for more than 90 days. 107 85 71 2013 2014 2015 November 60 80 100 120 140 160 180 200 1-2004 1-2005 1-2006 1-2007 1-2008 1-2009 1-2010 1-2011 1-2012 1-2013 1-2014 1-2015 Historical Cumulative Days on Market 111 99 79 2013 2014 2015 Year To Date -20.1%-20.4% -16.9% -11.5%
- 9. Average List Price Average list price for all homes that have been newly listed on the market in a given month. Month Prior Year Current Year + / – December $233,103 $237,442 +1.9% January $258,637 $265,065 +2.5% February $274,029 $283,492 +3.5% March $280,730 $286,585 +2.1% April $285,580 $293,843 +2.9% May $277,670 $290,873 +4.8% June $271,600 $275,462 +1.4% July $262,279 $270,183 +3.0% August $260,200 $277,334 +6.6% September $254,844 $283,229 +11.1% October $259,604 $271,926 +4.7% November $250,455 $268,973 +7.4% 12-Month Avg $266,481 $277,629 +4.2% Data is refreshed regularly to capture changes in market activity. Figures shown may be different than previously reported. Current as of December 5, 2015. All data from CarolinaMLS. Report provided by the Charlotte Regional REALTOR® Association. Powered by ShowingTime 10K. | 9 $254,973 $250,455 $268,973 2013 2014 2015 November $180,000 $200,000 $220,000 $240,000 $260,000 $280,000 $300,000 1-2004 1-2005 1-2006 1-2007 1-2008 1-2009 1-2010 1-2011 1-2012 1-2013 1-2014 1-2015 Historical Average List Price $255,400 $268,188 $279,762 2013 2014 2015 Year To Date +4.3%-1.8% +7.4% +5.0%
- 10. Average Sales Price Average sales price for all closed sales, not accounting for seller concessions, in a given month. Month Prior Year Current Year + / – December $228,338 $233,242 +2.1% January $214,806 $214,061 -0.3% February $208,380 $221,721 +6.4% March $217,275 $240,711 +10.8% April $224,519 $237,293 +5.7% May $235,936 $249,636 +5.8% June $258,515 $259,197 +0.3% July $242,068 $253,077 +4.5% August $240,067 $246,297 +2.6% September $226,990 $239,393 +5.5% October $227,689 $238,559 +4.8% November $227,426 $240,663 +5.8% 12-Month Avg $231,450 $241,733 +4.4% Data is refreshed regularly to capture changes in market activity. Figures shown may be different than previously reported. Current as of December 5, 2015. All data from CarolinaMLS. Report provided by the Charlotte Regional REALTOR® Association. Powered by ShowingTime 10K. | 10 $218,418 $227,426 $240,663 2013 2014 2015 November $170,000 $180,000 $190,000 $200,000 $210,000 $220,000 $230,000 $240,000 $250,000 $260,000 $270,000 1-2004 1-2005 1-2006 1-2007 1-2008 1-2009 1-2010 1-2011 1-2012 1-2013 1-2014 1-2015 Historical Average Sales Price $222,165 $231,703 $242,436 2013 2014 2015 Year To Date + 4.6%+ 4.1% + 5.8% + 4.3%
- 11. Median Sales Price Median price point for all closed sales, not accounting for seller concessions, in a given month. Month Prior Year Current Year + / – December $175,000 $184,900 +5.7% January $165,000 $166,200 +0.7% February $165,000 $178,000 +7.9% March $175,000 $191,000 +9.1% April $176,775 $190,000 +7.5% May $187,000 $200,000 +7.0% June $197,000 $208,200 +5.7% July $191,750 $200,000 +4.3% August $185,000 $199,000 +7.6% September $180,000 $189,900 +5.5% October $178,100 $186,000 +4.4% November $180,000 $197,000 +9.4% 12-Month Med $180,100 $192,000 +6.6% Data is refreshed regularly to capture changes in market activity. Figures shown may be different than previously reported. Current as of December 5, 2015. All data from CarolinaMLS. Report provided by the Charlotte Regional REALTOR® Association. Powered by ShowingTime 10K. | 11 $173,000 $180,000 $197,000 2013 2014 2015 November $130,000 $140,000 $150,000 $160,000 $170,000 $180,000 $190,000 $200,000 $210,000 1-2004 1-2005 1-2006 1-2007 1-2008 1-2009 1-2010 1-2011 1-2012 1-2013 1-2014 1-2015 Historical Median Sales Price $172,000 $181,000 $193,000 2013 2014 2015 Year To Date +6.6%+4.0% +9.4% +5.2% 10B10B
- 12. Percent of Original List Price Received Month Prior Year Current Year + / – December 93.2% 93.8% +0.6% January 93.3% 93.4% +0.1% February 92.6% 93.6% +1.0% March 93.4% 94.6% +1.3% April 94.0% 95.1% +1.1% May 94.7% 95.5% +0.8% June 94.9% 95.7% +0.8% July 94.5% 95.4% +1.0% August 94.7% 95.3% +0.6% September 94.2% 95.2% +1.0% October 93.7% 94.6% +1.0% November 94.0% 95.0% +1.1% 12-Month Avg 94.1% 94.9% +0.9% Percentage found when dividing a property’s sales price by its original list price, then taking the average for all properties sold in a given month, not accounting for seller concessions. Data is refreshed regularly to capture changes in market activity. Figures shown may be different than previously reported. Current as of December 5, 2015. All data from CarolinaMLS. Report provided by the Charlotte Regional REALTOR® Association. Powered by ShowingTime 10K. | 12 93.7% 94.0% 95.0% 2013 2014 2015 November 86% 88% 90% 92% 94% 96% 98% 100% 1-2004 1-2005 1-2006 1-2007 1-2008 1-2009 1-2010 1-2011 1-2012 1-2013 1-2014 1-2015 Historical Percent of Original List Price Received 94.0% 94.1% 95.0% 2013 2014 2015 Year To Date +1.0%+0.3% +1.1% +0.1% 11B11B
- 13. Housing Affordability Index Month Prior Year Current Year + / – December 179 165 -7.8% January 175 187 +7.0% February 177 175 -1.4% March 168 161 -4.0% April 165 163 -0.9% May 160 156 -2.9% June 152 147 -3.4% July 156 151 -3.4% August 162 152 -6.1% September 165 162 -2.2% October 170 165 -3.0% November 168 154 -8.3% 12-Month Avg 167 162 -3.0% Data is refreshed regularly to capture changes in market activity. Figures shown may be different than previously reported. Current as of December 5, 2015. All data from CarolinaMLS. Report provided by the Charlotte Regional REALTOR® Association. Powered by ShowingTime 10K. | 13 This index measures housing affordability for the region. An index of 120 means the median household income was 120% of what is necessary to qualify for the median-priced home under prevailing interest rates. A higher number means greater affordability. 190 168 154 2013 2014 2015 November 100 120 140 160 180 200 220 240 1-2004 1-2005 1-2006 1-2007 1-2008 1-2009 1-2010 1-2011 1-2012 1-2013 1-2014 1-2015 Historical Housing Affordability Index 191 167 158 2013 2014 2015 Year To Date -5.9%-11.2% -8.3% -12.2% 12B12B
- 14. Inventory of Homes for Sale The number of properties available for sale in active status at the end of a given month. Month Prior Year Current Year + / – December 14,726 13,770 -6.5% January 14,965 13,582 -9.2% February 15,300 13,474 -11.9% March 15,892 14,005 -11.9% April 16,745 14,262 -14.8% May 17,167 14,477 -15.7% June 17,308 14,377 -16.9% July 17,219 14,448 -16.1% August 16,854 14,098 -16.4% September 16,356 13,680 -16.4% October 15,790 12,964 -17.9% November 15,050 11,666 -22.5% 12-Month Avg 16,114 13,734 -14.7% Data is refreshed regularly to capture changes in market activity. Figures shown may be different than previously reported. Current as of December 5, 2015. All data from CarolinaMLS. Report provided by the Charlotte Regional REALTOR® Association. Powered by ShowingTime 10K. | 14 15,975 15,050 11,666 2013 2014 2015 November 10,000 12,000 14,000 16,000 18,000 20,000 22,000 24,000 26,000 28,000 30,000 1-2004 1-2005 1-2006 1-2007 1-2008 1-2009 1-2010 1-2011 1-2012 1-2013 1-2014 1-2015 Historical Inventory of Homes for Sale -22.5%-5.8% 13B13B
- 15. Months Supply of Homes for Sale The inventory of homes for sale at the end of a given month, divided by the average monthly pending sales from the last 12 months. Month Prior Year Current Year + / – December 5.2 4.5 -13.5% January 5.3 4.4 -17.0% February 5.4 4.3 -20.4% March 5.6 4.4 -21.4% April 5.9 4.4 -25.4% May 6.1 4.4 -27.9% June 6.0 4.3 -28.3% July 5.9 4.3 -27.1% August 5.7 4.2 -26.3% September 5.5 4.0 -27.3% October 5.3 3.8 -28.3% November 5.0 3.3 -34.0% 12-Month Avg 5.6 4.2 -25.0% All data from CarolinaMLS. Report provided by the Charlotte Regional REALTOR® Association. Powered by ShowingTime 10K. | 15 Note: CarolinaMLS did not include “showable” under contract listings in the “Pending Sales” stats before July 2012. Listing agents report listings as “Under Contract-Show” earlier in the transaction. As a result, the new “Pending Sales” stats trend higher and the new “Months Supply of Inventory” stats trend lower since July 2012. | Data is refreshed regularly to capture changes in market activity. Figures shown may be different than previously reported. Current as of December 5, 2015. 5.6 5.0 3.3 2013 2014 2015 November 0 2 4 6 8 10 12 14 16 18 20 1-2005 1-2006 1-2007 1-2008 1-2009 1-2010 1-2011 1-2012 1-2013 1-2014 1-2015 Historical Months Supply of Inventory -34.0%-10.7% 14B14B