Infographics in the classroom
•
7 gefällt mir•5,920 views

This is a presentation that accompanied a webinar on Infographics in the classroom

Empfohlen
Empfohlen
Weitere ähnliche Inhalte
Andere mochten auch
Andere mochten auch (17)
Ähnlich wie Infographics in the classroom
Ähnlich wie Infographics in the classroom (20)
Mehr von SchoolNet SA
Mehr von SchoolNet SA (20)
Kürzlich hochgeladen
Kürzlich hochgeladen (20)
Infographics in the classroom
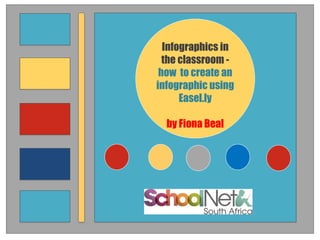
- 1. Infographics in the classroom - how to create an infographic using Easel.ly by Fiona Beal
- 3. http://visual.ly/what-infographic-2 What is an Infographic? • Data • Information/idea organisation • Text features • Images • Font and colour
- 4. Workshop on Infographics from ISTE 2013 http://www.infographics-edkit.com/
- 5. Pinterest board on Infographics in the classroom http://www.pinterest.com/fibeal/infographics-in-the-classroom/
- 7. Applications for making infographics
- 8. Statistical information Informational infographic Gameboard metaphor Timeline information Process infographic Interactive infographics Types of Infographics
- 17. • present a topic, issue or information • pre-teach or teach a new subject • summarise points in a topic or event • introduce the writer of a novel or a story • talk about the story or the novel highlighting the important event. • present an argument from statistical data • create a timeline – remembering important events • present a book review or a news article. The use of infographics in the classroom
- 18. For the student
- 19. • makes information easily accessible and meaningful • it feeds into tendency to learn by seeing and interacting • reinforces that conclusions should be grounded in evidence • challenges ability to organize information into a hierarchy of importance • helps with idea organisation – cause/effect, chronological order, attributes & characteristics, comparisons, summarising research, etc. Benefits to students
- 20. Teach different types Focus on one type Let them interpret understanding of an infographic in a written paragraph Let them search for infographics of interest Teach strategies for interpreting data Teaching Infographics to students Use a rubric when they create an infographic
- 21. Provide them with a rubric http://goo.gl/vzHCik
- 23. Step 1: Research and gather your content or data Step 2: Choose your application and template Step 3: Reorganise your template Step 4: Add your words Step 5: Decide on your fonts and colour Step 6: Publish your infographic Six steps to creating an infographic
- 25. Thank you!