Weitere ähnliche Inhalte
Mehr von Sanman Rajput (18)
Grid connected-solar-power-project-installed-capacity
- 1. Sr.
No.
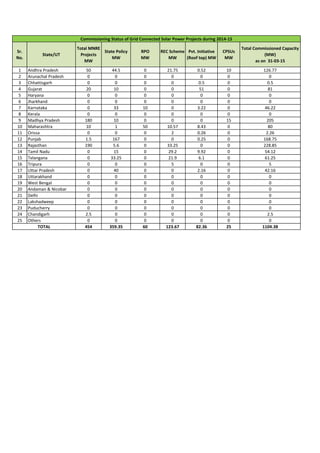
State/UT
Total MNRE
Projects
MW
State Policy
MW
RPO
MW
REC Scheme
MW
Pvt. Initiative
(Roof top) MW
CPSUs
MW
Total Commissioned Capacity
(MW)
as on 31-03-15
1 Andhra Pradesh 50 44.5 0 21.75 0.52 10 126.77
2 Arunachal Pradesh 0 0 0 0 0 0 0
3 Chhattisgarh 0 0 0 0 0.5 0 0.5
4 Gujarat 20 10 0 0 51 0 81
5 Haryana 0 0 0 0 0 0 0
6 Jharkhand 0 0 0 0 0 0 0
7 Karnataka 0 33 10 0 3.22 0 46.22
8 Kerala 0 0 0 0 0 0 0
9 Madhya Pradesh 180 10 0 0 0 15 205
10 Maharashtra 10 1 50 10.57 8.43 0 80
11 Orissa 0 0 0 2 0.26 0 2.26
12 Punjab 1.5 167 0 0 0.25 0 168.75
13 Rajasthan 190 5.6 0 33.25 0 0 228.85
14 Tamil Nadu 0 15 0 29.2 9.92 0 54.12
15 Telangana 0 33.25 0 21.9 6.1 0 61.25
16 Tripura 0 0 0 5 0 0 5
17 Uttar Pradesh 0 40 0 0 2.16 0 42.16
18 Uttarakhand 0 0 0 0 0 0 0
19 West Bengal 0 0 0 0 0 0 0
20 Andaman & Nicobar 0 0 0 0 0 0 0
21 Delhi 0 0 0 0 0 0 0
22 Lakshadweep 0 0 0 0 0 0 0
23 Puducherry 0 0 0 0 0 0 0
24 Chandigarh 2.5 0 0 0 0 0 2.5
25 Others 0 0 0 0 0 0 0
454 359.35 60 123.67 82.36 25 1104.38
Commissioning Status of Grid Connected Solar Power Projects during 2014-15
TOTAL