1. EVALUATING CROSSES BASED ON DISTANCE BETWEEN
OPPOSITION DEFENDERS AND POSITION OF THE ATTACKING
PLAYERS
This article aims to evaluate crosses based on the position and distance between opposition
defenders with respect to the position of the attacking players when the cross is delivered. A
tactical model, based on the above research, will further look to improve the efficiency of the
crosses and create a better final outcome for the attacking team. The crossing events of FC
Bayern Munich 2015-16 Season (until winter break) were used for this case study.
INTRODUCTION
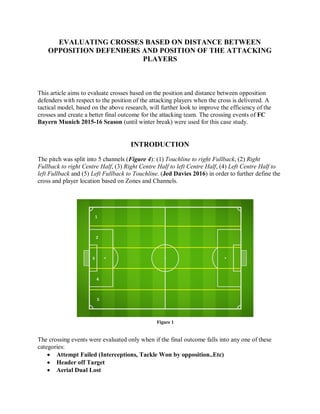
The pitch was split into 5 channels (Figure 4): (1) Touchline to right Fullback, (2) Right
Fullback to right Centre Half, (3) Right Centre Half to left Centre Half, (4) Left Centre Half to
left Fullback and (5) Left Fullback to Touchline. (Jed Davies 2016) in order to further define the
cross and player location based on Zones and Channels.
The crossing events were evaluated only when if the final outcome falls into any one of these
categories:
Attempt Failed (Interceptions, Tackle Won by opposition..Etc)
Header off Target
Aerial Dual Lost
Figure 1
2. SAMIRA KUMAR V TWITTER
Header on Target
Goal from Header
Goal from Shot
Header Won
Shot off Target
Shot on Target
Shot Blocked
The initial cross should lead to any one of the above outcomes. There could be cases where one
event could lead to multiple outcomes: Initial Header won could lead to a Header on Target. In
these cases, the highest priority- Header on Target, Goal from Header and Goal from Shot are
considered and events are recorded under these categories. So the highest priority is given to
outcomes leading to a goal, followed by attempts directly at goal (Shot on Target, Header on
Target and Header Won) that were saved by the Goal Keeper, followed by the rest of the
outcomes such as Aerial Dual lost, Shot off Target...etc.
Crosses were further narrowed down to In Swinging, Out Swinging and Cut Backs into areas
Near Post, Center Post and Far Post.
The locations of crosses were mainly from the Channels 1 and 5, restricted between the penalty
box and center half line. The receiving area of the cross is inside the penalty box. The red dots in
the Figure 5 show the location of the crosses for all the outcomes.
Figure 2
3. SAMIRA KUMAR V TWITTER
Figure 6 shows an example of an crossing event chosen at random. It’s a cross from Philip
Lahm against Darmstadt. It is an out swinging cross aimed at the Near Post. We could look at
the position distance of the 4 defenders (LB, CB, CB and RB). There is a large gap between the
CB and RB and the MID is trying to drop in the gap to close down the space since there are 2
Bayern attackers closer to the gap. It can be noticed that the 3 defenders (LB, CB and CB) have
almost forced away from the goal (Bayern player movements and also the factor of Transition).
It’s possibly a 3v3 or 3v2 (if the MID doesn’t drop deep faster) for Bayern in front of the goal. If
the cross is towards the center or far post, then the outcome could have been different than the
Aerial Dual Lost outcome.
Figure 3
4. SAMIRA KUMAR V TWITTER
The aim of this research is to find the most common pattern (player movements, opposition
defenders position) that is present in all these events and the distance between the players that
had facilitated these outcomes.
SUCCESSFUL OUTCOMES
5. SAMIRA KUMAR V TWITTER
Figure 7 shows the events that led to a goal from a header or from a shot. Goals, from either a
header or shot, after a cross are considered as a successful outcome. The highest distances (red
zones in the graph) between a fullback and a central defender are 22.17 metres and 21.33 metres
but the distance between the opposite side full back and the other center back were less. For
instance, 22.17 metres between RB and CB leaves only 5.26 metres between the LB and CB
(asymmetrical). This effectively isolates the un-stretched defenders (Bayern overload them) near
the goal if their midfielders don’t provide support (Figure 8).
Figure 4
6. SAMIRA KUMAR V TWITTER
One of the MID provides support to the CB to block the cross. The other CB and LB marks one
Bayern player near the goal. The other Midfielder is slow to close the space in front of him and
Bayern score from a Cut Back to the player on the edge of the box.
Figure 9 is the position for a successful event which had the second largest distance between a
full back and a Center Back. In this case, the space between the full back and the center back
isn’t attacked by any Bayern players.
Figure 5
Figure 9: Goal from Header vs. Mainz
7. SAMIRA KUMAR V TWITTER
One common pattern from Bayern is to commit fewer players (2-3 with 1 player on the edge to
win 2nd
ball) to attack a cross, but the players always attack the weakest spot (Isolate a pair of
defenders near the goal when opposition stretched) in the opposition defense. Lesser
commitment of players ensures opposition doesn’t commit equal number of players: If Bayern
commits 5 players, opposition would probably force their midfielders to drop further deep (in the
spaces), thereby committing equal or more players than Bayern attack with thereby reducing the
chances of a successful cross.
Figure 10 shows the defensive players position for all the successful crosses from Bayern. It’s
quite clear from this that the weakened area (defenders push far out and have higher distances)
are attacked with less players, while the area near the goal with lesser defenders (marked as red)
are overloaded. Instead of an attacker dropping into the space created by the wide movement of
the defender (away from goal), the attacker moves away from this space and moves towards the
un-stretched area. This also considers the factors of a faster transition time from Bayern to cross
(less time for the opposition players to follow the attacker). For successful outcome from this
method, the attacker has to win the first header or the nearby attackers to win the 2nd
ball. In case
with shorter distances between players, crosses were successful.
Figure 9: Goal from Header vs. Mainz
9. SAMIRA KUMAR V TWITTER
PARTIAL SUCCESS
Partially successful outcomes (Shot on Target, Header won and Header on Target) were
higher from the channel 5 (Figure 11) with 10 attempts compared to 6 from channel 1. The
distances between LB and CB were relatively higher compared to the CB-CB and CB-RB
combinations, indicating Bayern’s preference to use the channel 5 to attack.
Note: In cases where there are 3 Center Backs (5-3-2 system), then distance is then calculated between
the 2 farthest CB, ignoring the Center Back in the middle.
In one of the partial success event against Dinamo Zagreb, the distances between defenders are
higher compared to a similar successful event against the same opposition. The distances
between defenders, for the partially successful event, were higher than the successful one and the
attacking zone were similar (Far Post) as seen in Figure 12.
But the major difference between the 2 incidents is the location of the Bayern players (Black
zone). In case of the successful one, the Bayern players were lot closer to each other and were
near the attacking zone, 2v2 with the defenders. In the partial success event, the players were
spread out (wide black region) and the main attacker under-loaded 1v2.
Figure 11: Cross Location for Partially Successful Outcomes
10. SAMIRA KUMAR V TWITTER
Even in the events of a partial success, the opposition defenders were spread out and were having
similar distances between them, but the position and movement of the Bayern attackers
influenced the final outcome. For instance, looking at figure 12, the Bayern player at the bottom
of the triangle in partially successful event moves away from the goal, while the player in same
position, moves towards goal in the successful event (Figure 13).
Figure 12
11. SAMIRA KUMAR V TWITTER
It’s the same player (Lewandowski) who makes the final header on both occasions, but the other
players movement has an large impact on the final outcome, even though the distances between
defenders were higher in case of the partially successful event. The defender (yellow circle in
Figure 13), 1v1 with Lewandowski, has to think about the other attacker as well if the attacker
makes a move towards the goal. So this would influence the technique of the defender (under
pressure from 2 attackers) when looking to block the cross, as he has less time to think about
both the attackers and also to position himself better to defend the cross. But if only
Lewandowski had attacked the cross (partially successful event), the defender would have more
time and will be more focused on the single attacker, giving him higher possibility of winning
the 1v1. These minute details have high influence on the final outcome.
The closer we look at the distances between the defenders for partially successful events, large %
of them lie in the green zone (lesser distance between the defenders), in the range of 5-10
metres. This small distance will be lot easier to cover and defend by the defender himself or for
a midfielder to drop back and cover the small space.
Figure 13
12. SAMIRA KUMAR V TWITTER
FAILED CROSSES
Events that led to either an Aerial Dual lost, Shot off Target, Shot Blocked, Header off Target
and Attempt Failed fall into the category of failed crosses. Attempts failed are miscellaneous
events such as interceptions, player doesn’t shoot, tackle won and events that doesn’t lead to any
attempt on goal.
The distances between defenders in these cases were low compared to the previous events as
there were more instances of crosses from close to the penalty box (Figure 14)
Crosses from closer to the penalty box could mean that the opposition defenders are not stretched
(more compact) and there are more number of defenders inside the penalty box (considering that
the opposition have settled, compact and are not in transition).
Bayern prefer to have 1v1 duals before delivering a cross. Notably Kingsley Coman and
Douglas Costa would look to beat the first defender with a 1v1 dribble before delivering the
cross. This would mean the first defender (Full Backs) or wide Midfielders (in some cases)
movement would stretch the entire defense:
Figure 14
14. SAMIRA KUMAR V TWITTER
Full back stretched would mean that either the nearest Center Back or a midfielder to follow the
stretched full back to provide and the defensive line expands as a result of continuous reaction to
the defenders movement.
Larger % successful crosses were delivered from near the touchline (wide areas), with exception
for few crosses from the edge of the box (crosses when opposition were pressed higher and were
in defensive transition). Players attacking crosses, from edge of the box, would have less space
and time (if the cross is driven) to meet the cross and the defender will ideally be close to each
other and can provide more effective cover.
Douglas Costa’s most common crossing routine would be to win 1v1 with his defender in wide
areas (close to touchline in channel 1 and 5) and provide a fast driven cross towards the area
between the penalty spot and the goal. The 1v1 with a fullback stretches the defensive line while
the driven cross provides less time for the opposition defenders and midfielders to cover the
space in their defensive line.
Figure 15 shows the position of the defenders for each of the outcomes (successful, partially
successful and unsuccessful crosses). Bigger the size of the circle, longer the distance between
him and his nearest defender. For instance, if the LB (blue) has a bigger circle, then the distance
between him and his nearest LCB is higher. The total range of the distance between each nearest
defender is 0-30 metres.
Conclusions from Figure 15:
The average distances (bigger circles) between defenders are higher in case of successful
crosses (Opposition more stretched out in the side of attack). The position of the full
backs is higher on the pitch in this case.
The spread of the players (area covered by them) gets decreased as the crosses success
reduces (Players become narrower to the goal).
Large numbers of events are unsuccessful when they occur near the penalty box.
The presence of full backs inside the penalty box (Channels 2 and 4) increases as the
crossing success decreases (defensive line becomes narrow).
The position of center backs drops slightly (drops deep towards their own goal) when the
defensive line is not stretched.
CONCLUSION
Distances between defenders, at the time of crossing, has a significant influence on the final
outcome of the cross.
The location of the cross also determines, to an extent, the final outcome of the cross
considering the transition state (In transition or a settled defense) of the opposition. Closer
the location of the cross to the penalty box, more tighter the opposition defense and hence
greater difficulty to have a successful outcome. On the other hand, crosses from wide areas
(near the touchline), when produced with a faster transition (not allowing opposition to settle
into their shape) and also in an overload situation (2v1) have high chances of having a
successful outcome.
Partial successful outcomes have similar initial setup (cross location, player positions…Etc)
as that off successful outcomes.
15. SAMIRA KUMAR V TWITTER
Bayern’s most preferred method is to attack the crosses in the un-stretched area (area
opposite to the stretched area). This is because the area that is stretched could be filled in by
another player (losing space) and the stretched area will be away from goal. So attacking the
un-stretched area with overloads will have higher chances of becoming a successful event
(based on this study).
References:
Jed Davies Marcelo Bielsa Book 2016
Video Clips of the crossing actions
Tableau Dashboard for the Crosses Events:
https://public.tableau.com/profile/publish/BayernCrosses/MainDashboard#!/publish-confirm
Data Capture using Tableau:
The main key data’s that were needed for this research are the position coordinates of the players
on the pitch and calculating the distance (metres) between the players. Due to the non availability
of these data to the public, the only possible way to get them was to plot them manually. The
main software that was used to plot these data is the Tableau, using visual evidence of the
crosses video clips.
Tableau:
The coordinates (image pixel range) of the image of the
football pitch is entered into the excel sheet (Figure 1).
I’m using an image with 820x547 dimensions. This sheet
is then loaded onto the Tableau application.
The background image is added onto the Tableau as
shown in Figure 2.
The coordinates of the image
size (820,547) are entered in the
X and Y field so as to ensure
the coordinates plotted in the
graph are within the range of
the picture.
Once the image is added, then
the location coordinates of the
players can be found out as
shown in the Figure 3.
Figure 6
Figure 7
16. SAMIRA KUMAR V TWITTER
Assume a player is on the right edge of the box. In order to find his coordinates, right-click on
the location and choose the option Annotate-Point. This would give us the coordinates of the
players in pixels with respect to the background image.
Since the points are located based on the clips from television angle, the accuracy of the
coordinates is not 100% (lack of proper camera angle). Around 700 player coordinates were
plotted based on the total crossing events and the players were tagged based on their role in the
team: Defender, Midfielder, and Attacker along with Cross Location. Data’s such as the Type of
cross, Cross Aim location, Crossing Players and Final outcomes were also mapped. The players,
for whom the coordinates were plotted, should be involved in the action (attack or defend the
cross) in order to evaluate their impact on the final outcome of the event.
Distance between the players was plotted based on the location coordinates (X and Y) of the
players and using the basic distance between 2 points formulae to find the distance between 2
players. The distances were calculated for the Defenders: Left back, Left Center Back, Right
Center Back and Right Back. Once again the accuracy of the distances measured is not 100%
since the distance measured requires the X and Y coordinates, which itself isn’t accurate. So one
might assume the distances to be approximate and the whole research is based on these values.
High efforts were taken in order to ensure that the X and Y coordinates and the distance
measured were close to being 100% accurate.
Figure 8