Excel In-Class Activity—Absolute Referencing
Electricity Bill
After completing this assignment, you will be able to:
Create an assumption area to display key data
Use absolute referencing to build formulas that can written once and copied to multiple cells
Build nested IF functions
Create charts to display spreadsheet values
Set print ranges
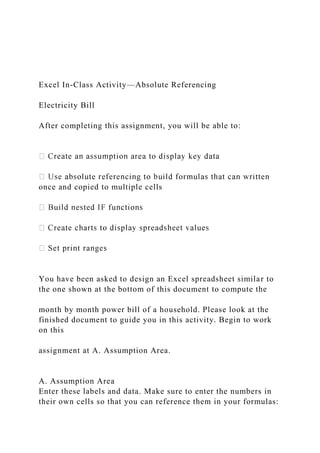
You have been asked to design an Excel spreadsheet similar to the one shown at the bottom of this document to compute the
month by month power bill of a household. Please look at the finished document to guide you in this activity. Begin to work on this
assignment at A. Assumption Area.
A. Assumption Area
Enter these labels and data. Make sure to enter the numbers in their own cells so that you can reference them in your formulas:
Basic Consumer Charge = 9.17
Charge per KWH = 0.0486
Fuel Adjustment per KWH = 0.01651
% GA Tax = 6%
B. Input and Format Data
1. Create a worksheet similar to the provided image using the data provided in the following table:
Month
Jan Feb Mar Apr May June July Aug Sept Oct Nov Dec
1276 1452 1178 857 560 319 567 683 756 815 978 1012
2. Use cell styles for title and headings (A4:A7, A13:M13). Use the Total cell style for A18:M:18.
3. Write a formula to compute each item in the power bill for January according to the following formulas:
Power Energy Charge = KWH Usage * Charge per KWH
Fuel Adjustment Cost = KWH Usage * Fuel Adjustment per KWH
GA Tax = (Power Energy Charge +Fuel Adjustment + Basic Charge)*%GA tax
Total = Power Energy Charge + Fuel Adjustment + Basic Charge + GA Tax
Important: Write one formula for each item in January’s power bill that can be copied to the remaining cells to compute the
values correctly (i.e. use absolute referencing appropriately).
4. Use Accounting format for Power Energy charge, fuel adjustment cost, GA Tax, and Total.
5. Copy the formulas in B15 to B18 to the remaining months.
Check: December’s total should be $79.56. May’s total should be $48.37.
6. Using the =average function, compute the average KWH consumption in cell B10 and the average total in cell B11.
C. Input Chart
1. Use the Chart Wizard to draw a line graph that shows the KWH usage per month. Be sure to include:
a) Chart title, Axis label, and Legend
b) Show data Table (Chart Tools ->Design)
c) Move to a new location. Create a new sheet called “Line Chart”.
D. Nested IF function
1. Create a nested IF function that does the following:
a) Evaluates the KWH usage for each month and displays High for usage that exceeds 1000 KWH
b) Normal for usage that is above 700
c) Low for usage that is at or below 700
D. Finishing touches
1. Rename Sheet 1 of the worksheet as Power Bill.
2. Check your work and submit your workbook in the course dropbox in Electricity Bill.
Enter these
yourself
IF function
displays
here for
each
month
...
1. Excel In-Class Activity—Absolute Referencing
Electricity Bill
After completing this assignment, you will be able to:
once and copied to multiple cells
You have been asked to design an Excel spreadsheet similar to
the one shown at the bottom of this document to compute the
month by month power bill of a household. Please look at the
finished document to guide you in this activity. Begin to work
on this
assignment at A. Assumption Area.
A. Assumption Area
Enter these labels and data. Make sure to enter the numbers in
their own cells so that you can reference them in your formulas:
2. B. Input and Format Data
1. Create a worksheet similar to the provided image using the
data provided in the following table:
Month
Jan Feb Mar Apr May June July Aug Sept Oct Nov Dec
1276 1452 1178 857 560 319 567 683 756 815 978 1012
2. Use cell styles for title and headings (A4:A7, A13:M13). Use
the Total cell style for A18:M:18.
3. Write a formula to compute each item in the power bill for
January according to the following formulas:
Power Energy Charge = KWH Usage * Charge per KWH
Fuel Adjustment Cost = KWH Usage * Fuel Adjustment per
KWH
GA Tax = (Power Energy Charge +Fuel Adjustment + Basic
Charge)*%GA tax
Total = Power Energy Charge + Fuel Adjustment + Basic
3. Charge + GA Tax
Important: Write one formula for each item in January’s power
bill that can be copied to the remaining cells to compute the
values correctly (i.e. use absolute referencing appropriately).
4. Use Accounting format for Power Energy charge, fuel
adjustment cost, GA Tax, and Total.
5. Copy the formulas in B15 to B18 to the remaining months.
Check: December’s total should be $79.56. May’s total should
be $48.37.
6. Using the =average function, compute the average KWH
consumption in cell B10 and the average total in cell B11.
C. Input Chart
1. Use the Chart Wizard to draw a line graph that shows the
KWH usage per month. Be sure to include:
a) Chart title, Axis label, and Legend
b) Show data Table (Chart Tools ->Design)
c) Move to a new location. Create a new sheet called “Line
Chart”.
D. Nested IF function
1. Create a nested IF function that does the following:
a) Evaluates the KWH usage for each month and displays High
for usage that exceeds 1000 KWH
b) Normal for usage that is above 700
4. c) Low for usage that is at or below 700
D. Finishing touches
1. Rename Sheet 1 of the worksheet as Power Bill.
2. Check your work and submit your workbook in the course
dropbox in Electricity Bill.
Enter these
yourself
IF function
displays
here for
each
month