State of Organic Seed (SOS) Report Part 3
•
0 gefällt mir•256 views

State of Organic Seed (SOS) Report Part 3

Empfohlen
Empfohlen
Weitere ähnliche Inhalte
Andere mochten auch
Andere mochten auch (8)
Ähnlich wie State of Organic Seed (SOS) Report Part 3
Ähnlich wie State of Organic Seed (SOS) Report Part 3 (20)
Mehr von Seeds
Mehr von Seeds (20)
Kürzlich hochgeladen
Kürzlich hochgeladen (20)
State of Organic Seed (SOS) Report Part 3
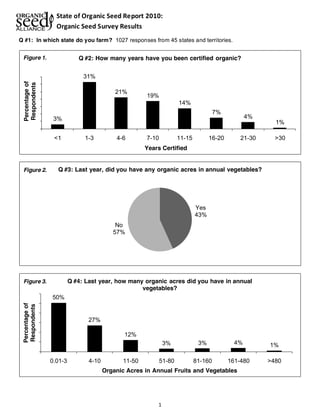
- 1. State of Organic Seed Report 2010: Organic Seed Survey Results Q #1: In which state do you farm? 1027 responses from 45 states and territories. Q #2: How many Figure 1. years have you been certified organic? Figure 2. Q #3: Last year, did you have any organic acres in annual vegetables? Q #4: Last year, how many organic acres did you have in annual vegetables? 1 3% 31% 21% 19% 14% 7% 4% 1% <1 1-3 4-6 7-10 11-15 16-20 21-30 >30 Percentage of Respondents Years Certified Yes 43% No 57% 50% 27% 12% 3% 3% 4% 1% 0.01-3 4-10 11-50 51-80 81-160 161-480 >480 Percentage of Respondents Organic Acres in Annual Fruits and Vegetables Figure 3.
- 2. State of Organic Seed Report 2010: Organic Seed Survey Results Q #5: Last year, what approximate percentage of total acreage of annual vegetables was planted with certified organic seed? Q #6: Percent organic seed Figure 5. used for TOMATOES - the #1 vegetable Q #6: Percent organic seed used for SUMMER / WINTER SQUASH - the #2 vegetable 2 7% 18% 5% 6% 4% 8% 4% 2% 12% 8% 7% 19% 0 1-10 11-20 21-30 31-40 41-50 51-60 61-70 71-80 81-90 91-99 100 Percentage of Respondents Percentage of vegetable acreage planted with organic seed Figure 4. Q #6: Last year, what were your top three annual vegetable crops by acreage, and what percentage of certified organic seed did you use for each? 9% 5% 4% 5% 3% 5% 4% 4% 12% 6% 6% 38% 0 1-10 11-20 21-30 31-40 41-50 51-60 61-70 71-80 81-90 91-99 100 Percentage of Respondents Percentage of organic seed used for tomatoes 10% 12% 6% 7% 4% 8% 1% 1% 7% 6% 4% 34% 0 1-10 11-20 21-30 31-40 41-50 51-60 61-70 71-80 81-90 91-99 100 Percentage of Respondents Percentage of organic seed used for squash Figure 6.
- 3. State of Organic Seed Report 2010: Organic Seed Survey Results Q #6: Percent organic Figure 7. seed used for GREENS - the #3 vegetable Figure 8. Q #7: Last year, did you have any organic acres in field crops? Figure 9. Q #8: Last year how many organic acres did you have in field crops? 3 1% 6% 2% 4% 3% 5% 3% 1% 18% 4% 6% 49% 0 1-10 11-20 21-30 31-40 41-50 51-60 61-70 71-80 81-90 91-99 100 Percentage of Respondents Percentage of organic seed used for greens Yes 60% No 40% 9% 7% 26% 15% 17% 18% 9% 0.01-3 4-10 11-50 51-80 81-160 161-480 >480 Percentage of Respondents Organic Acres in Field Crops
- 4. State of Organic Seed Report 2010: Organic Seed Survey Results Q #9: Last year, what approximate percentage (%) of total acreage of field crops was planted with certified organic seed? Q #10: Percent organic Figure 11. seed used for CORN - the #1 field crop Figure 12. Q #10: Percent organic seed used for SOYBEANS - the #2 field crop 4 10% 3% 1% 4% 3% 9% 3% 2% 9% 7% 2% 47% 0 1-10 11-20 21-30 31-40 41-50 51-60 61-70 71-80 81-90 91-99 100 Percentage of Respondents Percentage of field crop acreage planted with organic seed Figure 10. Q #10: Last year, what were your top 3 field crops by acreage? And what percentage of organic seed do you use for each? 8% 2% 2% 2% 2% 4% 2% 0% 5% 2% 0% 69% 0 1-10 11-20 21-30 31-40 41-50 51-60 61-70 71-80 81-90 91-99 100 Percentage of Respondents Percentage of organic seed used for corn 15% 3% 1% 1% 0% 3% 1% 1% 2% 1% 1% 73% 0 1-10 11-20 21-30 31-40 41-50 51-60 61-70 71-80 81-90 91-99 100 Percentage of Respondents Percentage of organic seed used for soybeans
- 5. State of Organic Seed Report 2010: Organic Seed Survey Results Q #10: Percent organic Figure 13. seed used for WHEAT - the #3 field crop Figure 14. Q #11: Last year, did you have any organic acres in forage crops? Q #12: Last year, how many organic acres in a given season do you have in forage crops? 5 21% 0% 1% 0% 0% 0% 2% 0% 1% 1% 0% 73% 0 1-10 11-20 21-30 31-40 41-50 51-60 61-70 71-80 81-90 91-99 100 Percentage of Respondents Percentage of organic seed used for wheat Yes No 48% 52% 4% 8% 29% 16% 25% 15% 2% 0.01-3 4-10 11-50 51-80 81-160 161-480 >480 Percentage of Respondents Organic Acres in Forage Crops Figure 15.
- 6. State of Organic Seed Report 2010: Organic Seed Survey Results Q #13: Last year, what approximate percentage (%) of total acreage of forage crops is planted with certified organic seed? Q #14: Last year, what approximate percentage (%) of total acreage of green manure and cover crops is planted with certified organic seed? Q #15: In the last year, what percent of your seed did you get from the 6 25% 4% 2% 4% 2% 6% 1% 1% 6% 4% 3% 44% 0 1-10 11-20 21-30 31-40 41-50 51-60 61-70 71-80 81-90 91-99 100 Percentage of Respondents Percentage of forage crop acreage planted with organic seed Figure 16. 38% 4% 2% 2% 1% 7% 1% 1% 5% 2% 1% 36% 0 1-10 11-20 21-30 31-40 41-50 51-60 61-70 71-80 81-90 91-99 100 Percentage of Respondents Percentage of cover crop acreage planted with organic seed Figure 17. 17% 43% 1% 28% 5% 5% following sources? Produce your own Seed broker Printed or internet catalogs Garden centers Other farmers Other Figure 18.
- 7. State of Organic Seed Report 2010: Organic Seed Survey Results Q #16: Over the last 3 years have you increased the percentage of organic seed that you use? Q #17: Over the last three years has your certifier requested that you take greater steps to source organic seed? Q #18: Check which Figure 21. additional steps your certifier has requested. 7 57% 71% 24% 29% 100% 80% 60% 40% 20% 0% All respondents Respondents not using 100% OG seed for last 3 years Have been using 100% certified organic seed for at least 3 years No Yes Figure 19. 20% Yes 61% No 39% Figure 20. 32% 33% 58% 23% Trialing of available organic varieties Searching OMRI seed database Researching more than three seed catalogs Other Percentage of Respondents
- 8. State of Organic Seed Report 2010: Organic Seed Survey Results Figure 2 2 . Q #19: The reasons you have not purchased organic seed in the past. Not a factor Slight Figure 23. Q #19: Factors rated moderate to significant for not purchasing organic seed 8 factor Moderate factor More than moderate factor Significant factor Lack of seed treatments such as pelleting or priming 82% 7% 5% 3% 3% Buyer demands varieties not available organically 68% 5% 7% 4% 16% Insufficient quantity of seed 40% 10% 15% 12% 23% Save my own seed 52% 11% 10% 6% 21% Distrust of organic seed quality 71% 8% 10% 5% 6% Price 46% 13% 16% 9% 16% Specific variety not available 17% 3% 9% 12% 58% Lack of desirable genetic traits 43% 9% 12% 11% 24% Seed sizing 80% 10% 6% 2% 2% Other 72% 1% 3% 4% 19% 11% 27% 50% 37% 20% 41% 79% 47% 10% 26% Lack of seed treatments such as pelleting or priming Buyer demands varieties not available organically Insufficient quantity of seed Save my own seed Distrust of organic seed quality Price Specific variety not available Lack of desirable genetic traits Seed sizing Other Percent rating as moderate to significant
- 9. State of Organic Seed Report 2010: Organic Seed Survey Results Q #20: What organic seed quality issues you have experienced? Figure 25. Q #20: Problems producers have had with organic seed quality 9 Not a problem Slight problem Moderate problem More than moderate problem Severe problem Figure 24. Germination / emergence 52% 17% 17% 11% 4% Varietal integrity (i.e. not true to type) 63% 16% 10% 7% 4% Contamination by weed seed in seed lots 70% 15% 9% 3% 3% Physical appearance looks suboptimal 71% 15% 9% 3% 2% Excessive chaff and foreign matter 81% 14% 4% 1% 1% Seedborne diseases 80% 11% 6% 2% 1% Uneven size for seeding equipment 82% 11% 4% 3% 1% Other 81% 3% 3% 6% 7% 31% 21% 14% 13% 6% 9% 7% 16% Germination / emergence Varietal integrity (i.e. not true to type) Contamination by weed seed in seed lots Physical appearance looks suboptimal Excessive chaff and foreign matter Seedborne diseases Uneven size for seeding equipment Other Percent rating Issue as moderate to severe
- 10. State of Organic Seed Report 2010: Organic Seed Survey Results Q #21: Do you have more problems with the above mentioned quality issues Figure 28. Q #23: The regulatory framework in place is adequate to protect 10 3% 23% 73% with untreated conventional seed or organic seed? I have more problems with untreated conventional seed. I have more problems with organic seed. Problems are about the same for both untreated conventional and organic seed. Figure 26. Questions 22 ± 26: How strongly do you agree or disagree with the statements: 37% 37% 21% 2% 4% Strongly Agree Agree Neutral Disagree Strongly Disagree Percentage of Respondents Q #22: Seed companies should conduct testing and report rates of GE (GMO) contamination in organic seed Figure 27. 6% 21% 31% 21% 22% Strongly Agree Agree Neutral Disagree Strongly Disagree Percentage of Respondents my organic farm product(s) from damages due to possible contamination by GE (GMO) crops
- 11. State of Organic Seed Report 2010: Organic Seed Survey Results How strongly do you agree or disagree with the statements (cont.): Figure 29. Q #24: My organic farm products are at risk from seed Figure 30. Q #25: Organic seed is important in maintaining the Figure 31. Q #26: Varieties bred for organic system management are 11 14% 27% 31% 20% 9% Strongly Agree Agree Neutral Disagree Strongly Disagree Percentage of Respondents contaminated by GE (GMO) traits 44% 34% 13% 6% 3% Strongly Agree Agree Neutral Disagree Strongly Disagree Percentage of Respondents integrity of organic food production 45% 38% 12% 3% 2% Strongly Agree Agree Neutral Disagree Strongly Disagree Percentage of Respondents important to the overall success of organic agriculture
- 12. State of Organic Seed Report 2010: Organic Seed Survey Results Q #27: Do you Figure 32. think that there are crops in need of organic breeding? Q #28: Three most important traits to breed for in SOYBEANS - the #2 field crop in need of breeding Yield Pest Resistance Quality Percentage of Respondents 12 Yes 65% No 35% Q #28: The highest priority crops you feel are in need of organic breeding (crop improvement) and the most important traits to breed for in those crops. Top three crops and top three traits listed. Please see Summary for descriptions and examples of traits. 36% 20% 12% Yield Quality Vigor Percentage of Respondents Q #28: Three most important traits to breed for in CORN - the #1 field crop in need of breeding Figure 33. 42% 20% 19% Figure 34.
- 13. State of Organic Seed Report 2010: Organic Seed Survey Results 27% 27% 13 22% Pest Resistance Yield Disease Resistance Percentage of Respondents Q #28: Three most important traits to breed for in ALFALFA- the #3 field crop in need of breeding Figure 35. 82% 12% 12% Disease Resistance Flavor Yield Percentage of Respondents Q #28: Three most important traits to breed for in TOMATOES- the #1 vegetable crop in need of breeding Figure 36. 29% 23% 17% Uniformity Disease Resistance Appearance Percentage of Respondents Q #28: Three most important traits to breed for in BRASSICAS- the #2 vegetable crop in need of breeding Figure 37.
- 14. State of Organic Seed Report 2010: Organic Seed Survey Results Q #29: Do you produce organic seed?* Q #30: Are you interested in producing organic seed for commercial use? 14 43% 20% 17% Disease Resistance Uniformity Quality Percentage of Respondents Q #28: Three most important traits to breed for in WINTER / SUMMER SQUASH - the #3 vegetable crop in need of breeding Figure 38. 39% 49% 9% 3% No, I do not produce organic seed either for on-farm or commercial use. I produce organic seed for on-farm use only. I produce organic seed commercially. I have produced organic seed commercially in the past but not currently. *Total greater than 100% because more than one response may apply Figure 39. 19% 49% 32% Yes, definitely No I am interested if economic opportunity and training are available. Figure 40.
- 15. State of Organic Seed Report 2010: Organic Seed Survey Results Q #31: Are you interested in conducting crop improvement/breeding on your Lack of seed treatments such as pelleting or priming 15 21% 40% 39% farm? Yes, definitely No I am interested if economic opportunity and training are available. Figure 41. Appendix A - Breakdown of specific questions by crop type (vegetable, field, forage) 437 562 431 182 111 58 600 500 400 300 200 100 0 Vegetables and Other Crops Field and Other Crops Forage and Other Crops Vegetables Only Field Crops Only Forage Crops Only Figure 42. Number of respondents who produce specific crop types Figures 43 ± 52: The reasons you have not purchased organic seed in the past: 100% 80% 60% 40% 20% 0% Not a factor Slight factor Moderate factor More than moderate factor Significant factor Growers produce: Vegetables and Other Crops Field and Other Crops Forage and Other Crops Vegetables Only Field Crops Only Forage Crops Only Figure 43.
- 16. State of Organic Seed Report 2010: Organic Seed Survey Results The reasons you have not purchased organic seed in the past (cont.): Processor (buyer) demands varieties in contract that are not available organically Insufficient quantity of seed 16 80% 70% 60% 50% 40% 30% 20% 10% 0% Not a factor Slight factor Moderate factor More than moderate factor Significant factor Growers produce: Vegetables and Other Crops Field and Other Crops Forage and Other Crops Vegetables Only Field Crops Only Forage Crops Only Figure 44. 50% 40% 30% 20% 10% 0% Not a factor Slight factor Moderate factor More than moderate factor Significant factor Growers produce: Vegetables and Other Crops Field and Other Crops Forage and Other Crops Vegetables Only Field Crops Only Forage Crops Only Figure 45. 80% 70% 60% 50% 40% 30% 20% 10% 0% Not a factor Slight factor Moderate factor More than moderate factor Significant factor Save my own seed Growers produce: Vegetables and Other Crops Field and Other Crops Forage and Other Crops Vegetables Only Field Crops Only Forage Crops Only Figure 46.
- 17. State of Organic Seed Report 2010: Organic Seed Survey Results The reasons you have not purchased organic seed in the past (cont.): Distrust of organic seed quality Specific variety not available 17 90% 80% 70% 60% 50% 40% 30% 20% 10% 0% Not a factor Slight factor Moderate factor More than moderate factor Significant factor Growers produce: Vegetables and Other Crops Field and Other Crops Forage and Other Crops Vegetables Only Field Crops Only Forage Crops Only Figure 47. 60% 50% 40% 30% 20% 10% 0% Not a factor Slight factor Moderate factor More than moderate factor Significant factor Price Growers produce: Vegetables and Other Crops Field and Other Crops Forage and Other Crops Vegetables Only Field Crops Only Forage Crops Only Figure 48. 80% 70% 60% 50% 40% 30% 20% 10% 0% Not a factor Slight factor Moderate factor More than moderate factor Significant factor Growers produce: Vegetables and Other Crops Field and Other Crops Forage and Other Crops Vegetables Only Field Crops Only Forage Crops Only Figure 49.
- 18. State of Organic Seed Report 2010: Organic Seed Survey Results The reasons you have not purchased organic seed in the past (cont.): Lack of desirable genetic traits Reasons rated moderate to significant for not purchasing organic seed in the past 18 70% 60% 50% 40% 30% 20% 10% 0% Not a factor Slight factor Moderate factor More than moderate factor Significant factor Growers produce: Vegetables and Other Crops Field and Other Crops Forage and Other Crops Vegetables Only Field Crops Only Forage Crops Only Figure 50. 90% 80% 70% 60% 50% 40% 30% 20% 10% 0% Not a factor Slight factor Moderate factor More than moderate factor Significant factor Seed sizing Growers produce: Vegetables and Other Crops Field and Other Crops Forage and Other Crops Vegetables Only Field Crops Only Forage Crops Only Figure 51. 100% 80% 60% 40% 20% 0% Lack of seed treatments such as pelleting or priming buyer demands varieties not available organically Insufficient quantity of seed Save my own seed Distrust of organic seed quality Price Specific variety not available Lack of desirable genetic traits Seed sizing Growers produce: Vegetables and Other Crops Field and Other Crops Forage and Other Crops Vegetables Only Field Crops Only Forage Crops Only Figure 52.
- 19. State of Organic Seed Report 2010: Organic Seed Survey Results Figures 53 - 60. What organic seed quality issues you have experienced? Germination/emergence Varietal integrity (i.e. not true to type) Contamination by weed seed in seed lots 19 80% 70% 60% 50% 40% 30% 20% 10% 0% Not a problem Slight problem Moderate problem More than moderate problem Severe problem Growers produce: Vegetables and Other Crops Field and Other Crops Forage and Other Crops Vegetables Only Field Crops Only Forage Crops Only Figure 53. 90% 80% 70% 60% 50% 40% 30% 20% 10% 0% Not a problem Slight problem Moderate problem More than moderate problem Severe problem Growers produce: Vegetables and Other Crops Field and Other Crops Forage and Other Crops Vegetables Only Field Crops Only Forage Crops Only Figure 54. 90% 80% 70% 60% 50% 40% 30% 20% 10% 0% Not a problemSlight problem Moderate problem More than moderate problem Severe problem Growers produce: Vegetables and Other Crops Field and Other Crops Forage and Other Crops Vegetables Only Field Crops Only Forage Crops Only Figure 55.
- 20. State of Organic Seed Report 2010: Organic Seed Survey Results Physical appearance looks suboptimal Excessive chaff and foreign matter 20 Organic seed quality issues (cont.): 90% 80% 70% 60% 50% 40% 30% 20% 10% 0% Not a problemSlight problem Moderate problem More than moderate problem Severe problem Growers produce: Vegetables and Other Crops Field and Other Crops Forage and Other Crops Vegetables Only Field Crops Only Forage Crops Only Figure 56. 100% 80% 60% 40% 20% 0% Not a problem Slight problem Moderate problem More than moderate problem Severe problem Growers produce: Vegetables and Other Crops Field and Other Crops Forage and Other Crops Vegetables Only Field Crops Only Forage Crops Only Figure 57. 100% 80% 60% 40% 20% 0% Not a problem Slight problem Moderate problem More than moderate problem Severe problem Seedborne diseases Growers produce: Vegetables and Other Crops Field and Other Crops Forage and Other Crops Vegetables Only Field Crops Only Forage Crops Only Figure 58.
- 21. State of Organic Seed Report 2010: Organic Seed Survey Results Uneven size for seeding equipment Do you have more quality issues with untreated conventional seed or organic seed? 21 Organic seed quality issues (cont.): 100% 80% 60% 40% 20% 0% Not a problem Slight problem Moderate problem More than moderate problem Severe problem Growers produce: Vegetables and Other Crops Field and Other Crops Forage and Other Crops Vegetables Only Field Crops Only Forage Crops Only Figure 59. 50% 40% 30% 20% 10% 0% Germination / emergence Varietal integrity (i.e. not true to type) Contamination by weed seed in seed lots Physical appearance looks suboptimal Excessive chaff and foreign matter Seedborne diseases Growers produce: Uneven size for seeding equipment Seed quality problems rated moderate to severe Vegetables and Other Crops Field and Other Crops Forage and Other Crops Vegetables Only Field Crops Only Forage Crops Only Figure 60. Do you have more problems with the above mentioned quality issues with untreated conventional seed or organic seed? 100% 80% 60% 40% 20% 0% I have more problems with organic seed. I have more problems with untreated conventional seed. Problems are about the same for both untreated conventional and organic seed. Growers produce: Vegetables and Other Crops Field and Other Crops Forage and Other Crops Vegetables Only Field Crops Only Forage Crops Only Figure 61.
- 22. State of Organic Seed Report 2010: Organic Seed Survey Results Figures 62 - 64. How strongly do you agree or disagree with the following statements: Seed companies should conduct testing and report rates of GE (GMO) contamination in organic seed. The regulatory framework in place is adequate to protect my organic farm product(s) from damages due to possible contamination by GE (GMO) crops. My organic farm product(s) are at risk from seed contaminated by GE (GMO) traits. 22 50% 40% 30% 20% 10% 0% Strongly disagree Disagree Neutral Agree Strongly agree Growers produce: Vegetables and Other Crops Field and Other Crops Forage and Other Crops Vegetables Only Field Crops Only Forage Crops Only Figure 62. 40% 35% 30% 25% 20% 15% 10% 5% 0% Strongly disagree Disagree Neutral Agree Strongly agree Growers produce: Vegetables Field Crops Forage Crops Vegetables Only Field Crops Only Forage Crops Only Figure 63. 35% 30% 25% 20% 15% 10% 5% 0% Strongly disagree Disagree Neutral Agree Strongly agree Growers produce: Vegetables Field Crops Forage Crops Vegetables Only Field Crops Only Forage Crops Only Figure 64.
- 23. State of Organic Seed Report 2010: Organic Seed Survey Results Comparison of increased organic seed use and certifier requesting more steps to source organic seed Organic seed use by crop type and acreage Percent of total acreage by Figure 67. crop planted with organic seed 23 Appendix B ± Additional Graphs 78% 22% 59% 41% 100% 80% 60% 40% 20% 0% Yes No Over the last three years have you increased the percentage of certified organic seed that you use? Certifier requested more steps to source organic seed Certifier did not request more steps Figure 65. 100 80 60 40 20 0 0.01-3 4-10 11-50 51-80 81-160 161-480 >480 Percent organic seed used Organic acreage Vegetables Field Crops Forage Crops Figure 66. 29 70 54 63 Vegetables Field Crops Forage Crops Overall Percent organic seed used
- 24. State of Organic Seed Report 2010: Organic Seed Survey Results Reasons rated moderate to significant for not purchasing organic seed in the past 24 100% 80% 60% 40% 20% 0% Lack of seed treatments such as pelleting or priming Buyer demands varieties not available organically Insufficient quantity of seed Save my own seed Distrust of organic seed quality Price Specific variety not available Lack of desirable genetic traits Seed sizing Other Growers with > 40 acres of vegetables and < 30% organic seed for those acres All vegetable growers Figure 68.