Sci 680 smart air quality sensor
•
0 gefällt mir•318 views

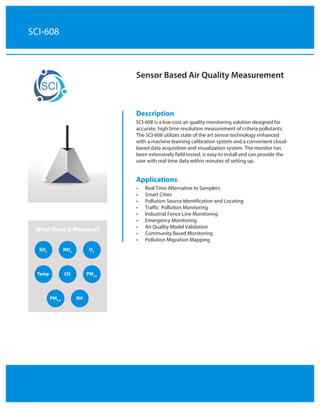
Sailbri Cooper’s SCI-608 is a low cost air quality monitoring solution designed for accurate highly time resolved measurement of criteria pollutant levels. The SCI -608 utilizes state of the art sensor technology enhanced with a machine learning calibration system and a convenient cloud-based data acquisition and visualization system. The monitor has been extensively field tested, is easy to install and can provide the user with real time data within minutes of setting up.

Empfohlen
Empfohlen
Weitere ähnliche Inhalte
Was ist angesagt?
Was ist angesagt? (19)
Ähnlich wie Sci 680 smart air quality sensor
Ähnlich wie Sci 680 smart air quality sensor (20)
Mehr von European Tech Serv
Mehr von European Tech Serv (20)
Kürzlich hochgeladen
Kürzlich hochgeladen (20)
Sci 680 smart air quality sensor
- 1. SCI-608 Sensor Based Air Quality Measurement Description SCI-608 is a low-cost air quality monitoring solution designed for accurate, high time resolution measurement of criteria pollutants. The SCI-608 utilizes state of the art sensor technology enhanced with a machine learning calibration system and a convenient cloud- based data acquisition and visualization system. The monitor has been extensively field tested, is easy to install and can provide the user with real time data within minutes of setting up. Applications • Real Time Alternative to Samplers • Smart Cities • Pollution Source Identification and Locating • Traffic Pollution Monitoring • Industrial Fence Line Monitoring • Emergency Monitoring • Air Quality Model Validation • Community Based Monitoring • Pollution Migration Mapping What Does It Measure? SO2 Temp PM2.5 NO2 CO RH O3 PM10
- 2. Specifications Measurement Performance Pollutant Detection Principle Units Range Detection Limit Resolution SO2 Electrochemical Sensor ppb 0 ~ 500 5 0.01 NO2 ppb 0 ~ 500 5 0.01 CO ppm 0 ~ 50 0.05 0.01 O3 ppb 0 ~ 500 5 0.01 PM10 Light Scattering µg/m3 0 ~ 1000 5 1 PM2.5 µg/m3 0 ~ 1000 5 1 Power Supply DC 12V, Solar Power Consumption Less than 3 watts Operating Temperature Range -20 to 55 oC Atmospheric Pressure 645 to 795 mmHg Relative Humidity 15 to 90% Communication GPRS (2G/3G/4G), RS232 Size 220 x 220 x 300 mm Weight 2.6 kg (5.75 lbs) Software Cloud: For instrument and data management. Runs on secure servers accessed via web browser Mounting Pole Mounting Bracket Included
- 3. Sensor Quality Control Sensor instruments have a rigorous three stage quality assurance and calibration process. In the first stage each individual sensor is challenged with standard gases to screen out low performing sensors. The second stage involves generating calibration files unique to each sensor unit using a custom machine learning algorithm and the sensor’s response to complex pollutant mixtures, varying temperature and varying humidity in a controlled test chamber. Once in the field, sensors can be periodically recalibrated with neural networking algorithms to improve sensor response to complex ambient conditions. This cloudbased calibration can be done automatically during field deployment using existing reference method monitors or with portable instruments. Stage 1: Sensor Selection Stage 2. Sensor Instrument Factory Calibration Stage 3. Field Calibration CO,SO 2 TEMPERATURE HUMIDITY
- 4. Accuracy Sensors have demonstrated excellent correlation with reference method sensors with correlation coefficients as folows: CO = 0.97, NO2 = 0.93, O3 = 0.975, SO2 = 0.89, PM2.5 = 0.96, PM10 = 0.8 Data Visualization Platform Sensor data is uploaded to the cloud and data can be visualized using a number of useful graphics that turn sensor data into useful information. Data can be accessed via the internet or with an app on your mobile device. SCI 9403 SW Nimbus Ave. Beaverton, OR 97008 T: 503-670-8127 F: 503-624-2120 www.SCI-Monitoring.com