The Natural Logarithm and beach litter
•
2 gefällt mir•911 views

How does shoreline litter density compare between Switzerland, England, Portugal Denmark and Belgium ? Analysis of 210 beach litter surveys from six countries.

Empfohlen
Empfohlen
Weitere ähnliche Inhalte
Ähnlich wie The Natural Logarithm and beach litter
Ähnlich wie The Natural Logarithm and beach litter (20)
Mehr von Roger Erismann
Mehr von Roger Erismann (9)
Kürzlich hochgeladen
Kürzlich hochgeladen (20)
The Natural Logarithm and beach litter
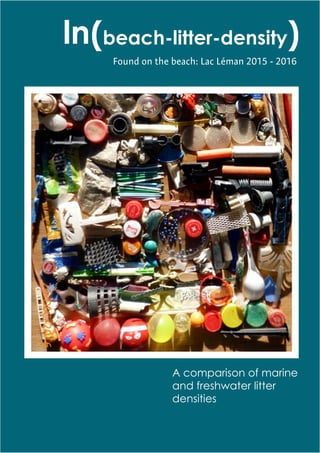
- 1. Found on the beach: Lac Léman 2015 - 2016 A comparison of marine and freshwater litter densities (beach-litter-density)ln
- 2. Table of contents Introduction Situation map Beach litter survey results for Lac Léman Density and composition Transport methods Results from other organisations and student groups Density distribution OSPAR and Lac Léman Density and composition OSPAR and Lac Léman Discussion and Conclusion Limitations and recomendations Links to references and supporting documents • OSPAR: Oslo - Paris convention for the Protection of the Marine Environment of the North- East Atlantic. The convention has been signed and ratified by Switzerland. • MLW: Marine Litter Watch combines citizen engagement and modern technology to help tackle marine litter. • MSFD: Marine Strategy Framework Directive aims to achieve Good Environmental Status (GES) of the EU’s marine waters by 2020 and to protect the resource base upon which ma- rine-related economic and social activities depend. • Beach litter survey: a uniform way of monitoring shoreline litter. Litter is removed from the shoreline, categorized according to a standardized list and counted. The length and loca- tion of the shoreline are noted. • Standard unit: one meter of shoreline. • Density: pieces of trash per meter of shoreline • pcs/m: pieces of trash per meter of shoreline • hammerdirt: The association that started the MCBP series of projects • MCBP: Montreux Clean Beach Project, a series of hammerdirt projects that removes, identi- fies and quantifies aquatic pollutants. • Lac Léman: Lake Geneva • Log-normal: A probability distribution of a random variable whose logarithm is normally distributed. Useful acronyms and definitions: Marine litter starts upstream, that’s where it needs to end. hammerdirt 2017 For a description of the method, analysis of the survey results for Lac Léman and the bibliography. Please see annexb. Includes: • History of MCBP • Other Organizations • Legal frame work • Method • Detailed map • In depth analysis • Regression results • Works cited Opens separate document
- 3. Purpose: identify and quantify the visible pollutants present on the shores of Lac Léman and compare those results to exist- ing data sets from other regions in europe. Objective: advance the concept of “shoreline litter density” as a metric or module in the ap- preciation of Swiss lakes and to identify key opportunities for anti-litter campaigns and infra- structure improvements. Conflict of interest: hammerdirt has received no financial assis- tance from any agency, institu- tion or individual for this project. Shoreline litter density on Lac Léman: A litter density comparison between the shores of Lac Léman and the coasts of France, Denmark, England, Portugal and Belgium. Authors: Erismann, Roger Erismann, Shannon info@hammerdirt.ch October 2016: Sorting beach litter debris from St Sulpice with students from the EPFL Beach litter surveys were conducted at various lo- cations on Lac Léman , Switzerland from November 2015 to November 2016. The hammerdirt association used the Marine Litter Watch (MLW) classification system to categorize over 30’000 items identified in 89 beach litter surveys from 17 loca- tions. Only surveys with a minimum shoreline length of 5 meters and situated directly on the lake-shore were kept for analysis. The resulting eighty samples and 27’790 pieces of trash were con- verted to units of “pieces of trash per meter” (pcs/m). The total density and density of key items for each location on the lake- shore was calculated and compared. Similarities were noted in the relative proportions of certain key items at all locations. The total density and densities of the most common items were regressed against Rhone discharge rates, precipitation rates and days-between-surveys. Statistically significant results were found for total density, Q-tips and plastic-construction-material when the 72hour Rhone discharge rate was considered.(annex b has the full analysis) OSPAR and MLW are the most well known marine debris da- tabases in Europe. Designed as a tool to measure the load of marine debris in coastal environments both programs are mon- itored by intergovernmental organizations and are based on simple protocols. MCBP2 was based on theses two programs. Sorted by location and density, the results from Lac Léman were compared to MLW results for 2016 and 130 OSPAR sur- veys from France, England, Denmark, Portugal and Belgium. The regions and countries were chosen at random. Similarities between the three sample groups were noted in both the distri- bution of total density and percent composition of key items. Two case studies are presented that propose the use of beach-litter survey data to define the problem on a local level and identify the root cause of changes in beach-litter density. Usage: Anybody who wants to know more about aquatic-litter and how they can help stop it. “Marine litter (marine debris) is any persistent, manufactured or processed solid material discarded, disposed of, abandoned or lost in the marine and coastal environment. This also includes such items entering the marine envi- ronment via rivers, sewage outlets, storm water outlets or winds.” OSPAR guidelines 2010 “The greatest sources of marine litter are land-based activities, including waste from dumping sites near the coast or up- stream along river-banks…” United Nations Environmental Program
- 4. © swisstopo www.geo.admin.ch est un portail d'accès aux informations géolocalisées, données et services qui sont mis à disposition par l'administration fédérale Responsabilité: Malgré la grande attention qu’elles portent à la justesse des informations diffusées sur ce site, les autorités fédérales ne peuvent endosser aucune responsabilité quant à la fidélité, à l’exactitude, à l’actualité, à la fiabilité et à l’intégralité de ces informations. Droits d'auteur: autorités de la Confédération suisse. http://www.disclaimer.admin.ch/informations_juridiques.html 6km420 Echelle 1: 300,000 Imprimé le 10.10.2016 19:46 https://s.geo.admin.ch/6edb0e8211 1 2 3 4 5 6 78 910 11 12 13 14 15 Beach litter surveys Lac Léman Nov 2015 - Nov 2016 Boiron • # of surveys: 1 • # of pieces: 402 • Average density: 3.27 • # of MLW categories: 32 • Length: 123m Thonon-les-Bains • # of surveys: 1 • # of pieces: 194 • Average density: 4.04 • # of MLW categories: 34 • Length: 48 Villa Barton • # of surveys: 9 • Total number of pieces: 1’231 • Average density: 9.77 • #of MLW categories: 51 • Length: 14m Jardin Botanique • # of surveys: 3 • # of pieces: 1’659 • Average density: 8.64 • # of MLW categories: 53 • Length 64m Versoix • # of surveys: 1 • # of pieces: 1’490 • Average density: 10.41 • Length: 143m 1 2 3 4 15 Baye de Montreux droite • # of surveys: 15 • # of pieces: 5’077 • Average density: 5.45 • Density max: 14.49 • Density min: 1.56 • # of MLW categories: 64 • Length: 61 Baye de Clarens • # of surveys:13 • Total number of pieces: 2’968 • Average density: 3.31 • Density max: 8.41 • Density min: 0.68 • # of MLW categories: 67 • Length: 69m Baye de Montreux gauche • # of surveys: 11 • # of pieces: 3’098 • Average density: 4.62 • Density max: 8.38 • Density min: 1.23 • # of MLW categories: 67 • Length: 61 Pierrier sud • # of surveys: 1 • Total number of pieces: 633 • Average density: 39.56 • # of MLW categories: 28 • Length: 16 Pierrier • # of surveys: 3 • # of pieces: 2’697 • Average density: 17.63 • Density max: 26.78 • Density min: 11.31 • # of MLW categories: 60 • Length: 51 Veveyse • # of surveys: 13 • # of pieces: 2’345 • Average density: 3.40 • Density max: 5.8 • Denisty min: 0.98 • # of MLW categories: 67 • Length: 53m Maladaire • # of surveys: 2 • #of pieces: 1’437 • Average density: 11.975 • Density max : 12.21 • Density min: 11.73 • # of MLW categories: 46 • Length: 60 Bain des Dames • # of surveys: 1 • # of pieces: 594 • Average density: 34.94 • # of MLW categories: 33 • Length: 17m Oyonne • # of surveys: 1 • # of pieces: 717 • Average density: 22.41 • # of MLW categories: 44 • Length: 32m Port, La Tour-de-Peilz • # of surveys: 1 • # of pieces: 570 • Average density: 33.52 • # of MLW categories: 26 • Length: 17 Arabie • # of surveys: 3 • # of pieces: 3’154 • Average density: 26.28 • # of MLW categories: 55 • Length: 40m St. Gingolph • # of surveys: 1 • # of pieces: 1’159 • Average density: 41.39 • # of MLW categories: 58 • Length : 28 Vidy • # of surveys: 1 • # of pieces: 55 • Average density: 6.88 • # of MLW categories: 16 • Length: 8m St Sulpice • # of surveys: 2 • # of pieces: 2’ 721 • Average density: 21.3 • # of MLW categories: 35 • Length: 72 5 6 7 8 1313 12 12 11 9 10 12 10 14 Survey Locations The majority of the beach litter surveys come from the Vevey-Montreux area, home to the hammerdirt association. The Baye de Clarens, the Baye de Montreux and the Veveyse were surveyed 52 times during MCBP2. Geographically the region of Vevey-Montreux has multiple pressures in re- gard to aquatic litter: • The mouth of the Rhone is only 6km away • The Stockalper and Eau Froide canals empty into the lake • Three rivers that cross urban and semi-urban landscapes • Densely populated The locations outside of the Vevey-Montreux area were chosen based on availability or by request from other groups, like St Sulpice or St Gingolph.
- 5. 21%: Expanded polystyrene 20.7%: Cigarette butts 12.4%: Plastic fragments 6.1%: Snack wrappers 4.5%: Cotton swabs Plastic sheeting and films: 4.3% 2.7%: Broken glass Plastic caps from drinks: 2.1% 1.80%: Paper fragments Waste from construction: 1.8% 1.5%: Shotgun cartridges Metal bottle caps: 1.5% 1.1%: Pieces of metal < 50cm Plastic rings from bottle caps: 1.3% 1.4%: Plastic lids - type unknown: 14.7%: Everything else Drinking straws - drink stirrers : 1.1% Chart 1 displays the 16 MLW categories that are equal to 1% or more of the total number of objects found during MCBP2. 16 categories = 85% of total Expanded polystyrene and ciga- rette butts are present in almost equal values, together these two objects represent 42% of the litter on the shoreline. Chart 1: Percent composition of Lac Léman beach litter by MLW categories. All items that are equal to or greater than 1% of the total quantity. n = 27’790 items collected Like the ocean, the debris on the shoreline of the lake is mostly plastic. Chart 1 displays the percentage composition of all the objects found during MCBP2, objects that were greater than or equal to 1% of the total (27’790) were singled out. Table 1 summarizes the material composition of the debris removed from the Lac Léman shoreline and the current MLW results for 2016. Although 88% of the total is plastic, there are many varieties of plastic included in that group, ranging from candy wrappers to shotgun shells (see chart 1). There are 16 MLW categories that comprise 85% of the total debris found on the lake-shore (chart 1). The most common categories identified during the MCBP2 surveys are also among the most common items in the 2016 results from Marine Litter Watch Chart two compares the percent composition of ten key items in the MLW results and the MCBP2 results. The same items occupy a greater percentage of the total in the MCBP2 results. (chart 2) Table 1: Material composition of beach litter surveys Lac Léman / Marine Litter Watch. LacLéman MLW Plastic 88.1% 91.3% Metal 4.3% 3.6% Glass 2.9% 2.0% Paper 2.9% 0.1% Rubber 0.7% 0.3% Wood 0.5% 0.5% Cloth tex- tile 0.2% 2.6% Parafin 0.1% N/A MCBP2 Beach litter survey results Beach litter composition Expanded polystyrene Cigarette butts Plastic Fragments Snack Wrappers Cotton swabs Broken glass Plastic caps from drinks Shotgun cartridge Pieces of metal < 50cm Drinking straws and stirrers Everything else 20% 0% 40% 60% 80% 100% Lac Léman: MCBP2 beach litter survey results. Marine Litter Watch: beach litter survey results 2016. Chart 2: Beach litter composition: MCBP2 and MLW 2016 results. 88% plastic
- 6. St.Gingolph PierrierSud BaindesDames LePort,LaTour-de-Peilz Arabie Oyonne Pierrier Maladaire VillaBarton JardinBotanique Vidy Montreuxdroite Montreuxgauche Thonon Veveyse BayedeClarens Boiron Density and Composition MCBP2 Piecesoftrashpermeterofshoreline,LacLémanNov2015-Sep2016-n=80 Expanded polystyrene Cigarette butts Plastic Fragments Snack Wrappers Cotton swabs Plastic sheeting and films Broken glass Plastic caps from drinks Paper fragments Construction waste Shotgun cartridge Metal bottle caps Platic lids - type unknown Plastic rings from caps Pieces of metal < 50cm Drinking straws and stirrers Everything else Weighted average of density: 8.44 pcs/m Density range : 0.68 - 50.1 pcs/m Density distribution : • 70% of density values between 2.18 - 13.48 pcs/m • Log-normal distribution where μ= 1.689, σ = 0.912 Chart 3: average density of beach litter and top 16 items by location in descending order of density. n=80 surveys and 17 locations Expanded polystyrene Cigarette butts Plastic Fragments Snack Wrappers Cotton swabs Plastic sheeting and films Broken glass Plastic caps from drinks Paper fragments Construction waste Shotgun cartridge Metal bottle caps Platic lids - type unknown Plastic rings from caps Pieces of metal < 50cm Drinking straws and stirrers 47% Likely transported to the location by wind, rain or lake currents : Expanded polystyrene Cigarette butts Plastic Fragments Snack Wrappers Cotton swabs Plastic sheeting and films Broken glass Plastic caps from drinks Paper fragments Construction waste Shotgun cartridge Metal bottle caps Platic lids - type unknown Plastic rings from caps Pieces of metal < 50cm Drinking straws and stirrers 35% Likeley left by visitors: 20% 60% 80% 100% 40% Chart 4: percent composition of beach litter at each location, Lac Léman 2015-2016 The average density and composition of the beach litter for all locations is presented in chart 3. Using chart 1 as a model, the same filter was applied to the results for each location. Even at smaller density values the relationship of the key items to total density remains within a certain range. Chart 4 compares the percent composition of objects between all survey locations. Although the densities of individual items varies per location, the category “everything else” stays within a fairly small range. 0510152025303540 St.Gingolph PierrierSud BaindesDames LePort,LaTour-de-Peilz Arabie Oyonne Pierrier Maladaire VillaBarton JardinBotanique Vidy Montreuxdroite Montreuxgauche Thonon Veveyse BayedeClarens Boiron 0%
- 7. 191 pieces or 0.01% of total. Bio filters Bio filters are used in the water treatment process. They arrived in two waves first from the Rhone in 2012 (round type) and then from St Prex in 2013 (square type). Iden- tified in 41 out of 80 surveys, the Oyonne is the only loca- tion where no Bio filters were identified. Read the full report from the local chapter of Surfrider Foun- dation. Plastic-pellets / GPI Found at all locations, dark blue is the common color. Plastic resin pellets are the raw material for the fabrica- tion of plastic articles. Pellets range from barrel shaped to disc shaped and measure 2 to 5mm. Identified as a transport me- dium of toxic chemicals in the marine environment by In- ternational Pellet Watch. GPI accumulate chemicals such as PCB, DDT and Nonylphenol. http://www.pelletwatch.org/ 1260 pieces or 4.5% of total. Cotton swabs Cotton-swabs are found at all locations, the maximum is 6.75 pcs/m (Pierrier Sud). Cotton swabs are a global problem and are found on beaches all over Europe. Water treatment plants are not designed for this type of ma- terial, thus cotton swabs are released into the environment on a regular basis. 1’214 pieces or 4.34% of total. Plastic film is found through- out the lake in various states of decomposition. The most common type found is a heavy gauge plastic similar to the sheeting used to protect objects out of doors from the elements. 5’876 pieces or 20.9% of total. The most common item found on the lake-shore. Used in the construction, manufacturing and packaging industries, EP quickly fragments into pieces 1-2mm in diameter. 433 pieces or 1.5% of total. Shotgun wadding is found on the beach all over the globe, Plastic sheeting and films Shotgun shellsExpanded polystyrene (Ep) 0 15 20 25 35 40 45 50 55 Boiron JardinBotanique StGingolph StSulpice Arabie Thonnon BayedeClarens VillaBarton Maladaire BayedeClarens Veveyse Montreuxgauche Montreuxdroite Pierrier AnthysurLeman BaindesDames Allaman Oyonne Versoix 10 5 30 Vidy LePort,LaTour Litter survey results from other organizations Chart 5: Maximum density per location Lac Léman - comparison of MCBP2 results with results from other associations and student groups in the region. Sol à Tous Surfrider Lac Léman Ecole Polytechnique Fédérale International School of Geneva November 2015 - November 2016 n=87, unts = pieces/meter of shoreline. There are two other associations that do beach-litter surveys on the lake : Surfrider Léman and Sol à tous. They do not share the data with other organizations, however the total pieces collected per survey are posted on social media. Students from the “Solid Waste Engineering” class at the EPFL and elementary school students from the international school of Geneva, assisted by hammerdirt staff, completed beach litter surveys in St. Sulpice and Versoix. (Annex B for details) Chart five puts the results from these surveys in relation to the results from MCBP2 Rhone discharge rate = m 3 /sec Density of trash on the beach Num ber of Q-tips on the beach Transport methods A large portion of beach-litter is transported to the location where it is found. The Rhone and tributar- ies are the main water sources for the lake and increases in the discharge rate of the Rhone corre- sponds with trash density increases in the Montreux region. See Annex B. Pieces per meter of shoreline MCBP2 Items in Lac Léman that are found along European shores
- 8. Beach litter survey results from other countries Distribution of density values : OSPAR and MCBP2 Like the MCBP2, OSPAR data is collected under similar conditions and by similar groups of people: volunteers actively engaged in monitoring shore- line litter and following a protocol. 2015 marine litter survey results from the United Kingdom, France, Belgium, Denmark and Portugal were compared to the results from the MCBP2. Chosen randomly, the OSPAR 100m survey results from those five countries represent 130 surveys from 38 different locations. The greatest concen- tration of surveys comes from the United Kingdom and Portugal. The summary data for the two sample sets can be found in table two. MCBP was modified from the OSPAR proto- col in three very specific ways: 1. Objects are categorized according to MLW categories The MLW categorization system is more de- tailed than OSPAR, for example in the MLW system plastic lids are separated into three categories instead of one for OSPAR. This does not effect the total number of pieces per length of shoreline and permits a more thorough analysis of root causes and origin of beach litter debris. 2. The minimum shoreline value is 5m The recommended minimum shoreline value in OSPAR is 100m of sandy or grav- el beaches. On Lac Léman there are few beaches that are 100m or greater, in order to increase the amount of surveys and va- riety of locations the minimum length was adjusted to the topography of the region. MCBP2 OSPAR 27’790 # of pieces 74’155 80 # of surveys 132 17 # of locations 38 8.44 Density weighted average (location) 6.89 8.46 Density non weighted average 6.03 50.10 Maximum density 89.31 0.68 Minimum density 0.02 17.5 90th percentile 15.81 -5 -3 -1 1 3 5 OSPAR : µ= 0.833,σ=1.494 MCBP2:µ=1.689,σ=0.91 Frequencyofresults FrequencyofresultsFrequencyofresults ln(density) Chart 8: probability density function of ln(density) OSPAR/MCBP2 OSPAR surveys n=130, lac Léman surveys n=80 Table 2: Key figures MCBP2/OSPAR The MCBP2 data can be down- loaded from here. The OSPAR data can be down- loaded from here: For a complete list of survey loca- tions and dates see annex a 3. The standard unit is one meter of shoreline For OSPAR surveys the standard unit is 100m of shoreline because the minimum length is 100m. The variety of shoreline lengths in MCBP2 requires a smaller standard unit (to incorporate surveys of less than 100m). Converting OSPAR densities from values per 100m to 1m is straight forward and allows a direct com- parison of the distribution of values from MCBP2. The histgrams of both distributions are positively skewed, chart 6 and 7. The distribution of beach-litter density values is log-normal for both sample sets (MCBP2 and OSPAR). This property is typical for many types of data, including environmental data. Once the natural logarithm of the density values for both sample sets is taken and the Probability Den- sity Function (PDF) is graphed, chart 8, the relation- ship between the two sample sets is more evident. The Z-test of sample means, greater than 5, con- firms the difference between the OSPAR samples and the MCBP2 samples. This result holds true wether the natural log is used or the the geomtric mean. (0.68,8.58] (48.08,55.98] (32.28,40.18] (40.18,48.08] (24.38,32.28] (16.48,24.38] (8.58,16.48] 0 20 40 60 100 120 80 [0.02,7.92] (86.92,94.82] (79.02,86.92] (71.12,79.02] (63.22,71.12] (55.32,63.22] 0 40 60 100 120 80 (7.92,15.82] (15.82,23.72] (23.72,31.62] (31.62,39.52] (39.52,47.42] (47.42,55.32] 20 Chart 6: Histogram of density values MCBP2, n=80 Density : pieces/meter Density : pieces/meter Chart 7: Histogram of density values OSPAR, n=130 μ*= 5.42 σ*= 2.49 μ*= 2.3 σ*= 4.45
- 9. Discussion: The data presented is a comparison of samples taken by volunteers in six countries in Europe. The volunteers were all trained, either as part of the OSPAR program or as a member of the hammerdirt association. The notable difference between the sample sets is the absence of commercial fishing gear and other nautical equipment in the Lac Léman surveys, these items are identified regularly in the OSPAR and MLW surveys. The density distributions are both positively skewed and log-normal. This type of distribution is common with data that has a minimum value of zero (no negative densities), low average values and large variance. The histograms of both the OSPAR and MCBP2 sample sets display these characteristics. The distribution of values from the MCBP2 are within the range of the OSPAR data both in total density and density of key components. The results from other groups on the lake following the OSPAR protocol produce values that are within the distribution of the MCBP2 results (and by default within the OSPAR distribution). When using the hammerdirt protocol elementary school and university students also reported values that are within the distribution of MCBP2 results. The composition of Lac Léman trash can be characterized by the relative proportions of 16 key items. The key items from Lac Léman have a greater proportion of total density than the same items from the MLW or OSPAR surveys. According to the report published by the EPFL in 2014 there is a higher density of suspended micro-plastics in the lake when compared to the ocean. These particles likely come from the fragmentation of larger objects primarily expanded polystyrene (Styrofoam) and plastic wrapping. The findings from MCBP2 confirm both the elevated total density and the proportion of expanded polystyrene, fragmented plastic and wrappers to total density. Conclusion: The density and composition of litter along the shores of Lake Geneva is similar to the litter found in marine environments of Western Europe. The presence of the same items at different locations and in similar proportions (relative to total density) indicate a common origin for many of the key items found along the lake. The density of suspended anthropogenic debris in Lac Léman resembles that of the ocean: areas that are severely affected by debris accumulation and areas that are less affected. However, there are no unaffected regions. The shift to the right of the probability density function of ln(density) for the MCBP2 results (chart 8) and the greater concentration of key items when compared to the marine environment (chart 2 and 9) indicate that there is a higher probability of having an elevated density value on Lac Léman as opposed to the OSPAR sample group. The Z-test of sample means, greater than 5, suggestst that the null hypothesis can be rejected (h0 : The distribution of beach-litter density values is less on Lac Léman) and that the density of shoreline trash on Lac Léman is elevated when compared to the OSPAR sample group. The results from St Sulpice, Allaman and Anthy-sur-Léman (beach-litter-survey results from non-affilitaed organisations) suggest that the density in the Haut-Lac maybe lower than other regions. The initiative by Surfrider Léman and Sol à tous is welcome, the density values from those surveys are an independent voice to our data, hopefully they will continue. Chart 9: average densities per location in descending order. Comparing 16 of the most densely polluted OSPAR beaches from the sample group to 16 locations from Lac Léman*. OSPAR, n= 66 surveys and 16 locations; MCBP2, n= 80 surveys and 16 locations 50 40 30 20 10 0 Polhawn SkagenStrand StGingolph Pierriersud Baindesdames Port,Tour-de-Peilz Arabie CrammonBeach SandBay Pierrier JubileeBeach Amoeiras Maladaire Lunderstonbay VillaBarton KilkeelNorth JardinBotanique FontedeTelha MonteVelho Vidy LeBrayeSlip OssodaBaleia Felixstowe Koubou Rottingdean BayedeMontreux RobinHoodsBay ThonnonlesBains Veveyse BayedeClarens Boiron Oyonne * * * * * * * * * * * * * ** * Polystyrene and plastic pieces Cigarette butts Cotton swabs Plastic sheeting and films Plastic caps all types Shotgun cartridge Everything else Lac Léman * PiecesoftrashpermeterofshorelineDensity and composition: OSPAR and MCBP2 The OSPAR sample set was sorted by average density per location in descending order. The top sixteen locations were compared to the average density per location of MCBP2 sam- ples. The comparison includes the converted values for the key items from chart 1 and 2 common to both MLW and OSPAR surveys. Chart 9 sum- marizes the results. Like the MLW comparison, the beach litter com- position of OSPAR and MCBP2 are similar. In the MCBP2 results the proportion of density attribut- ed to key items is greater than the OSPAR results. See annex a for the list of locations and densities, how items were classified and how densities were converted. “The plastics (microplastics) mainly come from the fragmentation of bigger objects, packaging is a good part, but we also find an important quantity of foam, probably from construction activities.” Florian Faure, Dr. Felippe de Alencastro, Ecole Polytechnique Féderale Lausanne - 2014
- 10. Limitations of this study: The data collection is repetitive and requires a certain amount of physical effort, the categorization of objects is tedious, subjective and could be de- scribed as “déplaisante” or “unpleasant”. Litter collection happens along the lake therefore weath- er and seasonal changes may influence collection and sorting for example; the shore may be snow covered or waves may limit site exposure. Logistically it is not feasible to keep samples, limiting the opportunities to do recounts to evaluate categorization variances between volunteers. Improving this study: The study would benefit from a greater diversity in locations and more regular surveys (once a week or once month). A real university partnership either in data vi- sualization/modeling or data analysis would allow for more and varied interpretations of the data. Partnerships with civil or mechanical engineering groups could help evolve the surveys in a di- rection that supports product development (filtration techniques, urban hydrology, storm water catchment) Next steps for hammerdirt: Continue to monitor and conduct surveys, over time the combined data will open up the possibility of time series analysis. Other projects that compliment the MCBP series: 1. Development of density map of beach litter on Lac Léman 2. Construction of DIY water monitor 3. Plan MCBP3 Recommendations : There are several action plans in existence for marine environments. Initially education and out- reach should be focused on educating groups and organizations with a direct stake in the health of the lake. 1. Develop a common data set for the region with a standardized protocol. Encourage groups with a shared interest to participate, for example rowing clubs, fishing clubs or elementary schools, scout troops or lifeguard groups. Invite the industrial and commercial sectors to partic- ipate. 2. Integrate the beach-litter data into environmental assessments by including beach-litter-densi- ty in the system of “Appreciation and analysis of Swiss lakes” and the “National Survey of Swiss Waterways”. The presence of solid waste was noted in the last published survey of Swiss wa- terways. Adding a module to the appreciation system based on observations from previous studies is a reasonable response. 3. Treat this as a regional or national problem. The effects and solutions are multiplicative ( like the standard deviation and the geometric mean of log-normal distributions), the changes or efforts of one commune would be difficult to measure. Solutions need to be implemented on the scale of the water shed, not communal or cantonal boundaries. 4. Develop a preventive communication strategy that targets the objects found in the lake. 5. Create a common funding scheme or partnership so communities in the basin have access to resources necessary to prevent aquatic litter. 6. Facilitate and simplify the marking of storm-water drains throughout the basin. Use simple measures like stencils and non toxic paint combined with art designed by students in the re- gion. These activities go along way to raising awareness and encouraging participation. 7. Enforce existing littering and pollution laws. Fines and penalties of individuals and industries may fund clean up efforts and deter flagrant pollution tendencies.
- 11. This is a hammerdirt publication Somebody needs to do this Links to annexes and references Annexes Annex a : Converting data for this report, list of all beach litter surveys used in the report Annex b: Methods, background, Swiss law and aquatic litter, full analysis, regres- sion results and references Case Studies Chez Mme. Michelet: One resident tries to reason with local and state officials about the systematic pollution of her lakeside property. A case study based on correspondences and an evaluation of beach litter composition. The Jazz Effect: How much does the Montreux Jazz festival contribute to beach litter density and what does the city of Montreux do to prevent it. Data All the data used for this report hammerdirt association 2017 all rights reserved