OneStream Studio BI report package
•
0 gefällt mir•417 views

Board Meeting Report Package by www.epmcpa.com.

Empfohlen
Weitere ähnliche Inhalte
Was ist angesagt?
Was ist angesagt? (19)
Ähnlich wie OneStream Studio BI report package
Ähnlich wie OneStream Studio BI report package (20)
Kürzlich hochgeladen
Kürzlich hochgeladen (20)
OneStream Studio BI report package
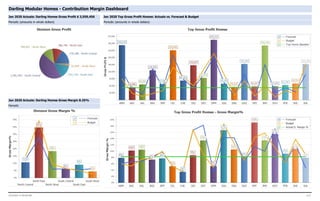
- 1. Darling Modular Homes - Contribution Margin Dashboard Jan 2020 Top Gross Profit Homes: Actuals vs. Forecast & Budget Periodic (amounts in whole dollars) Jan 2020 Actuals: Darling Homes Gross Profit $ 3,559,456 Periodic (amounts in whole dollars) Periodic Jan 2020 Actuals: Darling Homes Gross Margin 8.25% 2/2/2020 11:49:09 AM 1/111/11
- 2. South Central - Top Gross Profit Homes: Actuals vs. Forecast & Budget Periodic (amounts in whole dollars) Jan 2020: South Central Actuals Gross Profit $ $1,581,403 Jan 2020: South Central Periodic Gross Profit $ Home Model Actuals Rank Actuals Forecast Fcst Fav Unfav Variance Budget Bud Fav Unfav Variance DPM 1 242,683 198,648 44,034 182,342 60,340 CEL 2 210,463 189,681 20,782 139,099 71,364 ABM 3 173,990 121,992 51,998 89,461 84,529 EVO 4 151,993 110,693 41,301 81,175 70,819 SHL 5 151,392 208,504 -57,112 152,903 -1,511 BAS 6 120,824 128,732 -7,907 94,403 26,421 CHE 7 82,236 88,958 -6,722 65,236 17,001 PFB 8 62,794 52,391 10,403 38,420 24,374 LIO 9 51,743 61,908 -10,165 45,399 6,344 GEL 10 51,029 65,000 -13,971 50,000 1,029 KIL 11 48,725 20,000 28,725 20,000 28,725 INT 12 45,973 51,047 -5,074 42,127 3,846 SAN 13 41,812 15,000 26,812 30,000 11,812 FMF 14 41,349 35,759 5,590 26,223 15,126 BPP 15 32,723 19,751 12,973 14,484 18,239 DEN 16 31,180 19,341 11,839 14,183 16,997 TXE 17 31,094 38,891 -7,797 28,520 2,574 2/2/2020 11:49:09 AM 2/112/11 w w w .epm cpa.com
- 3. Jan 2020: South Central Periodic Gross Profit $ Home Model Actuals Rank Actuals Forecast Fcst Fav Unfav Variance Budget Bud Fav Unfav Variance INE 18 29,241 9,660 19,581 7,084 22,157 EAS 19 21,109 28,274 -7,165 20,735 375 INV 20 17,052 31,809 -14,757 23,326 -6,275 SOL 21 16,981 14,553 2,428 10,672 6,309 VEO 22 10,922 9,702 1,220 7,115 3,807 EAT 23 8,757 2,957 5,800 2,168 6,588 CEM 24 6,799 33,858 -27,059 24,829 -18,030 ETH 25 5,738 5,738 5,738 AKZ 26 4,055 31,500 -27,445 23,100 -19,045 NNZ 27 49,500 -49,500 36,300 -36,300 WRG 28 11,193 -11,193 8,208 -8,208 SHE 29 59,846 -59,846 BOI 30 -8,107 5,498 -13,605 4,032 -12,139 BRA 31 -103,147 61,000 -164,147 35,000 -138,147 TOTAL South Central 1,581,403 1,715,798 -134,395 1,376,391 205,013 2/2/2020 11:49:09 AM 3/113/11 w w w .epm cpa.com
- 4. North Central - Top Gross Profit Homes: Actuals vs. Forecast & Budget Periodic (amounts in whole dollars) Jan 2020: North Central Actuals Gross Profit $ $579,186 Jan 2020: North Central Periodic Gross Profit $ Home Model Actuals Rank Actuals Forecast Fcst Fav Unfav Variance Budget Bud Fav Unfav Variance DEY 1 92,972 53,638 39,334 10,000 82,972 AXL 2 65,701 23,646 42,055 15,193 50,508 KOY 3 57,295 30,988 26,307 22,420 34,875 IMT 4 56,997 6,648 50,349 15,630 41,367 HON 5 49,280 22,149 27,131 29,745 19,535 TAL 6 33,030 38,932 -5,902 33,030 LEM 7 31,483 6,192 25,291 4,243 27,240 NOL 8 29,659 23,301 6,357 75,490 -45,831 CHZ 9 29,399 16,140 13,259 14,378 15,021 HUT 10 16,063 37,750 -21,686 35,166 -19,102 CHS 11 13,563 3,053 10,510 6,051 7,512 CFF 12 12,951 30,988 -18,037 10,963 1,988 WRD 13 12,932 67 12,864 274 12,657 VEU 14 12,606 12,606 12,606 EXE 15 11,444 10,475 970 8,613 2,831 LOO 16 11,142 9,449 1,693 6,783 4,360 PCS 17 11,111 11,111 11,111 2/2/2020 11:49:09 AM 4/114/11 w w w .epm cpa.com
- 5. Jan 2020: North Central Periodic Gross Profit $ Home Model Actuals Rank Actuals Forecast Fcst Fav Unfav Variance Budget Bud Fav Unfav Variance PHI 18 10,439 10,766 -327 17,050 -6,611 ALB 19 8,860 22,981 -14,121 27,959 -19,099 SHH 20 8,765 8,765 16,972 -8,207 VAK 21 8,513 8,513 8,513 OCC 22 7,415 11,763 -4,348 7,415 TOT 23 6,857 9,228 -2,371 6,066 790 COO 24 6,321 69,775 -63,454 23,050 -16,729 ENT 25 5,324 777 4,547 971 4,353 AKB 26 5,058 5,058 5,058 MEN 27 3,954 3,954 3,954 MAS 28 3,691 3,691 3,691 SHV 29 3,604 3,604 3,604 ENL 30 3,242 3,242 3,242 STE 31 2,864 2,864 2,864 LON 32 2,555 2,555 2,555 SHJ 33 2,473 2,473 2,473 JOR 34 2,462 6,676 -4,215 2,462 BRE 35 2,148 2,148 2,148 VAL 36 1,822 1,822 5,053 -3,231 DIA 37 1,779 1,779 1,779 SCE 38 1,743 1,743 1,743 LOC 39 1,392 1,392 1,392 AIR 40 1,356 2,403 -1,047 3,388 -2,032 POW 41 1,268 1,268 1,268 GUL 42 1,075 1,075 1,075 CHJ 43 1,051 1,051 1,051 YUH 44 997 997 997 ORX 45 852 852 852 VAT 46 761 761 761 REI 47 747 747 747 BRV 48 741 741 741 BPD 49 629 9,033 -8,404 629 PLA 50 525 525 525 ERN 51 438 438 438 MEL 52 412 412 412 MAY 53 322 7,091 -6,769 322 LIN 54 300 300 300 HOL 55 270 281 -12 507 -237 MON 56 196 2,916 -2,720 5,172 -4,975 MSB 57 158 158 158 KMG 58 94 94 94 2/2/2020 11:49:09 AM 5/115/11 w w w .epm cpa.com
- 6. Jan 2020: North Central Periodic Gross Profit $ Home Model Actuals Rank Actuals Forecast Fcst Fav Unfav Variance Budget Bud Fav Unfav Variance TRI 59 84 84 84 UPL 60 25 25 25 WEN 61 2,472 -2,472 274 -274 TAK 62 25,458 -25,458 SHA 63 22,689 -22,689 RGG 64 4,766 -4,766 EQA 65 1,549 -1,549 565 -565 MEX 66 12,383 -12,383 8,486 -8,486 EQU 67 1,129 -1,129 LIT 68 6,192 -6,192 6,185 -6,185 FOR 69 12,920 -12,920 DEH 70 777 -777 971 -971 CHI 71 2,755 -2,755 BET 72 7,035 -7,035 5,256 -5,256 NNZ 73 48,375 -48,375 48,052 -48,052 VAC 74 -99 -99 -99 BRO 75 -150 -150 -150 BMB 76 -543 -543 -543 ALO 77 -916 -916 723 -1,639 MTX 78 -974 -974 -974 WKM 79 -79,347 -79,347 -79,347 TOTAL North Central 579,186 545,892 33,294 501,368 77,817 2/2/2020 11:49:09 AM 6/116/11 w w w .epm cpa.com
- 7. South East - Top Gross Profit Homes: Actuals vs. Forecast & Budget Periodic (amounts in whole dollars) Jan 2020: South East Actuals Gross Profit $ $551,178 Jan 2020: South East Periodic Gross Profit $ Home Model Actuals Rank Actuals Forecast Fcst Fav Unfav Variance Budget Bud Fav Unfav Variance JMS 1 230,744 150,000 80,744 60,000 170,744 DEJ 2 146,697 50,000 96,697 60,000 86,697 ABM 3 58,137 58,137 58,137 ENU 4 55,025 20,000 35,025 20,000 35,025 CEM 5 41,347 41,347 40,000 1,347 SHM 6 27,138 33,000 -5,862 30,000 -2,862 VER 7 10,093 10,093 10,093 EXY 8 5,326 35,250 -29,924 4,052 1,274 ENL 9 50,000 -50,000 75,000 -75,000 DEY 10 55,000 -55,000 35,000 -35,000 NNZ 11 WES 12 50,000 -50,000 40,000 -40,000 DPM 13 WET 14 -23,329 45,000 -68,329 40,000 -63,329 TOTAL South East 551,178 488,250 62,928 404,052 147,126 2/2/2020 11:49:09 AM 7/117/11 w w w .epm cpa.com
- 8. North West - Top Gross Profit Homes: Actuals vs. Forecast & Budget Periodic (amounts in whole dollars) Jan 2020: North West Actuals Gross Profit $ $399,091 Jan 2020: North West Periodic Gross Profit $ Home Model Actuals Rank Actuals Forecast Fcst Fav Unfav Variance Budget Bud Fav Unfav Variance SHC 1 69,550 33,341 36,209 27,783 41,767 EAS 2 47,900 45,000 2,900 55,000 -7,100 FMC 3 43,013 45,000 -1,987 40,000 3,013 NRG 4 38,007 38,000 7 45,000 -6,993 GRA 5 35,251 55,000 -19,749 40,000 -4,749 BPP 6 34,858 30,000 4,858 25,000 9,858 Bridger Logistics 7 31,930 31,930 31,930 MAT 8 25,005 28,500 -3,495 27,000 -1,995 Oxiteno 9 23,700 23,700 23,700 VEO 10 22,280 22,280 22,280 OVE 11 18,354 20,000 -1,646 20,000 -1,646 DOW 12 12,021 -18,513 30,534 74,424 -62,403 NNZ 13 34,653 -34,653 28,745 -28,745 UNI 14 -2,778 13,875 -16,653 10,175 -12,953 TOTAL North West 399,091 324,856 74,235 393,128 5,964 2/2/2020 11:49:09 AM 8/118/11 w w w .epm cpa.com
- 9. North East - Top Gross Profit Homes: Actuals vs. Forecast & Budget Periodic (amounts in whole dollars) Jan 2020: North East Actuals Gross Profit $ $386,749 Jan 2020: North East Periodic Gross Profit $ Home Model Actuals Rank Actuals Forecast Fcst Fav Unfav Variance Budget Bud Fav Unfav Variance UNI 1 54,223 75,000 -20,777 55,000 -777 IND 2 51,253 40,000 11,253 40,000 11,253 ENV 3 51,050 40,000 11,050 35,000 16,050 AKZ 4 50,025 15,000 35,025 5,000 45,025 UOP 5 41,259 30,000 11,259 40,000 1,259 ZHE 6 40,000 5,000 35,000 10,000 30,000 GAR 7 39,225 65,000 -25,775 45,000 -5,775 LAD 8 32,484 20,000 12,484 15,000 17,484 BOI 9 24,231 15,000 9,231 10,000 14,231 BRA 10 18,456 35,000 -16,544 85,000 -66,544 VOP 11 16,040 15,000 1,040 25,000 -8,960 DPM 12 12,589 -15,000 27,589 15,000 -2,411 BAS 13 5,052 5,000 52 5,000 52 NRG 14 5,042 10,000 -4,958 10,000 -4,958 KOY 15 -10,000 10,000 SHL 16 -100,000 100,000 KIL 17 -9,769 45,000 -54,769 70,000 -79,769 2/2/2020 11:49:09 AM 9/119/11 w w w .epm cpa.com
- 10. Jan 2020: North East Periodic Gross Profit $ Home Model Actuals Rank Actuals Forecast Fcst Fav Unfav Variance Budget Bud Fav Unfav Variance GEL 18 -44,411 30,000 -74,411 15,000 -59,411 TOTAL North East 386,749 330,000 56,749 470,000 -83,251 2/2/2020 11:49:09 AM 10/1110/11 w w w .epm cpa.com
- 11. South West - Top Gross Profit Homes: Actuals vs. Forecast & Budget Periodic (amounts in whole dollars) Jan 2020: South West Actuals Gross Profit $ $61,849 Jan 2020: South West Periodic Gross Profit $ Home Model Actuals Rank Actuals Forecast Fcst Fav Unfav Variance Budget Bud Fav Unfav Variance INB 1 46,112 50,000 -3,888 60,000 -13,888 NNZ 2 41,900 41,875 25 53,331 -11,431 BRA 3 28,737 30,000 -1,263 40,000 -11,263 ALO 4 1,000 1,000 1,000 BMB 5 500 500 500 HOL 6 500 500 500 VAC 7 100 100 100 CEM 8 -7,000 -7,000 -7,000 WET 9 -50,000 20,000 -70,000 25,000 -75,000 TOTAL South West 61,849 141,875 -80,026 178,331 -116,482 TOTAL Darling Modular Homes 3,559,456 3,546,671 12,785 3,323,269 236,186 2/2/2020 11:49:09 AM 11/1111/11 w w w .epm cpa.com