Call now : 9892124323 Nalasopara Beautiful Call Girls Vasai virar Best Call G...
Five days of kaizen
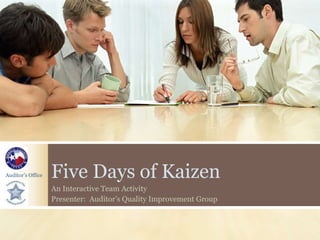
1. Auditor’s Office Five Days of Kaizen
An Interactive Team Activity
Presenter: Auditor’s Quality Improvement Group
2. Auditor’s
Office
An Introduction to Lean
Management in Local Government
Lifehacker Talks About Kaizen
YouTube Robots Animate a Kaizen
Discussion
Helpful Precursors
3. Auditor’s
Office
Day 1 (30 minutes): Introduction to Kaizen and the 5 wastes
Homework: Propose a process to be improved. Each team member must provide at least one.
Day 2 (30 minutes): Vote on a process. Identify the current
state artifacts needed and the team member responsible.
Homework: Gather the artifacts into the Kaizen Event site.
Day 3 (90 minutes): Evaluate the Current State. Document the
Future State.
Homework: Identify the 5 key metrics.
Day 4 (90 minutes): Identify what changes are required to
achieve the future state and expected changes in metrics.
Homework: Share with other colleagues and garner feedback.
Day 5 (60 minutes): Review the feedback, update the
implementation plan, and determine fit with ERP project
schedule.
Homework: Create an Executive Summary and compile the Improvement Report.
Agenda
4. Auditor’s
Office
4th grade kickball cleanup kicker.
7th grade dodgeball champion.
20 years of process improvement and program
strategy experience across ERP, IT infrastructure,
and systems/application development.
Active certifications in project management,
information security, IT service management, Agile
Scrum, and change management.
Joined the Harris County Auditor’s Office in August
2016.
Your Facilitator: Robert
Simmons
8. Auditor’s
Office
MUDA: Waste
MURI: Stress
MURA: Inconsistency
Kaizen in a Nutshell
A business
philosophy that
places focus on
improving the
“flow” of people,
materials, and
information.
Seeks to eliminate
the 3 MU’s.
9. Auditor’s
Office
There are 7
wastes in
Kaizen for
manufacturing.
For office
processing we
address 5,
which are also
merged with
the other two
“MU’s”.
The 5 Wastes of Kaizen
Motion: People, devices, data, or
material with unnecessary movement.
Over-Processing: Doing more work
than necessary without value.
Rework: Doing the same work again
due to errors or uncoordinated
activities.
Waiting: Idle resources unable to
produce value.
Variation: Multiple unique procedures
for a single given process step.
10. Auditor’s
Office
Also called a Burst, the idea is to isolate a
single improvement, determine an optimized
condition, plan the change, implement the
plan, and then measure the success.
To support this, we execute a rigorous
analysis of processes that follows a patterned
approach.
First, we must choose a process to analyze.
Kaizen Event
11. Auditor’s
Office
Prime the Pump: let’s identify 5 processes
right here.
Email to me at least one more process, each.
I’ll compile the list and we’ll use that for our
day 2 voting.
Extra Points: List the steps in your process.
Homework
13. Auditor’s
Office
The Process Owner must be in our event team
At least 2 of the process operators must be
represented
Resource managers must be within the same
department
The process must be occurring regularly
The process must have multiple steps and
multiple participants
Process Candidate Criteria
15. Auditor’s
Office
Graphical flow diagrams of data, activities,
and artifacts.
Performance reports about the process
activities.
Volume reports about the process outputs–
can be intermediate outputs.
Information diagrams that demonstrate
systems and state.
Any logs that are produced especially
regulated.
Assign Gathering Duties
17. Auditor’s
Office
Determine next Event session timing.
Process analysis will be the focus, so more
data is always good.
Be ready to think critically and apply some
analytical techniques.
Our goal will be to design a better mousetrap.
Up Next
19. Auditor’s
Office
Flow
Diagrams
• People and Events (Process Maps)
• Systems and Data (Data Flow Diagrams
Performance
Metrics
• Time Driven
• Errors and Work Management
Production
Metrics
• Volume Rates
• Total Effort and Utilization
Welcome to Process Analysis
20. Auditor’s
Office
Pick 3 to 5
metrics that
are
consistent
across the
major steps
in the
process.
Key Measures
Even though there may not be a
current procedure for tracking a
measure, it may still be critical.
A given metric may not be in all
process steps, but should definitely
exist throughout the process.
Focus on those metrics that represent
Production and Performance.
Duration is an almost automatic
metric to include.
21. Auditor’s
Office
All of our
analysis
should be at
a consistent
level of
detail. We’ll
use a
guiding set
of questions
that must all
be “yes” or
else consider
combining
or splitting
steps.
Are the inputs changed upon
exiting the step?
Does the step support a consistent
set of activities, inputs and
participants?
Are there business rules that must
be applied to complete the step?
Can we adequately measure the
step?
Step Uniformity
23. Auditor’s
Office
Examine the
process
steps to
ensure the
level of
detail is the
same.
Consider
splitting,
combining,
or
eliminating
steps as
needed.
Process Decomposition
Step
Description
Duration
Metric 2
Metric 3
Decomposition
25. Auditor’s
Office
Review our
Decomposition
Workbook to
look for “hot
spots”.
Rank the top 3
to 5 of these
for the first
Kaizen Events.
Sometimes
problems are
obvious.
Identifying Problems
Step 1 2 3 4 5
Description Toast
slices of
bread
Peel
banana
Open
peanut
butter
jar
Smear
peanut
butter on
toast
Slice
bananas
onto
peanut
butter
smear
Duration (less
is better)
400
seconds
75
seconds
20
seconds
250
seconds
150
seconds
Height (more is
better)
2 in 2 in 2 in 3 in 4 in
Dryness (less
is better)
80% 80% 80% 85% 55%
27. Auditor’s
Office
Ishikawa or
Fishbone
diagrams are a
Kaizen tool for
evaluating
process flow
challenges.
Starting with
the problem,
we work our
way back to
the significant
root cause(s).
Root Cause Analysis
29. Auditor’s
Office
Three layers
are used in
Kaizen
methods to
demonstrate
the process.
This
approach is
called Value
Stream
Mapping.
Top Layer: Systems and Data Stores
Middle Layer: People and Activities
Bottom Layer: Key Measures of Performance and
Production
Future State Diagram Future State
30. Auditor’s
Office
As a team, identify the 5 key metrics for your
process.
Bonus: Finish converting your process into
the Future State Diagram template for
starting off next session.
Bonus: Identify additional key systems and
data stores for your process.
Homework
32. Auditor’s
Office
Add any additional measures to the Future
State Diagram
Add any additional systems to the Future
State Diagram.
Insert the Actual or Estimated Current values
for our measures.
Insert the Target or Estimated Future values.
Calculate the deltas.
Measuring Planned Improvement Future State
33. Auditor’s
Office
Any steps on
the Future
States that
have
significant
delta are
going to
require a
Kaizen
Event.
What represent Significance– pick
a rule, and let’s apply.
How much confidence do we have
in our estimates?
Are any changes complete step
changes? (new/eliminated)
Identify the Changes
35. Auditor’s
Office
The order of
change
events
defines the
change
program for
a given
process or
process
group.
One or more
projects may
be proposed
that achieve
the program
goals.
What are the top three goals that
result in proposed changes for our
chosen process?
Based on these goals, what is the
rank order of importance for
Kaizen events to achieve these
goals?
What dependencies exist between
Events that further dictate the
order?
Plan the Order of Change
36. Auditor’s
Office
Are metrics
already in
place, or is
totally new
effort
required?
Planning
may fit into
an existing
metrics
management
program.
Post-Change Monitoring
Who will be responsible for
gathering metrics?
What methods/tools are required?
How often will analysis results be
reported?
Where will the data and reports be
stored?
When will measurements begin?
38. Exiting the dark tunnel of despair to reach Shangri-La
Sum It All Up
39. Auditor’s
Office
What is Kaizen?
What are the 5
wastes?
What are the 3 steps
to define a Kaizen
Event?
What is in each layer
of a Future State
model?
What 4 contributors
determine change
impact?
A process
improvement
philosophy that
focuses on
improving Flow.
Translation is
“Change for Better”.
Review of Concepts
40. Auditor’s
Office
What is Kaizen?
What are the 5
wastes?
What are the 3 steps
to define a Kaizen
Event?
What is in each layer
of a Future State
model?
What 4 contributors
determine change
impact?
1. Motion
2. Over-Processing
3. Rework
4. Waiting
5. Variation
Review of Concepts
41. Auditor’s
Office
What is Kaizen?
What are the 5
wastes?
What are the 3 steps
to define a Kaizen
Event?
What is in each layer
of a Future State
model?
What 4 contributors
determine change
impact?
Review of Concepts
Isolate
trouble spots
Determine
the cause
Propose a
solution
42. Auditor’s
Office
What is Kaizen?
What are the 5
wastes?
What are the 3 steps
to define a Kaizen
Event?
What is in each layer
of a Future State
model?
What 4 contributors
determine change
impact?
Systems and Data
Stores
People and
Activities
Production and
Performance Metrics
Review of Concepts
43. Auditor’s
Office
What is Kaizen?
What are the 5
wastes?
What are the 3 steps
to define a Kaizen
Event?
What is in each layer
of a Future State
model?
What 4 contributors
determine change
impact?
Cost Time People Value
Review of Concepts
46. Auditor’s
Office
A common
approach to
building
executive
proposals is
the
Situation-
Target-Plan
template.
Building an Executive Proposal Proposal
Situation: Provide a synopsis of the
problem in it’s current state, including
any risks and quantified issues.
Target: Describe the ideal Future
State, and the value of getting there.
Plan: How will the Kaizen Events be
implemented, over what time, and
who will be involved and what will it
cost.
Classroom Challenge: Provide a workday example of each of the 5 office processing wastes.
Populate this slide with the process list from the class submissions.
This is really a Lean Six-Sigma technique, but it is derived straight from the core of Kaizen modeling.
Production = How Much. Baseline against our minimum required levels to meet customer expectation.
Performance = How Well. Baseline against our current levels of waste. We are not trying to enhance in-place– rather than adding a turbocharger, we seek to eliminate drag.
After completing a couple of Kaizen Events, this will become more second nature and can be approached by checking that the critical metrics are consistently measurable for our steps.
Introduce the workbook template from the last slide. The metrics selected at this point are not critical enough to dwell on for long, we just need one or two that are relevant. A more critical look into metrics will occur later.
To avoid straying off-course, analyze our discussion and work from time to time to ensure we are operating in one of these 3 boxes.
Equipment: Is our toaster bad?
Process: Should we even be toasting the bread?
People: Do we have anybody in charge of the toaster?
Materials: Is the bread old and moldy?
Environment: Is the room dry? Is there an obstacle above the toaster that prevent proper ejection?
Management: Has management been clear in the priority of toasting versus all other process steps and in the finished product?
We may need to re-state our problem after completing the root cause analysis.
While cycle time (WIP/Average Daily Production) is meaningful, we will focus on incremental improvements that will likely improve cycle time.
Bloom (1956) Learning Taxonomy was updated by Webb c. 2002 for small-group learning.
Level 1: Recall/Reproduction
Level 2: Skill or Concept Application
Level 3: Strategic Thinking
Level 4: Extended Thinking (lateral application and investigation)