1. Seasons Question Document
Name: Date:
1. The Sun's apparent daily path through the daytime
sky is best described by an observer in New York
State as
A. a circle around the North Star
B. an arc that extends from east to west
C. a straight line that passes directly overhead
D. a random motion that varies with the seasons
2. A student in New York State observed that the
altitude of the Sun at noon is decreasing each day.
During which month could the student have made
these observations?
A. January B. March
C. May D. October
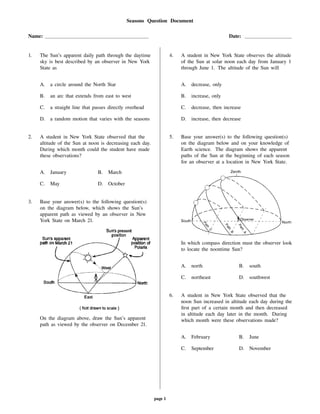
3. Base your answer(s) to the following question(s)
on the diagram below, which shows the Sun's
apparent path as viewed by an observer in New
York State on March 21.
On the diagram above, draw the Sun's apparent
path as viewed by the observer on December 21.
4. A student in New York State observes the altitude
of the Sun at solar noon each day from January 1
through June 1. The altitude of the Sun will
A. decrease, only
B. increase, only
C. decrease, then increase
D. increase, then decrease
5. Base your answer(s) to the following question(s)
on the diagram below and on your knowledge of
Earth science. The diagram shows the apparent
paths of the Sun at the beginning of each season
for an observer at a location in New York State.
In which compass direction must the observer look
to locate the noontime Sun?
A. north B. south
C. northeast D. southwest
6. A student in New York State observed that the
noon Sun increased in altitude each day during the
rst part of a certain month and then decreased
in altitude each day later in the month. During
which month were these observations made?
A. February B. June
C. September D. November
page 1
2. 7. To an observer in New York State, the Sun appears
to rise each day somewhere along the
A. northern horizon B. southern horizon
C. eastern horizon D. western horizon
8. A student in New York State observed that the
noon Sun increased in altitude each day during the
rst part of a certain month and then decreased
in altitude each day later in the month. During
which month were these observations made?
A. February B. June
C. September D. November
9. Base your answer(s) to the following question(s)
on the diagram below. The diagram represents
the apparent path of the Sun observed at four
locations on Earth's surface on March 21. The
present positions of the Sun, Polaris, and the
zenith (position directly overhead) are shown for
an observer at each location.
The observer at location A casts a shadow at the
time represented in the diagram.
a) State the compass direction in which the
observer at location A must look to view her
shadow.
b) Describe the change in the length of the
shadow that will occur between the time
shown and sunset.
10. State the approximate time of day for the observer
at location B when the Sun is at the position
shown in the diagram.
11. Explain why the intensity of sunlight at noon on
March 21 is greater at location C than at the other
locations.
12. The observer at location D is located at a higher
latitude than the other three observers. State one
way that this conclusion can be determined from
the diagram.
13. State the other day of the year when the Sun's
apparent path is exactly the same as that shown
for these four locations on March 21.
14. Base your answer(s) to the following question(s)
on the diagram below, which represents the
position of the Sun with respect to Earth's surface
at solar noon on certain dates. The latitudes of
six locations on the same line of longitude are
shown. The observer is located at 42 N in New
York State. The date for the Sun at position A has
been deliberately left blank.
At which New York State location could the
observer be located?
A. Plattsburgh B. Mount Marcy
C. New York City D. Slide Mountain
15. When the Sun is at position A, which latitude
receives the most direct rays of the Sun?
A. Tropic of Cancer (23.5 N)
B. Tropic of Capricorn (23.5 S)
C. Equator (0 )
D. Antarctic Circle (66.5 S)
page 2 Seasons Question Document
3. 16. Base your answer(s) to the following question(s)
on the diagrams below, which show the apparent
path and solar noon positions of the Sun on
speci c dates at three di erent locations on Earth.
What evidence indicates that the observer at
location A is at the equator?
page 3 Seasons Question Document
4. 17. Base your answer(s) to the following question(s) on the diagram below, which represents the Sun's apparent paths
and the solar noon positions for an observer at 42 N latitude on December 21, September 23, and June 21.
Which graph best shows the altitude of the Sun, as measured by the observer located at 42 N, at various times on
December 21?
A. B.
C. D.
page 4 Seasons Question Document
5. 18. The diagram below shows the apparent daily path
of the Sun, as viewed by an observer at a certain
latitude on three di erent days of the year.
At which latitude were these apparent Sun paths
most likely observed?
A. 0 B. 23.5 N
C. 43 N D. 66.5 N
19. The diagram below shows the noontime shadows
cast by a student and a tree.
If the time is solar noon and the student is located
in New York State, in what direction is the student
facing?
A. north B. south C. east D. west
20. Base your answer(s) to the following question(s)
on the diagram below, which represents a model
of the sky (celestial sphere) for an observer in
New York State. The curved arrow represents
the Sun's apparent path for part of one day. The
altitude of Polaris is also indicated.
Where is this observer most likely located?
A. Massena B. Oswego
C. Slide Mountain D. Mt. Marcy
21. Base your answer(s) to the following question(s)
on the diagram below, which shows the angle of
the Sun's noontime rays received at di erent Earth
latitudes on May 1.
At which latitude can the noontime Sun be
observed in the northern part of the sky?
A. 0 B. 30 N C. 60 N D. 90 N
page 5 Seasons Question Document
6. 22. Base your answer(s) to the following question(s)
on the diagram below, which represents a model
of the sky (celestial sphere) for an observer in
New York State. The curved arrow represents
the Sun's apparent path for part of one day. The
altitude of Polaris is also indicated.
According to this diagram, what is the Sun's
altitude at solar noon?
A. 23.5 B. 42 C. 48 D. 90
23. Base your answer(s) to the following question(s)
on the diagram below, which shows numbered
positions of the Sun at four di erent times along
the Sun's apparent daily path, as seen by an
observer in New York State. Numbers 1 through 4
represent apparent positions of the Sun.
During which day of the year is the Sun most
likely to follow the apparent path shown?
A. March 1 B. July 1
C. October 1 D. December 1
24. The observer had the longest shadow when the
Sun was at position
A. 1 B. 2 C. 3 D. 4
25. The diagram below shows a classroom
demonstration. Two identical ashlights were
placed in the positions shown and they illuminated
areas of varying size, A and B, on a classroom
globe. Thermometers were then placed at the
center of each illuminated area to measure the rate
of temperature increase. Readings were taken over
a period of 30 minutes.
Students most likely observed that the temperature
of area A increased at a
A. slower rate than the temperature of area B
because area A received rays that were less
concentrated
B. slower rate than the temperature of area B
because area A received rays that were more
slanted
C. faster rate than the temperature of area B
because area A received rays that were more
perpendicular to the surface
D. faster rate than the temperature of area B
because area A received rays with less total
energy
page 6 Seasons Question Document
7. 26. The accompanying diagram shows the apparent
path of the Sun as viewed by an observer at a
certain Earth location on March 21.
At which latitude is the observer located?
A. the Equator (0 ) B. 231
2 N
C. 661
2 N D. 90 N
27. Base your answer(s) to the following question(s)
on the diagram below, which represents the
position of the Sun with respect to Earth's surface
at solar noon on certain dates. The latitudes of
six locations on the same line of longitude are
shown. The observer is located at 42 N in New
York State. The date for the Sun at position A has
been deliberately left blank.
When the Sun is at the March 21 position, New
York State will usually have
A. longer days than nights
B. 12 hours of daylight and 12 hours of darkness
C. the lowest annual altitude of the Sun at solar
noon
D. the highest annual altitude of the Sun at solar
noon
28. Base your answer(s) to the following question(s)
on the diagrams below, which show the apparent
path and solar noon positions of the Sun on
speci c dates at three di erent locations on Earth.
Explain why the observer's shadow at location B
will always point northward at solar noon.
page 7 Seasons Question Document
8. 29. On the diagram below, draw a line representing
the apparent path of the Sun at location B on
August 21.
30. How many hours of daylight are seen by the
observer at location C on June 21?
page 8 Seasons Question Document
9. 31. Base your answer(s) to the following question(s) on the diagram below, which represents Earth revolving around
the Sun. Letters A, B, C, and D represent Earth's location in its orbit on the rst day of the four seasons. NP
represents the North Pole.
Which diagram best represents the Sun's apparent path as seen by an observer at 43.5 N latitude on December 21?
A. B.
C. D.
page 9 Seasons Question Document
10. 32. Base your answer(s) to the following question(s)
on the diagram and data table below. The
diagram represents the Sun's apparent paths as
viewed by an observer located at 50 N latitude on
June 21 and March 21. The data table shows the
Sun's maximum altitude for the same two dates
of the year. The Sun's maximum altitude for
December 21 has been left blank.
Data Table
Date Sun's Maximum Altitude
June 21 63.5
March 21 40
December 21
Which value should be placed in the data table for
the Sun's maximum altitude on December 21?
A. 16.5 B. 23.5 C. 40 D. 90
33. Which graph best represents the relationship
between the time of day and the length of a
shadow cast by the observer on March 21?
A.
B.
C.
D.
page 10 Seasons Question Document
11. 34. Which diagram represents the apparent path of the
Sun on March 21 for an observer at the equator?
A.
B.
C.
D.
35. The diagram below represents the horizon and
the Sun's apparent paths, A, B, and C, on three
di erent dates, as viewed from the same location
in New York State.
Which table correctly shows the dates on which
the apparent paths of the Sun were observed?
A. Path of
Sun
Date
A December 21
B September 23
C March 21
B. Path of
Sun
Date
A December 21
B March 21
C June 21
C. Path of
Sun
Date
A March 21
B September 23
C June 21
D. Path of
Sun
Date
A June 21
B March 21
C December 21
page 11 Seasons Question Document
12. 36. Base your answer(s) to the following question(s)
on the diagram below and on your knowledge of
Earth science. The diagram represents the Sun's
apparent path on the equinoxes and the longest
and shortest days of the year for a location in New
York State. Points X, Y, and Z represent the solar
noon positions along daily Sun paths X,Y, and Z.
On the diagram above, draw one arrow in each
box on path Z to indicate the Sun's apparent
direction of movement along path Z.
37. State one possible date of the year represented by
each apparent path of the Sun.
38. State the rate, in degrees per hour, that the Sun
appears to travel along path X from sunrise to
sunset.
page 12 Seasons Question Document
13. Base your answer(s) to the following question(s) on the diagram below and on your knowledge of Earth science. The
diagram represents four apparent paths of the Sun, labeled A, B, C, and D, observed in Jamestown, New York. The
June 21 and December 21 sunrise and sunset positions are indicated. Letter S identi es the Sun's position on path C at
a speci c time of day. Compass directions are indicated along the horizon.
The Sun's Changing Position
page 13 Seasons Question Document
14. 39. The greatest duration of insolation in Jamestown
ccurs when the Sun appears to travel along path
A. A B. B C. C D. D
40. Base your answer(s) to the following question(s)
on the sky model below and on your knowledge
of Earth science. The model shows the Sun's
apparent path through the sky as seen by an
observer in the Northern Hemisphere on June 21.
Describe the evidence, shown in the sky model,
which indicates that the observer is not located at
the North Pole.
41. The diagram below represents the position of
Earth in its orbit on March 21. Place an X on
Earth's orbit to represent Earth's orbital position
when the apparent path of the Sun in the sky
model was observed.
42. Identify the cause of the apparent daily motion of
the Sun through the sky.
43. An object that is a good absorber of
electromagnetic energy is most likely a good
A. convector B. re ector
C. radiator D. refractor
44. The hottest climates on Earth are located near the
Equator because this region
A. is usually closest to the Sun
B. re ects the greatest amount of insolation
C. receives the most hours of daylight
D. receives the most nearly perpendicular
insolation
45. The diagrams below represent Earth's tilt on its
axis on four di erent dates. The shaded portion
represents the nighttime side of the Earth. Which
diagram best represents the day on which the
longest duration of insolation occurs in New York
State?
A. B.
C. D.
page 14 Seasons Question Document
15. 46. Base your answer(s) to the following question(s) on
the Earth Science Reference Tables, the diagram
below, and your knowledge of Earth science. The
diagram represents a cross section of the shoreline
of Lake Erie.
Which characteristics of the land surface have the
greatest e ect on the amount of insolation the land
surface absorbs?
A. hardness and age
B. density and hardness
C. age and roughness
D. roughness and color
47. Base your answer(s) to the following question(s) on
the Earth Science Reference Tables, the diagrams
below, and your knowledge of Earth science.
Diagram I shows a house located in New York
State. Diagram II shows a solar collector that the
homeowner is using to help heat the house.
The homeowner decides to install carpet on the
oor in the room that receives the most sunlight.
A carpet with which characteristics would absorb
the most insulation?
A. smooth texture and light color
B. smooth texture and dark color
C. rough texture and light color
D. rough texture and dark color
48. At which latitude and on which date does the
surface of Earth receive the greatest intensity of
insolation?
A. the Tropic of Cancer (23-1/2 N) on
December 21
B. the Equator (0 ) on September 23
C. the Antarctic Circle (66-1/2 S) on June 21
D. the South Pole (90 S) on March 21
49. Insolation is often converted into potential energy
by
A. evaporation of water from the oceans
B. formation of fog in a valley
C. freezing of water droplets on a highway
D. precipitation of rain from a thunderstorm
page 15 Seasons Question Document
16. 50. The diagram below shows Earth as viewed from
space on December 21.
The longest duration of insolation on December 21
will occur at
A. 90 N B. 30 N C. 30 S D. 90 S
51. How do the rates of warming and cooling of land
surfaces compare to the rates of warming and
cooling of ocean surfaces?
A. Land surfaces warm faster and cool more
slowly.
B. Land surfaces warm more slowly and cool
faster.
C. Land surfaces warm faster and cool faster.
D. Land surfaces warm more slowly and cool
more slowly.
52. Which diagram best represents the wavelength of
most of the sunlight energy absorbed and the
wavelength of infrared energy reradiated by the
roof of a building at 2 pm on a clear summer day?
A. B.
C. D.
53. Most of the energy radiated by Earth's surface at
night is in the form of
A. infrared rays B. ultraviolet rays
C. radiation D. insolation
54. The accompanying diagram shows the percentage
of sunlight re ected by di erent Earth surfaces
when the Sun is directly overhead.
What material re ects the least sunlight?
A. forest B. beach C. ocean D. snow
55. If equal areas are compared, which Earth surface
would normally absorb the least electromagnetic
energy from the Sun?
A. basaltic lava ow
B. shallow lake bottom
C. snow-covered eld
D. plowed eld
page 16 Seasons Question Document
17. 56. Which graph best represents the duration of
insolation during the year at the Equator.
A.
B.
C.
D.
57. Which statement best explains why the angle of
insolation received at any Earth location changes
in a cyclic pattern throughout the year?
A. The Sun's orbit around Earth is an ellipse.
B. Earth's orbit around the Sun is an ellipse.
C. The Sun rotates on a tilted axis while
revolving around Earth.
D. Earth rotates on a tilted axis while revolving
around the Sun.
58. The data table below compares the percentage
of sunlight re ected from various types of Earth
surfaces.
Surface Percent of Sunlight Re ected
Fresh snow 80–85
Old snow 50–60
Sand 20–30
Grass 20–25
Dry soil 15–25
Wet soil 10
Forest 5–10
Water (Sun at sunset) 50–80
Water (Sun overhead) 3–5
Thick cloud 70–80
Thin cloud 25–50
Which statement is best supported by the table?
A. Light-colored surfaces re ect more sunlight
than dark-colored surfaces.
B. Rough surfaces re ect more sunlight than
smooth surfaces.
C. Soil surfaces re ect more sunlight than cloud
surfaces.
D. Vegetative surfaces re ect more sunlight than
ice surfaces.
page 17 Seasons Question Document
18. 59. The accompanying graph shows air temperatures
on a clear summer day from 7 am to 12 noon at
two locations, one in Florida and one in New York
State.
Air temperature rose slightly faster in Florida than
in New York State because Florida
A. has a lower angle of insolation
B. has a higher angle of insolation
C. is closer to the Prime Meridian
D. is farther from the Prime Meridian
60. Which diagram best represents visible light rays
after striking a dark, rough surface?
A.
B.
C.
D.
61. Which characteristics of a building material
would provide the most energy-absorbing exterior
covering for a house?
A. dark colored and smooth textured
B. dark colored and rough textured
C. light colored and smooth textured
D. light colored and rough textured
page 18 Seasons Question Document
19. 62. The accompanying diagram shows the types of
electromagnetic energy given o by the Sun. The
shaded part of the diagram shows the approximate
amount of each type actually reaching Earth's
surface.
Which conclusion is best supported by the
diagram?
A. All types of electromagnetic energy reach
Earth's surface.
B. Gamma rays and x rays make up the greatest
amount of electromagnetic energy reaching
Earth's surface.
C. Visible light makes up the greatest amount
of electromagnetic energy reaching Earth's
surface.
D. Ultraviolet and infrared radiation make up the
greatest amount of electromagnetic energy
reaching Earth's surface.
63. The diagram below represents Earth at a speci c
position in its orbit as viewed from space. The
shaded area represents nighttime. Which Earth
latitude receives the greatest intensity of insolation
when Earth is at the position shown in the
diagram?
A. 0 B. 231
2 N
C. 661
2 N D. 90 N
64. Which graph best represents the relationship
between the angle of insolation and the intensity
of insolation?
A.
B.
C.
D.
65. The table below shows the duration of insolation
(hours of daylight) measured by four observers, W,
X, Y, and Z, at four di erent Earth latitudes on
both March 21 and June 21. There were clear
skies at all four latitudes on both days.
Observer Duration of Insolation
March 21
Duration of Insolation
June 21
W 12 hr 0 hr
X 12 hr 12 hr
Y 12 hr 18 hr
Z 12 hr 24 hr
Which observer was located at the Equator?
A. W B. X C. Y D. Z
page 19 Seasons Question Document
20. 66. A square meter of surface of which of these
natural areas would most likely absorb the most
insolation during a clear day?
A. a fast-moving river
B. a dark-green forest
C. a beach with white sand
D. a snow-covered eld
67. Base your answer(s) to the following question(s)
on the diagram below, which shows the angle of
the Sun's noontime rays received at di erent Earth
latitudes on May 1.
Which changes can be expected to occur at 45 N
over the next 30 days?
A. The duration of insolation will decrease and
the temperature will decrease.
B. The duration of insolation will decrease and
the temperature will increase.
C. The duration of insolation will increase and
the temperature will decrease.
D. The duration of insolation will increase and
the temperature will increase.
68. The diagram below shows a greenhouse.
What is the primary function of the clear glass of
the greenhouse?
A. The glass reduces the amount of insolation
entering the greenhouse.
B. The glass allows all wavelengths of radiation
to enter and all wavelengths of radiation to
escape.
C. The glass allows short wavelengths of
radiation to enter, but reduces the amount of
longwavelength radiation that escapes.
D. The glass allows long wavelengths of
radiation to enter, but reduces the amount of
shortwavelength radiation that escapes.
69. On which day of the year would the intensity of
insolation at Kingston, New York, most likely be
greatest?
A. March 21 B. June 21
C. September 23 D. December 21
70. The coldest climates on Earth are located at or
near the poles primarily because Earth's polar
regions
A. receive mostly low-angle insolation
B. receive less total yearly hours of daylight
C. absorb the greatest amount of insolation
D. are usually farthest from the Sun
page 20 Seasons Question Document
21. 71. Base your answer(s) to the following question(s)
on the graph below, which shows the amount
of insolation during one year at four di erent
latitudes on Earth's surface.
This graph shows that insolation varies with
A. latitude and time of day
B. latitude and time of year
C. longitude and time of day
D. longitude and time of year
72. Why is less insolation received at the equator in
June than in March or September?
A. The daylight period is longest at the equator
in June.
B. Winds blow insolation away from the equator
in June.
C. The Sun's vertical rays are north of the
equator in June.
D. Thick clouds block the Sun's vertical rays at
the equator in June.
73. Why is insolation 0 cal/cm2/min from October
through February at 90 N?
A. Snow elds re ect sunlight during that time.
B. Dust in the atmosphere blocks sunlight during
that time.
C. The Sun is continually below the horizon
during that time.
D. Intense cold prevents insolation from being
absorbed during that time.
74. In which diagram is the observer experiencing the
greatest intensity of insolation?
A.
B.
C.
D.
page 21 Seasons Question Document
22. 75. Base your answer(s) to the following question(s)
on the passage and map below. The map shows a
portion of the continent of Antarctica.
Antarctica's Ice Sheet
The size and shape of the West
Antarctic Ice Sheet depends on many factors,
including melting and freezing beneath the
glacier, the amount of snowfall, snow
removal by wind, iceberg formation, and
the rate of ice ow. Glacial moraines are
found in the Executive Committee Mountains
shown on the map. Moraines are located up
to 100 meters in elevation above the present
ice sheet surface, which indicates that a
thicker ice sheet existed 20,000 years ago.
The world's oceans and climate are
in uenced by Antarctica's ice. Even a small
increase in sea level from melting glaciers
would be a disaster for the nearly two billion
people who live near coastal areas.
What is the duration of insolation on December 21
at McMurdo Station?
76. Which graph best shows the general relationship
between the altitude of the noontime Sun and the
intensity of insolation received at a location?
A.
B.
C.
D.
page 22 Seasons Question Document
23. 77. In New York State, summer is warmer than winter
because in summer New York State has
A. fewer hours of daylight and receives low
angle insolation
B. fewer hours of daylight and receives high
angle insolation
C. more hours of daylight and receives low angle
insolation
D. more hours of daylight and receives high
angle insolation
78. Base your answer(s) to the following question(s)
on the diagram and data table below. The
diagram represents the Sun's apparent paths as
viewed by an observer located at 50 N latitude on
June 21 and March 21. The data table shows the
Sun's maximum altitude for the same two dates
of the year. The Sun's maximum altitude for
December 21 has been left blank.
Data Table
Date Sun's Maximum Altitude
June 21 63.5
March 21 40
December 21
Which statement best compares the intensity and
angle of insolation at noon on March 21 and
June 21?
A. The intensity and angle of insolation are
greatest on March 21.
B. The intensity and angle of insolation are
greatest on June 21.
C. The intensity of insolation is greatest on June
21 and the angle of insolation is greatest on
March 21.
D. The intensity of insolation is greatest on
March 21 and the angle of insolation is
greatest on June 21.
page 23 Seasons Question Document
24. Base your answer(s) to the following question(s) on the map below and on your knowledge of Earth science. The map
shows a retreating valley glacier and the features that have formed because of the advance and retreat of the glacier.
page 24 Seasons Question Document
25. 79. Explain why the glacial ice absorbs less solar
radiation than the surrounding exposed bedrock
and soil.
80. The accompanying maps show the amount of sea
ice surrounding the continent of Antarctica at two
di erent times of the year. Map A represents
late August when the area covered by sea ice
approaches its greatest extent. Map B represents
the minimum extent of sea ice.
Which month is most probably represented by
map B?
A. February B. May
C. June D. October
81. Base your answer(s) to the following question(s)
on the diagram below, which represents Earth
revolving around the Sun. Letters A, B, C, and D
represent Earth's location in its orbit on the rst
day of the four seasons. NP represents the North
Pole.
Which location in Earth's orbit represents the rst
day of summer in New York State?
A. A B. B C. C D. D
82. If the tilt of Earth's axis were decreased from
23.5 to 15 , New York State's winters would
become
A. warmer, and summers would become cooler
B. warmer, and summers would become warmer
C. cooler, and summers would become cooler
D. cooler, and summers would become warmer
83. To an observer in New York State, the duration of
daylight increases continuously from
A. March 1 to May 1
B. June 1 to August 1
C. September 1 to November 1
D. December 1 to February 1
page 25 Seasons Question Document
26. 84. The diagram below represents Earth in space on
the rst day of a season.
Which season is beginning in New York State on
the day represented in the diagram?
A. winter B. spring
C. summer D. fall
85. The map below shows the major climate zones on
Earth
The primary factor controlling these climate zones
is
A. elevation B. solar time
C. latitude D. longitude
86. Locations in New York State are warmest in
summer because sunlight in summer is
A. least intense and of shortest duration
B. least intense and of longest duration
C. most intense and of shortest duration
D. most intense and of longest duration
87. The shaded portion of the accompanying map
indicates areas of night and the unshaded portion
indicates areas of daylight.
What day of the year is best represented by the
map?
A. March 21 B. June 21
C. September 21 D. December 21
88. The accompanying data table shows the altitude of
Polaris as recorded by four observers at di erent
locations on Earth.
Observer Altitude of
Polaris
A 90
B 30
C 30
D 20
Which statement is best supported by the
information in the table?
A. Observer A was at the Equator.
B. Observers A and B measured the altitude
during daytime hours.
C. Observers B and C measured the altitude at
the same latitude.
D. Observers B, C, and D were in the Southern
Hemisphere.
page 26 Seasons Question Document
27. 89. Base your answer(s) to the following question(s)
on the diagram below, which shows the altitude
of the Sun at solar noon on certain dates. The
positions of the Sun, labeled A, B, and C, were
measured by an observer at 42 north latitude.
The date when the Sun was observed at position A
has been deliberately left blank.
Which season begins in New York State when the
noontime Sun is observed at position A?
90. Position B represents the Sun's position at solar
noon on March 21. On what other date of the
year would the noontime Sun be observed at
position B?
91. Base your answer(s) to the following question(s)
on the diagram below, which shows the altitude
and apparent position of the noontime Sun, as seen
from various latitudes on Earth on a particular
day of the year. Letters A through D represent
locations on Earth's surface.
Which season will begin at 41 N latitude, three
months after the date represented by this diagram?
A. summer B. fall
C. winter D. spring
92. Base your answer(s) to the following question(s)
on the diagram below, which shows Earth's orbit
around the Sun as viewed from space. Earth
is shown at eight di erent positions labeled A
through H. Earth's North Pole, Arctic Circle, and
equator have been labeled at position C. The
arrows show the direction of orbital motion.
Complete the data table below by placing the letter
that represents the position of Earth at the start of
each season in the Northern Hemisphere.
Season Earth's
position
spring
summer
fall
winter
page 27 Seasons Question Document
28. 93. Base your answer(s) to the following question(s)
on the diagram below which shows Earth as
viewed from space on December 21. Some
latitudes are labeled.
December 21
Place an X at a location on Earth's surface where
the Sun was directly overhead at some time on
December
94. State one factor, other than the tilt of Earth's axis,
that causes seasons to change on Earth.
95. At which latitude is Polaris observed at an altitude
of 66.5 ?
96. Which diagram best represents the tilt of Earth's
axis that causes the Northern Hemisphere seasons
shown? (Diagrams are not drawn to scale.)
A.
B.
C.
D.
page 28 Seasons Question Document
29. 97. Base your answer(s) to the following question(s)
on the table below and on your knowledge of
Earth science. The table provides information
about sunlight received on four dates of a certain
year. Letter A represents a date. The arrows
indicate the Sun's direct rays.
Date Position of Earth Relative
to the Sun's Rays
Seasonal Event
Sept 23 Fall equinox:
Equal day and night
Sun on the horizon at poles
Direct ray at equator
Dec 21 Winter solstice:
Area north of Arctic Circle in constant darkness
A Spring equinox:
Equal day and night
Sun on the horizon at poles
Direct ray at equator
June 21 Summer solstice:
Area south of Antarctic Circle in constant darkness
Direct ray at 23.5 N
Identify one possible date represented by letter A.
98. State the numerical latitude at which the Sun is
directly overhead at noon on December 21. Include
the units and compass direction in your answer.
99. Base your answer(s) to the following question(s)
on the table below and on your knowledge of
Earth science. The table provides information
about sunlight received on four dates of a certain
year. Letter A represents a date. The arrows
indicate the Sun's direct rays.
Date Position of Earth Relative
to the Sun's Rays
Seasonal Event
Sept 23 Fall equinox:
Equal day and night
Sun on the horizon at poles
Direct ray at equator
Dec 21 Winter solstice:
Area north of Arctic Circle in constant darkness
A Spring equinox:
Equal day and night
Sun on the horizon at poles
Direct ray at equator
June 21 Summer solstice:
Area south of Antarctic Circle in constant darkness
Direct ray at 23.5 N
State the number of daylight hours occurring north
of the Arctic Circle on June 21.
100. Explain why the Sun's direct rays are at di erent
latitudes as Earth revolves around the Sun.
page 29 Seasons Question Document
30. Problem-Attic format version 4.4.220
c_ 2011–2014 EducAide Software
Licensed for use by MBHS Science
Terms of Use at www.problem-attic.com
Seasons Question Document 03/22/2015
1.
Answer: B
2.
Answer: D
3.
Answer:
4.
Answer: B
5.
Answer: B
6.
Answer: B
7.
Answer: C
8.
Answer: B
9.
Answer:
10.
Answer:
11.
Answer:
12.
Answer:
13.
Answer:
14.
Answer: D
15.
Answer: B
16.
Answer: Acceptable responses include, but are not
limited to:
- The Sun is directly overhead at solar
noon on March 21.
- The Sun reaches an altitude of 90 on
an equinox.
- Each apparent path of the Sun has a
daylight duration of 12 hours.
17.
Answer: D
18.
Answer: C
19.
Answer: A
20.
Answer: C
21.
Answer: A
22.
Answer: C
23.
Answer: B
24.
Answer: D
25.
Answer: C
26.
Answer: A
27.
Answer: B
28.
Answer: Acceptable responses include, but are not
limited to:
- Location B represents an area where the
Sun is above the southern horizon at
solar noon.
- The Sun is in the southern portion of
the sky.
29.
Answer: Credit for a line drawn approximately
parallel to the existing Sun's paths and
within the shaded portion shown below.
31. Teacher's Key Page 2
30.
Answer: Credit for 24 h.
31.
Answer: D
32.
Answer: A
33.
Answer: D
34.
Answer: A
35.
Answer: D
36.
Answer:
37.
Answer: [answers vary] Ex: X: winter solstice,
rst day of winter, Dec. 20–22; Y:
March 20–22, an equinox, rst day of
spring; Z: June 20–22, summer solstice,
rst day of summer
38.
Answer: 15 /hour
39.
Answer: A
40.
Answer: Acceptable responses include, but are not
limited to:
– Polaris is not overhead.
– All compass directions are shown.
– The Sun's path is tilted.
– At the North Pole, the altitude of
Polaris is 90 .
41.
Answer:
42.
Answer: Acceptable responses include, but are not
limited to: the rotation of Earth; Earth is
spinning on its axis.
43.
Answer: C
44.
Answer: D
45.
Answer: B
46.
Answer: D
47.
Answer: D
48.
Answer: B
49.
Answer: A
50.
Answer: D
51.
Answer: C
52.
Answer: D
53.
Answer: A
54.
Answer: C
55.
Answer: C
56.
Answer: C
57.
Answer: D
58.
Answer: A
59.
Answer: B
60.
Answer: C
61.
Answer: B
62.
Answer: C
63.
Answer: A
64.
Answer: B
32. Teacher's Key Page 3
65.
Answer: B
66.
Answer: B
67.
Answer: D
68.
Answer: C
69.
Answer: B
70.
Answer: A
71.
Answer: B
72.
Answer: C
73.
Answer: C
74.
Answer: D
75.
Answer: 24 hours
76.
Answer: A
77.
Answer: D
78.
Answer: B
79.
Answer: Acceptable responses include, but are not
limited to:
– The ice is white/light colored.
– The smooth ice re ects better than
rougher land terrain.
– The bedrock/soil is darker colored.
– Snow and ice re ect more insolation.
– has a higher albedo
80.
Answer: A
81.
Answer: B
82.
Answer: A
83.
Answer: A
84.
Answer: A
85.
Answer: C
86.
Answer: D
87.
Answer: D
88.
Answer: C
89.
Answer:
90.
Answer:
91.
Answer: D
92.
Answer: Season Earth's
position
spring A
summer C
fall E
winter G
93.
Answer: The center of the X should be located
closely to the Tropic of Capricorn
(23.5 S).
94.
Answer: – parallelism of Earth's axis
– The North Pole always points toward
Polaris.
– revolution of Earth
– location of the Sun's vertical ray
– duration/intensity of insolation
– angle of insolation
95.
Answer: – 66.5 N or 661
2 N or 66 300 N
– at the Arctic Circle
96.
Answer: C
97.
Answer: March 19 or March 20 or March 21 or
March 22
98.
Answer: any value from 23.4 S to 23.5 S
99.
Answer: 24 h
33. Teacher's Key Page 4
100.
Answer: Earth's axis is tilted 23.5 degrees from a
line perpendicular to the plane of Earth's
orbit; axis is tilted; Earth's axis is always
parallel to itself at any other place in
Earth's orbit; parallelism of Earth's axis;
Earth's axis is always aligned with the
North Star (Polaris) as Earth orbits the
Sun.