9. Time-based Care Ratios
Description of Service for Comparison Provider National Variance from National State Variance from State
Adult Critical Care - 99291 to 99292 25.25 10.20 147.4 % 13.73 83.9 %
Pediatric Critical Care - 99475 to 99476 0.00 0.00 0.0 % 0.00 0.0 %
Pediatric Critical Care - 99471 to 99472 0.00 0.00 0.0 % 0.00 0.0 %
Neonate Critical Care - 99468 to 99469 0.00 0.00 0.0 % 0.00 0.0 %
Prolonged outpatient service - 99354 to 99355 0.00 26.62 -100.0 % 26.38 -100.0 %
Prolonged inpatient service - 99356 to 99357 0.00 6.60 -100.0 % 16.14 -100.0 %
Prolonged E&M service - 99358 to 99359 0.00 12.81 -100.0 % 0.00 0.0 %
Intercategory Ratios
Description of Service for Comparison Provider National Variance from National State Variance from State
Office Consult to New Office Visit 0.36 0.00 N/A 0.00 N/A
Discharge Days to Initial Hospital Visit 0.00 0.10 -100.0 % 0.06 -100.0 %
Established Office Visit to New Office Visit 0.91 2.52 -63.9 % 2.43 -62.6 %
Subsequent Hospital Visit to Initial Hospital Visit 0.08 2.13 -96.3 % 1.93 -95.9 %
Inpatient Consultations to Initial Hospital Visit 0.78 0.00 N/A 0.00 N/A
Inpatient Consultations to Subsequent Hospital Visit 9.83 0.00 N/A 0.00 N/A
Initial Observation Care to Initial Hospital Visit 0.00 0.03 -100.0 % 0.01 -100.0 %
Observation or Inpatient Care to Initial Observation 0.00 0.29 -100.0 % 0.71 -100.0 %
Observation or Inpatient Care to Initial Hospital Visit 0.00 0.01 -100.0 % 0.01 -100.0 %
Global Category Percent
Category Descriptions Provider National Variance from National State Variance from State
Total Number of E&M Services Calculated 298
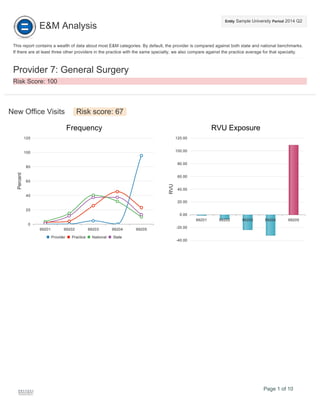
New Office Visits to All E&M Codes 7.4 % 16.6 % -55.6 % 0.16 -54.8 %
Established Office Visits to All E&M codes 6.7 % 41.8 % -84.0 % 0.40 -83.1 %
Initial Hospital Visits to All E&M Codes 25.5 % 10.4 % 146.1 % 0.12 113.6 %
Subsequent Hospital Visits to All E&M Codes 2.0 % 22.1 % -90.9 % 0.23 -91.3 %
Outpatient Consults to All E&M Codes 2.7 % 0.1 % N/A 0.00 0.0 %
Inpatient Consults to All E&M Codes 19.8 % 0.0 % N/A 0.00 0.0 %
Emergency Department Services to All E&M Codes 0.7 % 1.3 % -47.7 % 0.01 -16.3 %
Comprehensive Nursing Home Visits to All E&M Codes 0.0 % 0.4 % -100.0 % 0.01 -100.0 %
Subsequent Nursing Home Visits to All E&M Codes 0.0 % 2.8 % -100.0 % 0.03 -100.0 %
Category Summaries Provider National Variance from National State Variance from State
All Office Visits to All E&M Codes 14.1 % 58.4 % -75.9 % 56.03 -99.7 %
All Hospital Visits to All E&M Codes 27.5 % 32.5 % -15.2 % 35.02 -99.2 %
All Consults to All E&M Codes 22.5 % 0.1 % N/A 0.00 N/A
Page 9 of 10
10. Category Descriptions Provider National Variance from National State Variance from State
All Nursing Home Visits to All E&M Codes 0.0 % 3.2 % -100.0 % 4.19 -100.0 %
All E&M Visits to All Procedures 42.6 % 49.4 % -13.8 % 0.49 -13.6 %
Utilization Distribution Calculations by Category
Category Provider RVU National RVU Variance from National State RVU Variance from State
All 0.00 0.00 0.0 % 0.00 0.0 %
New Office Visits 5.65 3.60 57.0 % 3.86 46.6 %
Established Office Visits 3.12 2.10 48.6 % 2.18 43.3 %
Initial Observation Care 0.00 3.94 -100.0 % 3.98 -100.0 %
Initial Hospital Visits 5.70 4.39 29.8 % 4.54 25.5 %
Subsequent Hospital Visits 2.91 1.85 57.6 % 1.92 51.2 %
Observation or Inpatient Care Service 0.00 4.73 -100.0 % 4.79 -100.0 %
Discharge Days 0.00 2.14 -100.0 % 2.28 -100.0 %
New/Established Office Consultations 5.35 4.16 28.7 % 3.85 39.1 %
Initial Inpatient Consultations 5.64 3.42 64.8 % 2.83 99.2 %
Emergency Department Services 4.85 3.13 54.9 % 3.15 54.0 %
Comprehensive Nursing Facility Assessments 0.00 3.56 -100.0 % 4.11 -100.0 %
Subsequent Nursing Facility Assessments 0.00 2.96 -100.0 % 3.03 -100.0 %
Charge Differential Calculations by Category
Category
Provider
RVU
Expected RVU
(National)
RVU Differential
(National)
Expected RVU
(State)
RVU Differential
(State)
New Office Visits 124.40 79.25 45.15 84.82 39.58
Established Office Visits 62.32 41.96 20.36 43.50 18.82
Initial Observation Care 0.00 0.00 0.00 0.00 0.00
Initial Hospital Visits 433.20 333.92 99.28 345.24 87.96
Subsequent Hospital Visits 17.46 11.08 6.38 11.55 5.91
Observation or Inpatient Care Service 0.00 0.00 0.00 0.00 0.00
Discharge Days 0.00 0.00 0.00 0.00 0.00
New/Established Office Consultations 42.80 33.25 9.55 30.77 12.03
Initial Inpatient Consultations 332.57 201.82 130.75 166.97 165.60
Emergency Department Services 9.70 6.26 3.44 6.30 3.40
Comprehensive Nursing Facility Assessments 0.00 0.00 0.00 0.00 0.00
Subsequent Nursing Facility Assessments 0.00 0.00 0.00 0.00 0.00
RVU Totals 1,022.45 707.53 314.92 689.14 333.31
Dollar Totals (CF = 35.8228) 36,627.02 25,345.86 11,281.16 24,687.06 11,939.97
Page 10 of 10