SlideShare ist ein Scribd-Unternehmen logo
1 von 66
Downloaden Sie, um offline zu lesen
Northrop
Grumman
Corporation
General Dynamics Corporation
(Competitor)
Rachel Voigtlander
Financial Management FIN833
Professor Wiley
September 14, 2015
Northrop Grumman Corporation ii
Table of Contents
Executive Summary ......................................................................................................... 1
Ratio Charts and Analyses................................................................................................ 3
Liquidity Ratios............................................................................................................ 3
Current Ratio.......................................................................................................................................3
Quick Ratio .........................................................................................................................................5
Debt Management Ratios ............................................................................................. 7
Debt Ratio...........................................................................................................................................7
Times Interest Earned Ratio.................................................................................................................9
Asset Management Ratios........................................................................................... 11
Inventory Turnover Ratio...................................................................................................................11
Days Sales Outstanding Ratio ............................................................................................................13
Total Assets Turnover Ratio...............................................................................................................15
Fixed Assets Turnover Ratio ..............................................................................................................16
Profitability Ratios...................................................................................................... 18
Profit Margin on Sales........................................................................................................................18
Return on Total Assets.......................................................................................................................20
Return on Equity ...............................................................................................................................22
DuPont Analyses........................................................................................................ 24
Return on Total Assets.......................................................................................................................24
Return on Equity ...............................................................................................................................25
Excel Spreadsheet Printouts ........................................................................................ 27
NOC Spreadsheet ..............................................................................................................................27
GD Spreadsheet.................................................................................................................................28
Excel Ratio Checking Spreadsheet Printouts................................................................ 29
NOC Checker....................................................................................................................................29
GD Checker ......................................................................................................................................29
SEC Financial Statements for GD............................................................................... 30
SEC Financial Statements for NOC ............................................................................ 44
Northrop Grumman Corporation iii
Industry Data Source.................................................................................................. 61
Mergent Online..................................................................................................................................61
eStatement Studies.............................................................................................................................61
Rachel Voigtlander
Financial Management FIN338
Professor Wiley
September 14, 2015
Northrop Grumman Corporation 1
Northrop Grumman Corporation
General Dynamics Corporation (Competitor)
Executive Summary
Northrop Grumman (NOC) and General Dynamics (GD) are aerospace and defense
companies with an overall positive outlook in the current market when compared to the top
10-industry average. Leading in key financial ratios, NOC appears to be sitting in a position
to produce strong future revenues. NOC continues to remain stable in adequate liquidity,
not heavily relying on inventory to pay off current liabilities, demonstrated by maintaining a
Quick Ratio higher than industry average and the competitor, GD. Total asset turnover
ratio has been in decline for NOC, GD, and the top 10-company industry average.
However, Fixed Asset Turnover has increased from the low in 2009, demonstrating more
effective asset management. In 2014, NOC had a solid performance, with upward trends in
inventory turnover and profit margin on sales, positioned well above the top 10-industry
average. Conflicts in the Middle East have yielded an environment of swift, strategic
acquisitions for the company, as NOC’s products and services are in increasing demand,
depicted by an increasing trend in the Inventory Turnover Ratio. A majority of NOC’s
contracts are with the United States government; increased demand has led to an increased
profit margin on sales ratio by 29% from 2009 to 2014. NOC falls below the industry
average and competitors in Days Sales Outstanding ratio with an average of 42 days from
2009 to 2014. NOC falls below their competitor, GD, and the Industry average in the
Times Interest Earned Ratio and may need to focus on increasing their ability to meet debt
obligations. NOC is financed by approximately 60% debt, however both GD and industry
averages prove this to be an industry norm. Due to NOC’s types of products and services
and quality control, NOC has a lower inventory turnover when compared to the Industry
average. An effective strategy may lie in improved inventory management systems. NOC’s
Return on Equity Ratio is highly impressive. Since 2009, ROE has increased dramatically,
and takes a sharp incline, well above the company’s competitor and the industry for 2014.
In light of positively increasing trends in Profit Margins on Sales, Return on Equity, and
Return on Assets Ratios demonstrating efficient costs strategies and management relative to
total sales, NOC is positioned to ensure revenues and sales for the upcoming years.
Northrop Grumman Corporation 2
GD is also capitalizing on the current tensions and conflicts in the Middle East and Europe.
Military aviation, weapons, equipment, and intelligence are in strongly needed by the
United States government. GD partakes in contracts with the U.S. government, along with
other countries worldwide. Similarly to NOC, GD has made multiple acquisitions in the
industry. These acquisitions led to a major disturbance in Profit Margin on Sales Ratio,
Return on Assets Ratio, and Return on Equity, due to an 861% decline in net income in
2012 from the account goodwill impairment increasing by $1,994 million. Despite this
occurrence, GD’s Return on Equity ratio was higher than NOC’s prior to the 2012
disturbance and since, has shifted to an increasing trend for 2014. GD remains above the
industry average for the company’s Current and Quick Ratios, demonstrating a low reliance
on inventory and stability in paying off current liabilities. GD is proficient in debt
management and may be able to incur an increased amount of debt in the future. GD’s
inventory management may need revision, as the company’s Industry Turnover Ratio is far
below both NOC and the Industry average. While GD’s inventory does consist of large-
scaled products, such as boats and planes, the strongly decreasing trend in the ratio proves
concerning. Additionally, GD has seen a large decline in their ability to generate sales from
their fixed assets, demonstrated in the Fixed Asset Turnover. GD may need to re-evaluate
and align their fixed assets and inventories, due to the company’s increased acquisitions.
GD was ahead of NOC from 2009 to 2011 in the ratios: Profit Margin on Sales, Return on
Assets, and Return on Equity, yet experienced a decline from 2012 to 2013. GD appears to
have recovered, and is upwardly trending in the ratios, proving to be a true competitor and
likely continued threat to NOC in the future.
According to the Industry’s ratio analysis, in 2009 and prior, the top 10-company Industry
as a whole seems to have experienced a less-favorable environment. The Industry Debt
Ratio was at a high of 80% in 2009, yet appears to have recovered. Troublingly, the Debt
Ratio trend for the Industry, NOC, and GD appears to have taken an upward turn in 2014.
The Industry ratio for Profit Margin on Sales was very low at 1.6% return on sales in 2009,
yet overall has made a recovery and is on a significant upward trend. The ratios, Return on
Assets and Return on Equity confirm harder times of 2009. Macro-environmental factors
affected industry-wide companies’ net incomes, resulting in increased debt procurement.
The Industry relies heavily on inventory when configuring overall liquidity, yet the Quick
Ratio remains at a rather stably trending baseline. According to the Fixed Asset Turnover
Ratio, the Industry has seen an improvement in the management of their fixed assets.
Overall, the Industry appears to be gaining positive momentum and appears attractively
positioned with upwardly inclining trends for the year 2014.
Northrop Grumman Corporation 3
Ratio Charts and Analyses
Liquidity Ratios
Current Ratio
NOC has had ups and downs in their current ratio since 2009. In 2010, there was a slight
rise in the company’s ability to cover current liabilities, followed by a decrease in 2011, and
then a more substantial rise, reaching a peak of liquidity in 2013. This peak in 2013 was
caused by an increase in current assets, specifically cash and cash equivalents by 33%. In
2010, current assets were the highest at $13,774, an increase of 60% from 2009. This high
was from assets of discontinued operations, totaling $5,212. Liabilities were also at the
highest point at $10,027, contributing mainly to this total was the liabilities from
discontinued operations in the amount of $2,792. In 2014 the company’s liquidity has
declined slightly, mainly from a decrease in cash and equivalents by 25%. Overall NOC’s
liquidity is consistently slightly higher than their competitor GC and the industry average
for the top 10 companies.
0.0
0.2
0.4
0.6
0.8
1.0
1.2
1.4
1.6
1.8
2008 2009 2010 2011 2012 2013 2014 2015
Times
Current Ratio
NOC GD Industry
Northrop Grumman Corporation 4
GD has seen a slight decrease in their current ratio for the year 2010 with an overall increase
in current assets by 7% and increase in current liabilities by 8%. There was a slight rise in
liquidity in 2011 from an increase of 8% in current assets, contributed mainly by accounts
receivable increasing by 15% and other current assets increasing by 17%. There was another
slight decrease in 2012, caused by a slightly greater increase in current liabilities compared
to current assets. Cash and equivalents decreased by 24%, contributing mainly to the
decrease in liquidity for 2012. Similarly to NOC, GD hit a peak in 2013. GD’s peak in
2013 was due to a current asset increase to a peak of $18,162, with a current liability peak of
$12,259. The main contributors to the current asset peak of 2013 were an increase in cash
and equivalents by 61% and an increase in other current assets by 63%. In the year 2014,
the liquidity of GD started dropping back down, with increasing current liabilities by 12%,
showing mainly from an increase in customer advances and deposits by 11%.
The industry’s current ratio overall seems to appear rather stable. There was an overall low
in 2009. Since 2009, there has been an increase in current ratio by .2.
Northrop Grumman Corporation 5
Quick Ratio
NOC’s quick ratio takes a similar pattern to their current ratio, with slightly higher peaks in
the years 2010 and 2013. The peak in 2010 was caused mainly from an increase in current
assets from discontinued operations. Without the influence of discontinued operations and
inventories, current assets only increased by 3%, which shows why the liquidity decreased
the following year, in 2011 from 1.37 to 1.26, still remaining near equivalent to 2009’s
liquidity of 1.23. From the years 2011 to 2013 generally upward sloping trend occurs. The
peak in 2013 was influenced by a near 25% increase in cash and equivalents and a decrease
in current liabilities by 4%. After the peak in 2013, there has been a downward shift in
liquidity mainly due to cash and equivalents decreasing by 25%.
GD’s quick liquidity has remained more stable than the current ratio. There was less of a
high in 2013 and associated decline in 2014. Inventories during those years rose by 4% and
then fell by 11%, not accounting for inventory has yielded a more stable quick liquidity for
GD.
The top 10-company industry average of quick liquidity is substantially lower than NOC
and GD. The industry average is 0.73, while NOC’s average is 1.250 and GD’s is 1.11.
0.0
0.2
0.4
0.6
0.8
1.0
1.2
1.4
1.6
2008 2009 2010 2011 2012 2013 2014 2015
Times
Quick Ratio
NOC GD Industry
Northrop Grumman Corporation 6
Overall, the industry relies more heavily on inventory as apart of their current assets and
overall liquidity. The difference between the current and quick ratio is 0.55. NOC
maintains a high liquidity as compared to GD and the industry, without consideration for
inventory, due to their inventory type. Some of NOC’s core competencies are in the areas
of cyber security services and intelligence systems.
Northrop Grumman Corporation 7
Debt Management Ratios
Debt Ratio
NOC’s debt ratio has remained relatively stable and slightly upward sloping from the years
2009 to 2012, with an average debt ratio of 58.2% for those years. The company
experienced a slight decline in 2013, to a value of 59.74 % after the peak of 2012, at 64.16%,
returning to a debt ratio similar to 2011, at 59.32%. The peak of 2012 was caused by an
increase in pension and other post-retirement benefit plan liabilities by 49%. Due to a
difference in the Financial Accounting Standards and Cost Accounting Standards, the
estimated amount for retiree benefit plan expenses were not accurately aligned to the true
expenditure. On December 27, 2011 a rule was changed by the CAS in the measurement of pension
costs, and adjustment and allocation, including a 5-year transitional period. In result to this rule,
pension and other post-retirement benefit plan liabilities increased. Health care cost trend rate
projection has changed since the effects of new health care reform. NOC reports the company’s actual
cost experience is low at this time, yet NOC predicts the economic conditions and effects of the reform
should increase healthcare and benefit cots. (SEC, 10-k, 2011) The slight decline in 2013 was
0%
10%
20%
30%
40%
50%
60%
70%
80%
90%
2008 2009 2010 2011 2012 2013 2014 2015
Debt Ratio
NOC GD Industry
Northrop Grumman Corporation 8
mainly due to a decrease in pension and other post-retirement benefit plan liabilities by
122%. There is a slight increase in 2014, reaching this period’s high. In 2014, total
liabilities increased by 23%, while total assets increased by only 1%. The main contributor
to this increase in total liabilities was from the pension and other post-retirement benefit
plan liabilities, increasing by 122%. Throughout the years 2009 through 2014, total assets
only varied by 1% to 2%.
GD follows a near identical trend to NOC, with a slightly upward slope through the years
2009 to 2012, followed by a slight decline in 2013 and upward turn in 2014. GD
experienced a 5% increase in total assets from 2012 to 2013. This increase was contributed
from a 15% increase in total current assets, from the accounts cash and equivalents and
other current assets. Total liabilities were highest in the years of 2012, at $22,919 and
$23,526 in year 2014. In 2012, this amount was contributed from a 4% increase in total
current liabilities and an 8% increase in total noncurrent liabilities. Contributing to the 12%
increase in total liabilities from 2013 to 2014 was the current liability account, customer
advances and deposits with an increase of 11%. From 2013 to 2014, other liabilities also
increased by 32%.
For the industry data, the top 10 companies’ median values were used for the years 2009
through 2014. From 2011 to 2014, a nearly identical trend and value for the debt ratio is
seen when compared to NOC and GD. From 2009 to 2011, the industry debt ratio drops
from 80.5% to 62.5%, representing a 29% change during these years. During 2009, 80.5% of
the industry’s total assets could be funded by incurred debt. During the same year, NOC
had a debt ratio of 58.06% and GD had a debt ratio of 60.03%. The large-scaled economic
crash of 2008 could have led to higher debt levels for the year 2009 overall. NOC and GD
may be less affected due to fixed contracts with their main customer, the U.S. government.
NOC appears to be less susceptible to the market and economic fluctuations when
compared to the industry as a whole. From the date from 2009 to 2014, NOC appears to
have a consistently, slightly lower debt ratio throughout this period when compared to the
industry average and GD.
Northrop Grumman Corporation 9
Times Interest Earned Ratio
NOC has remained relatively stable throughout 2009 to 2014. The largest change in this
ratio occurred from 2010 to 2011 by 41% increase. This increase was caused by an 18%
decrease in interest expense and 16% increase in earnings before interest and taxes. Other
less significant changes occur from 2012 to 2013 by 18% decrease. This change is reflective
of interest expense increasing by 21% from $212 to $257, and earnings before interest and
taxes remaining stable. A 24% increase from 2009 to 2010 is seen due to interest expense
remaining stable and earnings before interest and taxes increasing by 24%.
GD had an upward trend from 2009 to 2011. Moving from 21.49 to 24.68 during this time.
In 2012, GD’s times interest earned plummeted, taking a 442% decrease. This was
primarily due to an added operating cost and expense, goodwill impairment in the amount
of $1,994 million. This account remained at 0$ for all other years from 2009 to 2014.
Operating costs and expenses increased by 6% from 2011 to 2012. Through the acquisitions of
over 60 businesses since 1995, good will and intangible assets have been recognized in the amount of
$1.8 billion. The fair value of each reported units was found to exceed its carrying value, representing
an unrecoverable value. GD decided to report the sum of the impairment on the 2012 10-k. GD has no
previous record of goodwill impairment, and presumes to not have another in the future. (SEC,
0
5
10
15
20
25
30
35
40
45
2008 2009 2010 2011 2012 2013 2014 2015
Times
Times Interest Earned
NOC GD Industry
Northrop Grumman Corporation 10
2012,10-k) In 2013 interest expense increased by 8%, while earnings before interest and tax
decreased by 400%, rising from $3826 in 2011 to $765 in 2012. In 2013, GD’s ratio rose
dramatically by increasing earnings before interest and taxes to $3,689 and decreasing
interest expense by 63% to $103, compared to $168 in 2012. In 2014, interest expense
remained stable, while earnings before interest and taxes increased by another 5%.
NOC maintains an average times interest earned ratio of 12, while GD’s average times
interest earned is 24.65 for the years 2009 to 2014. The industry average for this time frame
is 15.14. In 2009, the industry had a higher times interest earned ratio at 24.54, this is
followed by a decrease to 15.12 and relatively stable trend to 2014. NOC is below the
average, indicating NOC is less easily able to cover interest payments when compared to
their competitor and the industry. NOC may not be as readily able to take on additional
debt as their counterparts, yet the company’s stability with the debt they do have appear
encouraging. GD’s sharp decline in their times interest earned ratio is mainly due to a
goodwill impairment recorded for 2012. This is a noncash transaction. This decline is not
as concerning as it may appear; overall the company maintains sufficient ability to cover
their interest. GD has seen an upward trending in this ratio; GD may be able to take on
additional debt without concern in covering their interest payments.
Northrop Grumman Corporation 11
Asset Management Ratios
Inventory Turnover Ratio
NOC maintains an average inventory turnover ratio of 12.99, trending upward. From 2009
to 2011, a steady incline in the ratio is seen. A slight decrease occurs in 2012, followed by
an increase in 2013. Overall, the trend in the ratio is slowly upward; NOC has increased
their inventory turnover by 20%, when comparing the starting year, 2009 to the ending year,
2014. In 2012, Cost of Goods Sold was the lowest compared to the other years from 2008
to 2015, decreasing by 10% since 2011, exhibiting the largest change in this account for the
years 2008 to 2014. The largest change in inventory occurred from 2009 to 2010, decreasing
by 31%. The second largest change was from the years 2012 to 2013, when inventory
decreased by 14%.
GD maintains an overall average inventory ratio of 6.83 for the years 2008 to 2014. GD’s
inventory turnover ratio is steadily declining during this time, experiencing a decrease in the
ratio by 71% when comparing the starting year, 2008 to the ending year, 2014. The sharpest
decline in the ratio is seen from 2011 to 2012, decreasing by 24%. The following year the
0
2
4
6
8
10
12
14
16
18
2008 2009 2010 2011 2012 2013 2014 2015
Times
Inventory Turnover
NOC GD Industry
Northrop Grumman Corporation 12
ratio decreased by an additional 17%. From 2011 to 2012 inventory decreased by 17% and
Cost of Goods Sold decreased by 9%. Overall, throughout the years 2008 to 2014,
inventories decreased by 37% and Cost of Goods Sold decreased by 16%. The ratio showed
a year-to-year averaged decrease of 3% from 2009 to 2914.
The industry average, using the median value for the top 10 competing companies,
according to Mergent, appears stable in showing a slight decline in the ratio for the years
2009 to 2014. When comparing the start of this period to the end, the ratio decreased by
9%. The year-to-year average decrease is 2%. From 2009 to 2011, a slight increase occurs
in the ratio, increasing by 4% in 2009 and 1% in 2010. GD’s ratio is quite lower than the
industry average. GD specializes in larger crafted inventory items, while others included in
the industry average focus on other aspects, such as intelligence, cyber security, and
systems.
Northrop Grumman Corporation 13
Days Sales Outstanding Ratio
The figures calculated for NOC and GD’s graphs were used given the annual, 365-day
period.
NOC remained rather stable through 2009 and 2014. There was a slightly downward trend
in the ratio until 2011, decreasing by 4% and 5% for the years 2009 and 2010. In 2011 there
was a small change with a 1% increase. The largest change occurred from 2013 and 2014,
when the number of days outstanding increased by 7%. This was due to a relatively low
amount of sales compared to other years of sale throughout 2009 to 2014 of $23,979.
Overall, NOC decreased their days outstanding from 44.8 days in 2009 to 42.7 days in 2014.
Through the years 2009 to 2014, GD’s average days until collection are 47.2. In 2009, GD
collected payment in 41.9 days, while in 2014, the company collected in 47.9 days. GD’s
Days Sales Outstanding increases from 2009 to 2013, by a year-to-year average of 5%. The
largest increase is seen from 2010 to 2011, when the days increased by 13% from 43 to 49
days. A slight decline in the days sales outstanding occurs from 2013 to 2014, by 8%. From
2010 to 2011 accounts receivable increased by 13%, while sales only increased by 1%. In
2014, accounts receivable decreased by 8%, while sales did not change.
0
10
20
30
40
50
60
2008 2009 2010 2011 2012 2013 2014 2015
Days
Days Sales Outstanding
NOC GD Industry
Northrop Grumman Corporation 14
NOC, GD, and the industry are all fairly similar in their days of sales outstanding ratio,
calculating with 365-day annual period. The averages were as follows: NOC 42.13 days;
GD 47.28 days; industry 48.049 days. Some larger gaps occur when comparing NOC and
GD’s number of days outstanding. In 2013, there is a difference of 11.8 days. GD starts in
2009, below the industry average, but from 2011 to 2014 GD remains above the industry
and NOC. GD is experiencing a longer amount of days until the company collects, this
may be signifying a negative trend in their ability to collect payments. There are some
significant factors that may be effecting the days of uncollected sales. NOC and GD both
contract most of their sales through their main customer, the United States government.
This may yield longer wait times for payment, due to processing times, than other
industries. GD is also positioned NOC and the industry in inventory turnover, yet profit
margins on sales remain high. This may indicate GD is selling larger ticketed items. Larger
individual accounts and big inventory item sales may increase the collection time required,
compared with selling smaller inventory items. GD may be more flexible in collecting
payments, providing customers with a longer collection time, due to the high cost of the
item to the consumer.
Northrop Grumman Corporation 15
Total Assets Turnover Ratio
Aside from an increase in 2011, NOC’s Total Asset Turnover declines each year. An
increase of 14% in NOC’s Total Asset Turnover is seen from the year 2010 to 2011. The
following year, the ratio declines by 9%. In 2011, total assets decreased by 24%, while sales
decreased by 7%. Year-to-year total assets and sales declined by the same amount, an
averaged 3%. Comparing the year 2009 to 2014, total assets decreased by 14%, and sales
decreased by 15%.
GD’s Total Asset Turnover ratio downwardly trends from 2009 to 2014. Decreasing by a
year-to-year average of 3%. Comparing year 2009 to 2014, a decline of 18% is seen in the
ratio. Year-to-year GD’s total assets increased by 2%, while sales declined by 1%.
Comparing the year 2009 to 2014, total assets increased by 12%, while sales declined by 4%.
In 2012, sales declined by 5%. In 2011, a 7% increase is observed in GD’s total assets.
The industry’s Total Asset Turnover remains fairly level throughout the period. Overall, the
industry’s total asset turnover experienced a decrease of 1% each year. The largest change
in the ratio occurs from the years 2010 to 2011, decreasing by 3%. GD starts at a higher
0.0
0.2
0.4
0.6
0.8
1.0
1.2
2008 2009 2010 2011 2012 2013 2014 2015
Times
Total Asset Turnover
NOC GD Industry
Northrop Grumman Corporation 16
figure in the starting year, yet follows a similar declining trend through the years. When
both the industry and GD declined in 2011, NOC experienced an increase in their ratio.
Fixed Assets Turnover Ratio
NOC’s Fixed Asset Turnover takes a sharp incline from 2009 to 2010 by a 39% increase in
the ratio, followed by a slight decline in 2011 of 7%. From 2011 to 2013 the ratio remains
stable at a minimal incline of 1%. From the year 2013 to 2014 a downward turn in the ratio
occurs of 10%. In 2010, net fixed assets declined by 60%, while sales increased by only 2%.
This contributes to the sharp incline seen in the ratio. In the following year, net fixed assets
remained unchanged, and sales decreased by 7%. From 2011 to 2013, fixed assets and sales
decrease proportion to each other.
GD’s Fixed Asset Turnover starts higher than both the industry and NOC, at a ratio value
of 1.0, then downwardly trends to a value of 0.87. The largest decline in the ratio occurs
from 2010 to 2012, decreasing by 3%, 6%, and 4%. Year-to-year, the ratio decreases by 3%.
An 18% decrease is seen from the starting to end ratio value. In 2011, fixed assets increased
0.0
2.0
4.0
6.0
8.0
10.0
12.0
2008 2009 2010 2011 2012 2013 2014 2015
Times
Fixed Asset Turnover
NOC GD Industry
Northrop Grumman Corporation 17
by 10%, while sales increased by 1%, contributing to the largest decline in the ratio. In
2012, fixed assets increased again by 3%, while sales decreased by 5%. GD’s sales decrease
on average year-to-year by 1%, while fixed assets increased year-to-year by 3%.
The industry data for the Fixed Asset Turnover ratio remains an overall flat trend from 2009
to 2014, with a slight upward trend presented with an averaged 1% increase year-to-year.
The largest change is seen in 2012 when a 7% increase is observed, creating a slightly
upward rise in the trend. The industry ratio compared to GD and NOC vary significantly in
year 2009. The industry ratio starts at 7.36, GD at 10.98, and NOC at 5.68. Other than in
year 2009, NOC appears to remain over the industry average, yet a downward dive is seen
in 2014, as it nearly approaches the industry ratio. GD is positioned well above the industry
average during much of the period. GD’s ratio value nearly reaches NOC’s in the years
2012 and 2013. There is a wide divide in GD’s ratio value when compared to the values of
NOC and the industry from the years 2009 to 2011. From 2012 to 2014, the ratio values of
the industry, NOC, and GD are the closest in range. The largest difference in 2014’s ratio
value was 1.61, between GD and the industry, while year 2009’s ratio value difference was
5.3, between GD and NOC
Northrop Grumman Corporation 18
Profitability Ratios
Profit Margin on Sales
NOC’s Profit Margin on Sales ratio has a steady upward trend from 2009 to 2011, followed
by a slight decline from 2011 to 2013. From 2013 to 2014 there is an upward curve. For the
first 2 years, the ratio increased by 16 and 9%. The ratio decreased by 2% in 2012, due to
net income’s decrease of 7% and sales decrease of 5%. Sales have remained in a stable
decline year-to-year by an average 3%. Net Income increases by a year-to-year average of
4%. From 2009 to 2014, Net Income has increased by 19%, showing steady growth in
revenues gained on sales. According to this ratio, it appears NOC is adequately and
efficiently managing their costs in relation to their sales, as the company is steadily
increasing profit margins.
Disregarding the year 2012, GD’s Profit Margin on Sales ratio has remained fairly
consistent with a gradual upward trend from 2009 to 2014. The significantly sharp decline
in 2012 is mainly due to the goodwill impairment affecting GD’s net income by a decrease
-2%
0%
2%
4%
6%
8%
10%
2008 2009 2010 2011 2012 2013 2014 2015
Profit Margin on Sales
NOC GD Industry
Northrop Grumman Corporation 19
of 861% from 2011, as previously discussed in the times interest earned analysis. Since the
transaction is non-cash, GD’s analysis should be evaluated for the company’s overall
trending. GD’s profit margin ratio increased by 9% from the starting figure to ending figure.
Sales decreased year-to-year by an averaged 1%. In 2014 sales remained the same, while net
income increased by 7%.
The industry’s Profit Margin on Sales ratio is substantially lower than GD and NOC. The
industry’s ratio trends upward throughout the period, with a more substantial rise in 2010
by 52%, followed by a slight decline of 23% in 2011. In 2012 a larger increase is seen in the
ratio with a rise by 32%. On average, the ratio rose year-to-year by 15%. The average profit
margins are: NOC 0.08, GD O.06, and industry 0.04.
NOC and GD’s higher ratios, in comparison to the top 10-industry average, may indicate
adequate managing of expenses in relation to sales. A good proportion of GD and NOC’s
sales are being converted into net income. The industry’s overall ratio may suggest past
performance of high expenses in relation to overall sales. GD had a higher profit margin in
the years 2009 and 2010, prior to the disturbance in the ratio caused by the goodwill
impairment. In 2014, GD’s profit margins remain just under NOCs. While GD has a
lower profit margin ratio, the company’s times interest earned ratio is significantly higher
than NOCs. The stability of GD’s return on sales may indicate the company could
responsibility take on more debt with success. Both GD and NOC appear to maintain
lower expenses and higher overall sales when compared to the industry average. GD’s sales
appear to be declining by an averaged 1% year-to-year, while NOC’s sales declined by 3%
year-to-year.
Northrop Grumman Corporation 20
Return on Total Assets
The Return on Assets Ratio shows a similar trending to the Profit Margin on Sales.
NOC’s ratio is observed to trend more sharply at an incline from 2009 to the peak in 2011.
The peak in 2011 is slightly higher than the peak for the profit margin ratio. There is a slight
decline from 2012 to 2013, followed by a gradual upward trend to 2014. From the starting
value to finishing value, an increase by 28% in the return on assets ratio occurred. The rise
from 2009 to 2011 is due to the increase in net income by 20% in 2010 and decrease in total
assets by 24% in 2011. Influencing the downward trends from 2010 to 2011 in both the
current and quick ratio, these decreases represent the decrease in current assets by 78% for
those years. This decrease in current assets contributes to the change in total assets
influencing the Return on Asset Ratio contributing to the decrease of 24% in total assets
during the same years. The decrease in total assets and simultaneous increase in net income
by 3% in 2011 explains the sharp rise in the Return on Assets Ratio. The ratio decline from
the peak of 2011 to 2013 corresponds with a 7 and 1% decrease in net income during those
years. Product sales decreased by 9% from 2011 to 2012, decreasing total sales by 5%,
-2%
0%
2%
4%
6%
8%
10%
2008 2009 2010 2011 2012 2013 2014 2015
Return on Assets
NOC GD Industry
Northrop Grumman Corporation 21
down by 12% from 2010. The ending upward trend in 2014 is due to a 6% increase in net
income.
In NOC’s SEC 2012 Statement of Earnings and Comprehensive Income, a reported value of
$3,130 is given.
GD’s Return on Asset Ratio shows a slight declining trend from 2009 to 2011, a downward
turn in 2011, a sharp decline and rise from 2011 to 2013, with a slight rise in 2014. The
sharp decline in 2012 was mainly due to Goodwill Impairment’s effect on net income. To
assume a more realistic normality, removing the decline in 2012, GD’s average ROA was
7.36. With 2012 removed, ROA from 2011 to 2012 decreased by 9%. The previous year,
from 2010 to 2011, the ratio decreased by 11%. This decline is in result of a simultaneous
increase in total assets by 7% and decrease in net income by 4%. Total assets increased
mainly in response to an increase in accounts receivable by 13%. This same increase was
the contributor to the largest change in the days sales outstanding ratio, increasing the
number of days by 6.13 days. Other assets also increased by 11% from the previous year,
along with other current assets increasing by 15%. From 2011 to 2013 a large increase is
noted in current assets. From 2011 to 2013 there’s a rise in GD’s current ratio by 7%,
largely due to an increase of 15% in current assets from 2011 to 2013. In the current assets,
cash and equivalents increased by 50% from 2011 to 2013. The combining factors on this
asset increase and decrease in net income, resulted in the decline from 2011 to 2013,
disregarding the effects of the goodwill impairment.
The industry averages are much lower in ROA compared to GD and NOC. Held assets in
the industry may be incurring too high of costs when compared to the income being
generated by the same asset. There is an upward trend in the industry ROA, with a sharp
increase from 2009 to 2010, followed by a slight downturn in 2011. From 2011 to 2014, the
industry ROA gradually inclines. In 2009, ROA was rather low compared to 2014,
represented by a change of 64%. Similar to profit margin, wide fluctuations are observed
from 2010 to 2012. Due to the similar trending in ROA and profit margin, it seems net
income was generally low and fluctuating in the industry as a whole.
GD’s sharp decline in ROA in 2011 is largely due to goodwill impairment, however an
increase in product costs and expenses occurred by 6% from 2011 to 2012, and sales of
products sold decreased by 11% from 2010 to 2012. This may lead to the conclusion that
GD’s product costs were too excessive to support the sales incurred from products from
2010 to 2012.
Northrop Grumman Corporation 22
Return on Equity
NOC’s Return on Equity ratio trends below their competitor from 2009 to 2011. The ratio
has an upward shift from 2010 to 2011, followed by a slight downfall from 2012 to 2013.
NOC’s ROE makes a sharp incline from 2013 to 2014, reaching 28.6%. NOC’s ROE has a
year-by-year increase of an averaged 13%. Positioned well above the industry, from 2009 to
2014, the ratio has increased by 54%. NOC’s ROA and PMS show similar increasing
trends, contributed by the fact that the company’s net income did experience a 6% increase
from 2013 to 2014, and increased each year by an averaged 2%. However, this sharper rise
from 2013 to 2014, specific to ROE is caused by the strong decline of 47% in owner’s equity.
Upon recent acquisitions, NOC’s current position demonstrates their success in using
investor’s funds more efficiently in profit generation. Shifting upward trends should
increase investor’s confidence in management’s decisions.
GD’s Return on Equity ratio trends above NOC and the industry for 2009 and 2010. ROE
shifts to a sharp decline in 2011, as acquisitions have been reassessed. GD’s goodwill
impairment affected the shape decline seen in ROE for 2012. During this year net income
plummeted by 861%. Additionally, product costs and expenses increased costs by 6%,
-5%
0%
5%
10%
15%
20%
25%
30%
35%
2008 2009 2010 2011 2012 2013 2014 2015
Return on Equity
NOC GD Industry
Northrop Grumman Corporation 23
while sales from products sold by 8% from 2011 to 2012. GD has undergone changes in
their product focus and core competencies, as the market has shifted areas of demand.
GD’s ROE ratio takes a sharper incline in 2014, when compared to ROA and Profit Margin
on Sales. This is mainly due to a decrease in owners’ equity by 23%. All of GD’s
profitability ratios are positioned towards an upward trending due to a 7% rise in net income
for the year 2014.
In 2009, ROE for the industry was at a low of 4.74%. This low in 2009 is congruent other
ratios, ROA, Profit Margin on Sales, Debt ratio, and Current ratio. 2009 there was an
overall more hostile market environment. It appears the industry was selling their inventory
at a faster rate to attempt to increase profits and net income, yet at a lower price in the
market. This is demonstrated by a high inventory turnover ratio and low profit margin on
sales.
From 2009 to 2012, the industry’s ROE ratio shows a strong upward shift, demonstrating a
successful recovery from the market environment, which brought lows in 2009. The largest
increase in seen from 2011 to 2012, when ROE increased by 43%. However, the next year,
a sharp decline is seen as the ratio falls by 50%. ROE is now on another upward trend, yet
remains below GD and NOC. On average, ROE has increased by 16% each year, showing
successful market incline since 2009, with a starting and ending difference depicted by an
increase of 71% in the ratio.
Northrop Grumman Corporation 24
DuPont Analyses
Return on Total Assets
ROA= (Profit Margin) x (Total Asset Turnover)
ROA= (Net Income/Sales) x (Sales/Total Assets) = Net Income/Total Assets
NOC
ROA= 2,069 x 23,979
23,979 26,572
0.086283832 x 0.902416077 = 7.79%
GD
ROA= 2,533 x 30,852
30,852 35,355
0.0821016 x 0.8726347 = 7.16%
NOC maintains a higher ROA than GD. Both of NOC’s profit margin and total asset
turnover excel that of GDs. While NOC’s DuPont is a more favorable value than GDs,
GD’s overall profit margin was influenced by a large change in net income. Due to this, the
companies may be more neutrally aligned than the DuPont depicts. However, DuPont’s
lower value for GD’s total asset turnover is accurate, and the company’s overall decreasing
trend raises concern. This decrease may be linked to the fact that GD is turning over less of
their inventory; GD’s inventory turnover is also on a sharp downward trend. GD maintains
a relatively high profit margin on the inventory the company is selling, and with the shifting
upward trend in profit margin on sales, it appears each individual inventory item GD is
selling is bringing larger profits. GD may be shifting towards selling an increased amount of
their larger inventory items, rather than total inventory. This shift in selling may be caused
by the change in market demand, affected by the global changes in national defense needs
and increasing security threats.
Northrop Grumman Corporation 25
Return on Equity
ROE= Net Income/Owner’s Equity
ROE= (Profit Margin) x (Total Asset Turnover) x (Equity Multiplier)
ROE – (Net Income/Sales) x (Sales/Total Assets) x (1/1-debt ratio)
NOC
ROE= 2,069 x 23,979 x 1
23,979 26,572
(1-
.7277)
0.086283832 x 0.902416077 x 3.672 = 28.59%
GD
ROE= 2,533 x 30,852 x 1
30,852 35,355
(1-
.6654)
0.0821016 x 0.8726347 x 2.989 = 21.41%
NOC is positioned significantly higher than GD in ROE. This difference is much more
substantial than their positions in ROA. NOC has a better equity multiplier than GD,
largely influencing the ROE in the DuPont analysis. NOC has much greater financial
leverage at this time than GD. While NOC’s total asset turnover has downward shifted, the
company’s inventory turnover has shifted upward. The company is selling more of their
inventory, most likely due to the market’s overall increasing demand. NOC is selling
inventory at adequate pricing, as depicted by the consistency in the upward trending in the
profit margin on sales ratio. NOC should review their asset management to ensure their
assets continue to generate an adequate amount of sales.
GD may need to review their inventory and assets management. According to the
company’s 10-k, GD has had many new acquisitions, effecting the 2009 to 2014 ratios.
While management’s acquisition decisions are done in hopes to broaden GD’s future
successes, these changes have shifted the companies positioned to below their competitor for
Northrop Grumman Corporation 26
this time. Concern raised for management’s overvaluing of their new acquisitions, may be
supported by the significant goodwill impairment that effected net income in 2011. The
company’s inventory turnover ratio is below the average market; this may be explained by
describing the differences in their products when compared to other companies in the
industry, however there are some trends that should raise awareness. While, their position
as a whole is relatively stable, the decreasing trend in total asset turnover, and large
downward shift in this ratio is congruent with the position of company’s ROE from the
years 2011 to 2014. GD’s ratios were on a higher averaged trend, above NOC prior to the
2011 to 2014 shift. The company’s fluctuations may be warranted, if revenues are projected
to increase. ROE has turned and is trending upwards, however asset management needs to
be evaluated, as the trend for Total Asset Turnover has not changed in 2014, and persists at
a decline. The inventory the company is selling, must be selling at higher prices, due to the
upward trend in the company’s profit margin on sales.
Northrop Grumman Corporation 27
Excel Spreadsheet Printouts
NOC Spreadsheet
Northrop Grumman Corporation 28
GD Spreadsheet
Northrop Grumman Corporation 29
Excel Ratio Checking Spreadsheet Printouts
NOC Checker
GD Checker
Northrop Grumman Corporation 30
SEC Financial Statements for GD
CONSOLIDATED STATEMENTS OF EARNINGS (LOSS) 2014
Year Ended December 31
(Dollars in millions, except per-share amounts) 2014 2013 2012
Revenues:
Products $ 19,564 $ 19,100 $ 19,264
Services 11,288 11,830 11,728
30,852 30,930 30,992
Operating costs and expenses:
Products 15,335 15,065 15,830
Services 9,644 10,137 10,182
Goodwill impairment — — 1,994
General and administrative (G&A) 1,984 2,039 2,221
26,963 27,241 30,227
Operating earnings 3,889 3,689 765
Interest, net (86) (86) (156)
Other, net (1) 8 (136)
Earnings from continuing operations before income tax 3,802 3,611 473
Provision for income tax, net 1,129 1,125 854
Earnings (loss) from continuing operations 2,673 2,486 (381)
Discontinued operations, net of tax of ($16) in 2014, ($73) in
2013, and $19 in 2012 (140) (129) 49
Net earnings (loss) $ 2,533 $ 2,357 $ (332)
Earnings (loss) per share
Basic:
Continuing operations $ 7.97 $ 7.09 $ (1.08)
Discontinued operations (0.41) (0.37) 0.14
Net earnings (loss) $ 7.56 $ 6.72 $ (0.94)
Diluted:
Continuing operations $ 7.83 $ 7.03 $ (1.08)
Discontinued operations (0.41) (0.36) 0.14
Net earnings (loss) $ 7.42 $ 6.67 $ (0.94)
The accompanying Notes to Consolidated Financial Statements are an integral part of these statements.
(Dollars in millions) 2014 2013 2012
Net earnings (loss) $ 2,533 $ 2,357 $ (332)
(Losses) gains on cash flow hedges (279) 3 (23)
Northrop Grumman Corporation 31
Unrealized gains on securities 10 12 6
Foreign currency translation adjustments (436) (118) 141
Change in retirement plans’ funded status (1,745) 2,595 (1,149)
Other comprehensive (loss) income, pretax (2,450) 2,492 (1,025)
(Benefit) provision for income tax, net (703) 902 (562)
Other comprehensive (loss) income, net of tax (1,747) 1,590 (463)
Comprehensive income (loss) $ 786 $ 3,947 $ (795)
The accompanying Notes to Consolidated Financial Statements are an integral part of these statements.
CONSOLIDATED BALANCE SHEETS
December 31
(Dollars in millions) 2014 2013
ASSETS
Current assets:
Cash and equivalents $ 4,388 $ 5,301
Accounts receivable 4,050 4,370
Contracts in process 4,591 4,780
Inventories 3,221 2,890
Other current assets 1,157 821
Total current assets 17,407 18,162
Noncurrent assets:
Property, plant and equipment, net 3,329 3,359
Intangible assets, net 912 1,044
Goodwill 11,731 11,932
Other assets 1,976 997
Total noncurrent assets 17,948 17,332
Total assets $ 35,355 $ 35,494
LIABILITIES AND SHAREHOLDERS’ EQUITY
Current liabilities:
Short-term debt and current portion of long-term debt $ 501 $ 1
Accounts payable 2,057 2,216
Customer advances and deposits 7,335 6,584
Other current liabilities 3,858 3,458
Total current liabilities 13,751 12,259
Noncurrent liabilities:
Long-term debt 3,410 3,908
Other liabilities 6,365 4,826
Commitments and contingencies (see Note N)
Total noncurrent liabilities 9,775 8,734
Northrop Grumman Corporation 32
Shareholders’ equity:
Common stock 482 482
Surplus 2,548 2,226
Retained earnings 21,127 19,428
Treasury stock (9,396) (6,450)
Accumulated other comprehensive loss (2,932) (1,185)
Total shareholders’ equity 11,829 14,501
Total liabilities and shareholders’ equity $ 35,355 $ 35,494
The accompanying Notes to Consolidated Financial Statements are an integral part of these statements.
CONSOLIDATED STATEMENTS OF EARNINGS (LOSS) 2013
Year Ended December 31
(Dollars in millions, except per-share amounts) 2011 2012 2013
Revenues:
Products $ 21,440 $ 19,784 $ 19,371
Services 11,237 11,729 11,847
32,677 31,513 31,218
Operating costs and expenses:
Products 17,230 16,228 15,296
Services 9,591 10,182 10,158
Goodwill impairment — 1,994 —
General and administrative (G&A) 2,030 2,276 2,079
28,851 30,680 27,533
Operating earnings 3,826 833 3,685
Interest, net (141) (156) (86)
Other, net 33 (136) 8
Earnings from continuing operations before income taxes 3,718 541 3,607
Provision for income taxes, net 1,166 873 1,121
Earnings (loss) from continuing operations 2,552 (332) 2,486
Discontinued operations, net of tax (26) — (129)
Net earnings (loss) $ 2,526 $ (332) $ 2,357
Earnings (loss) per share
Basic:
Continuing operations $ 7.01 $ (0.94) $ 7.09
Northrop Grumman Corporation 33
Discontinued operations (0.07) — (0.37)
Net earnings (loss) $ 6.94 $ (0.94) $ 6.72
Diluted:
Continuing operations $ 6.94 $ (0.94) $ 7.03
Discontinued operations (0.07) — (0.36)
Net earnings (loss) $ 6.87 $ (0.94) $ 6.67
The accompanying Notes to Consolidated Financial Statements are an integral part of these statements.
CONSOLIDATED STATEMENTS OF COMPREHENSIVE INCOME (LOSS)
Year Ended December 31
(Dollars in millions) 2011 2012 2013
Net earnings (loss) $ 2,526 $ (332) $ 2,357
Gains (losses) on cash flow hedges (81) (23) 3
Unrealized gains (losses) on securities (1) 6 12
Foreign currency translation adjustments (89) 141 (118)
Change in retirement plans’ funded status (1,129) (1,149) 2,595
Other comprehensive income (loss) before tax (1,300) (1,025) 2,492
Provision (benefit) for income tax, net (424) (562) 902
Other comprehensive income (loss), net of tax (876) (463) 1,590
Comprehensive income (loss) $ 1,650 $ (795) $ 3,947
The accompanying Notes to Consolidated Financial Statements are an integral part of these statements
CONSOLIDATED BALANCE SHEETS
December 31
(Dollars in millions) 2012 2013
ASSETS
Current assets:
Cash and equivalents $ 3,296 $ 5,301
Accounts receivable 4,204 4,402
Northrop Grumman Corporation 34
Contracts in process 4,964 4,780
Inventories 2,776 2,968
Other current assets 504 435
Total current assets 15,744 17,886
Noncurrent assets:
Property, plant and equipment, net 3,403 3,415
Intangible assets, net 1,383 1,217
Goodwill 12,048 11,977
Other assets 1,731 953
Total noncurrent assets 18,565 17,562
Total assets $ 34,309 $ 35,448
LIABILITIES AND SHAREHOLDERS’ EQUITY
Current liabilities:
Accounts payable $ 2,469 $ 2,248
Customer advances and deposits 6,042 6,584
Other current liabilities 3,109 3,362
Total current liabilities 11,620 12,194
Noncurrent liabilities:
Long-term debt 3,908 3,908
Other liabilities 7,391 4,845
Commitments and contingencies (see Note N)
Total noncurrent liabilities 11,299 8,753
Shareholders’ equity:
Common stock 482 482
Surplus 1,988 2,226
Retained earnings 17,860 19,428
Treasury stock (6,165) (6,450)
Accumulated other comprehensive loss (2,775) (1,185)
Total shareholders’ equity 11,390 14,501
Total liabilities and shareholders’ equity $ 34,309 $ 35,448
The accompanying Notes to Consolidated Financial Statements are an integral part of these statements.
CONSOLIDATED STATEMENTS OF EARNINGS (LOSS) 2012
Year Ended December 31
(Dollars in millions, except per-share amounts) 2010 2011 2012
Northrop Grumman Corporation 35
Revenues:
Products $ 21,723 $ 21,440 $ 19,784
Services 10,743 11,237 11,729
32,466 32,677 31,513
Operating costs and expenses:
Products 17,359 17,230 16,228
Services 9,198 9,591 10,182
Goodwill impairment — — 1,994
General and administrative (G&A) 1,964 2,030 2,276
28,521 28,851 30,680
Operating earnings 3,945 3,826 833
Interest, net (157) (141) (156)
Other, net 2 33 (136)
Earnings from continuing operations before income taxes 3,790 3,718 541
Provision for income taxes, net 1,162 1,166 873
Earnings (loss) from continuing operations 2,628 2,552 (332)
Discontinued operations, net of tax (4) (26) —
Net earnings (loss) $ 2,624 $ 2,526 $ (332)
Earnings (loss) per share
Basic:
Continuing operations $ 6.89 $ 7.01 $ (0.94)
Discontinued operations (0.01) (0.07) —
Net earnings (loss) $ 6.88 $ 6.94 $ (0.94)
Diluted:
Continuing operations $ 6.82 $ 6.94 $ (0.94)
Discontinued operations (0.01) (0.07) —
Net earnings (loss) $ 6.81 $ 6.87 $ (0.94)
The accompanying Notes to Consolidated Financial Statements are an integral part of these statements.
CONSOLIDATED STATEMENTS OF COMPREHENSIVE INCOME (LOSS)
Year Ended December 31
(Dollars in millions) 2010 2011 2012
Net earnings (loss) $ 2,624 $ 2,526 $ (332)
Net gain (loss) on cash flow hedges 89 (81) (23)
Unrealized gains (losses) on securities 1 (1) 6
Foreign currency translation adjustments 308 (89) 141
Northrop Grumman Corporation 36
Change in retirement plans’ funded status (878) (1,129) (1,149)
Other comprehensive loss before tax (480) (1,300) (1,025)
Benefit for income tax, net (251) (424) (562)
Other comprehensive loss, net of tax (229) (876) (463)
Comprehensive income (loss) $ 2,395 $ 1,650 $ (795)
The accompanying Notes to Consolidated Financial Statements are an integral part of these statements.
CONSOLIDATED BALANCE SHEETS
December 31
(Dollars in millions) 2011 2012
ASSETS
Current assets:
Cash and equivalents $ 2,649 $ 3,296
Accounts receivable 4,429 4,204
Contracts in process 5,168 4,964
Inventories 2,310 2,776
Other current assets 812 504
Total current assets 15,368 15,744
Noncurrent assets:
Property, plant and equipment, net 3,284 3,403
Intangible assets, net 1,813 1,383
Goodwill 13,576 12,048
Other assets 842 1,731
Total noncurrent assets 19,515 18,565
Total assets $ 34,883 $ 34,309
LIABILITIES AND SHAREHOLDERS’ EQUITY
Current liabilities:
Accounts payable $ 2,895 $ 2,469
Customer advances and deposits 5,011 6,042
Other current liabilities 3,239 3,109
Total current liabilities 11,145 11,620
Noncurrent liabilities:
Long-term debt 3,907 3,908
Other liabilities 6,599 7,391
Commitments and contingencies (See Note N)
Total noncurrent liabilities 10,506 11,299
Shareholders’ equity:
Common stock 482 482
Northrop Grumman Corporation 37
Surplus 1,888 1,988
Retained earnings 18,917 17,860
Treasury stock (5,743) (6,165)
Accumulated other comprehensive loss (2,312) (2,775)
Total shareholders’ equity 13,232 11,390
Total liabilities and shareholders’ equity $ 34,883 $ 34,309
The accompanying Notes to Consolidated Financial Statements are an integral part of these statements.
CONSOLIDATED STATEMENT OF EARNINGS 2011
Year Ended December 31
(Dollars in millions, except per-share amounts) 2009 2010 2011
Revenues:
Products $ 21,977 $ 21,723 $ 21,440
Services 10,004 10,743 11,237
31,981 32,466 32,677
Operating costs and expenses:
Products 17,808 17,359 17,230
Services 8,544 9,198 9,591
General and administrative 1,954 1,964 2,030
28,306 28,521 28,851
Operating earnings 3,675 3,945 3,826
Interest, net (160) (157) (141)
Other, net (2) 2 33
Earnings from continuing operations before income taxes 3,513 3,790 3,718
Provision for income taxes, net 1,106 1,162 1,166
Northrop Grumman Corporation 38
Earnings from continuing operations 2,407 2,628 2,552
Discontinued operations, net of tax (13) (4) (26)
Net earnings $ 2,394 $ 2,624 $ 2,526
Earnings per share
Basic:
Continuing operations $ 6.24 $ 6.89 $ 7.01
Discontinued operations (0.03) (0.01) (0.07)
Net earnings $ 6.21 $ 6.88 $ 6.94
Diluted:
Continuing operations $ 6.20 $ 6.82 $ 6.94
Discontinued operations (0.03) (0.01) (0.07)
Net earnings $ 6.17 $ 6.81 $ 6.87
The accompanying Notes to Consolidated Financial Statements are an integral part of this statement.
36 General Dynamics Annual Report 2011
CONSOLIDATED BALANCE SHEET
December 31
(Dollars in millions) 2010 2011
ASSETS
Current assets:
Cash and equivalents $ 2,613 $ 2,649
Accounts receivable 3,848 4,452
Contracts in process 4,873 5,168
Inventories 2,158 2,310
Northrop Grumman Corporation 39
Other current assets 694 789
Total current assets 14,186 15,368
Noncurrent assets:
Property, plant and equipment, net 2,971 3,284
Intangible assets, net 1,992 1,813
Goodwill 12,649 13,576
Other assets 747 842
Total noncurrent assets 18,359 19,515
Total assets $ 32,545 $ 34,883
LIABILITIES AND SHAREHOLDERS’ EQUITY
Current liabilities:
Short-term debt and current portion of long-term debt $ 773 $ 23
Accounts payable 2,736 2,895
Customer advances and deposits 4,465 5,011
Other current liabilities 3,203 3,216
Total current liabilities 11,177 11,145
Noncurrent liabilities:
Long-term debt 2,430 3,907
Other liabilities 5,622 6,599
Commitments and contingencies (see Note N)
Total noncurrent liabilities 8,052 10,506
Shareholders’ equity:
Northrop Grumman Corporation 40
Common stock 482 482
Surplus 1,729 1,888
Retained earnings 17,076 18,917
Treasury stock (4,535) (5,743)
Accumulated other comprehensive loss (1,436) (2,312)
Total shareholders’ equity 13,316 13,232
Total liabilities and shareholders’ equity $ 32,545 $ 34,883
The accompanying Notes to Consolidated Financial Statements are an integral part of this statement.
General Dynamics Annual Report 2011 37
CONSOLIDATED STATEMENT OF EARNINGS 2010
Year Ended December 31
(Dollars in millions, except per-share amounts) 2008 2009 2010
Revenues:
Products $ 20,185 $ 21,977 $ 21,619
Services 9,115 10,004 10,847
29,300 31,981 32,466
Operating costs and expenses:
Products 16,230 17,808 17,253
Services 7,698 8,544 9,304
General and administrative 1,719 1,954 1,964
25,647 28,306 28,521
Operating earnings 3,653 3,675 3,945
Northrop Grumman Corporation 41
Interest, net (66) (160) (157)
Other, net 17 (2) 2
Earnings from continuing operations before income taxes 3,604 3,513 3,790
Provision for income taxes, net 1,126 1,106 1,162
Earnings from continuing operations 2,478 2,407 2,628
Discontinued operations, net of tax (19) (13) (4)
Net earnings $ 2,459 $ 2,394 $ 2,624
Earnings per share
Basic:
Continuing operations $ 6.26 $ 6.24 $ 6.89
Discontinued operations (0.05) (0.03) (0.01)
Net earnings $ 6.21 $ 6.21 $ 6.88
Diluted:
Continuing operations $ 6.22 $ 6.20 $ 6.82
Discontinued operations (0.05) (0.03) (0.01)
Net earnings $ 6.17 $ 6.17 $ 6.81
The accompanying Notes to Consolidated Financial Statements are an integral part of this statement.
36 General Dynamics Annual Report Ÿ 2010
CONSOLIDATED BALANCE SHEET
December 31
(Dollars in millions) 2009 2010
ASSETS
Northrop Grumman Corporation 42
Current assets:
Cash and equivalents $ 2,263 $ 2,613
Accounts receivable 3,678 3,848
Contracts in process 4,449 4,873
Inventories 2,126 2,158
Other current assets 733 694
Total current assets 13,249 14,186
Noncurrent assets:
Property, plant and equipment, net 2,912 2,971
Intangible assets, net 2,098 1,992
Goodwill 12,269 12,649
Other assets 549 747
Total noncurrent assets 17,828 18,359
Total assets $ 31,077 $ 32,545
LIABILITIES AND SHAREHOLDERS’ EQUITY
Current liabilities:
Short-term debt and current portion of long-term debt $ 705 $ 773
Accounts payable 2,365 2,736
Customer advances and deposits 4,313 4,465
Other current liabilities 2,988 3,203
Total current liabilities 10,371 11,177
Noncurrent liabilities:
Northrop Grumman Corporation 43
Long-term debt 3,159 2,430
Other liabilities 5,124 5,622
Commitments and contingencies (see Note N)
Total noncurrent liabilities 8,283 8,052
Shareholders’ equity:
Common stock 482 482
Surplus 1,518 1,729
Retained earnings 15,093 17,076
Treasury stock (3,463) (4,535)
Accumulated other comprehensive loss (1,207) (1,436)
Total shareholders’ equity 12,423 13,316
Total liabilities and shareholders’ equity $ 31,077 $ 32,545
The accompanying Notes to Consolidated Financial Statements are an integral part of this statement.
General Dynamics Annual Report Ÿ 2010 37
Northrop Grumman Corporation 44
SEC Financial Statements for NOC
CONSOLIDATED STATEMENTS OF EARNINGS AND COMPREHENSIVE (LOSS) INCOME 2014
Year Ended December 31
$ in millions, except per share amounts 2014 2013 2012
Sales
Product $ 14,015 $ 14,033 $ 13,838
Service 9,964 10,628 11,380
Total sales 23,979 24,661 25,218
Operating costs and expenses
Product 10,431 10,623 10,415
Service 7,947 8,659 9,223
General and administrative expenses 2,405 2,256 2,450
Operating income 3,196 3,123 3,130
Other (expense) income
Interest expense (282) (257) (212)
Other, net 23 (3) 47
Earnings before income taxes 2,937 2,863 2,965
Federal and foreign income tax expense 868 911 987
Net earnings $ 2,069 $ 1,952 $ 1,978
Basic earnings per share $ 9.91 $ 8.50 $ 7.96
Weighted-average common shares outstanding, in millions 208.8 229.6 248.6
Diluted earnings per share $ 9.75 $ 8.35 $ 7.81
Weighted-average diluted shares outstanding, in millions 212.1 233.9 253.4
Net earnings (from above) $ 2,069 $ 1,952 $ 1,978
Other comprehensive (loss) income
Change in unamortized benefit plan costs, net of tax benefit (expense)
of $1,423 in 2014, ($1,177) in 2013 and $860 in 2012 (2,316) 1,790 (1,303)
Change in cumulative translation adjustment (59) 14 8
Other, net 3 (1) (2)
Other comprehensive (loss) income, net of tax (2,372) 1,803 (1,297)
Comprehensive (loss) income $ (303) $ 3,755 $ 681
The accompanying notes are an integral part of these consolidated financial statements.
CONSOLIDATED STATEMENTS OF FINANCIAL POSITION
December 31
Northrop Grumman Corporation 45
$ in millions 2014 2013
Assets
Cash and cash equivalents $ 3,863 $ 5,150
Accounts receivable, net 2,806 2,685
Inventoried costs, net 742 698
Deferred tax assets 404 605
Prepaid expenses and other current assets 369 350
Total current assets 8,184 9,488
Property, plant and equipment, net of accumulated depreciation of $4,611 in 2014 and
$4,337 in 2013 2,991 2,806
Goodwill 12,466 12,438
Non-current deferred tax assets 1,622 209
Other non-current assets 1,309 1,440
Total assets $ 26,572 $ 26,381
Liabilities
Trade accounts payable $ 1,305 $ 1,229
Accrued employee compensation 1,441 1,446
Advance payments and amounts in excess of costs incurred 1,713 1,722
Other current liabilities 1,433 1,418
Total current liabilities 5,892 5,815
Long-term debt, net of current portion of $3 in 2014 and $2 in 2013 5,925 5,928
Pension and other post-retirement benefit plan liabilities 6,555 2,954
Other non-current liabilities 965 1,064
Total liabilities 19,337 15,761
Commitments and contingencies (Note 11)
Shareholders’ equity
Preferred stock, $1 par value; 10,000,000 shares authorized; no shares issued and
outstanding — —
Common stock, $1 par value; 800,000,000 shares authorized; issued and outstanding:
2014—198,930,240 and 2013—217,599,230 199 218
Paid-in capital — 848
Retained earnings 12,392 12,538
Accumulated other comprehensive loss (5,356) (2,984)
Total shareholders’ equity 7,235 10,620
Total liabilities and shareholders’ equity $ 26,572 $ 26,381
The accompanying notes are an integral part of these consolidated financial statements.
-42-
Northrop Grumman Corporation 46
NORTHROP GRUMMAN CORPORATION
CONSOLIDATED STATEMENTS OF EARNINGS AND COMPREHENSIVE INCOME 2013
Year Ended December 31
$ in millions, except per share amounts 2013 2012 2011
Sales
Product $14,033 $13,838 $15,073
Service 10,628 11,380 11,339
Total sales 24,661 25,218 26,412
Operating costs and expenses
Product 10,623 10,415 11,491
Service 8,659 9,223 9,295
General and administrative expenses 2,256 2,450 2,350
Operating income 3,123 3,130 3,276
Other (expense) income
Interest expense (257) (212) (221)
Other, net (3) 47 28
Earnings from continuing operations before income taxes 2,863 2,965 3,083
Federal and foreign income tax expense 911 987 997
Earnings from continuing operations 1,952 1,978 2,086
Earnings from discontinued operations, net of tax — — 32
Net earnings $ 1,952 $ 1,978 $ 2,118
Basic earnings per share
Continuing operations $ 8.50 $ 7.96 $ 7.54
Discontinued operations — — 0.11
Basic earnings per share $ 8.50 $ 7.96 $ 7.65
Weighted-average common shares outstanding, in millions 229.6 248.6 276.8
Diluted earnings per share
Continuing operations $ 8.35 $ 7.81 $ 7.41
Discontinued operations — — 0.11
Diluted earnings per share $ 8.35 $ 7.81 $ 7.52
Weighted-average diluted shares outstanding, in millions 233.9 253.4 281.6
Net earnings (from above) $ 1,952 $ 1,978 $ 2,118
Other comprehensive income
Change in unamortized benefit plan costs, net of tax (expense) benefit
of ($1,177) in 2013, $860 in 2012 and $823 in 2011 1,790 (1,303) (1,249)
Northrop Grumman Corporation 47
Change in cumulative translation adjustment 14 8 (4)
Change in unrealized loss on marketable securities and cash flow
hedges, net of tax benefit of $1 in 2013, $0 in 2012 and $2 in 2011 (1) (2) (4)
Other comprehensive income (loss), net of tax 1,803 (1,297) (1,257)
Comprehensive income $ 3,755 $ 681 $ 861
The accompanying notes are an integral part of these consolidated financial statements.
-44-
NORTHROP GRUMMAN CORPORATION
CONSOLIDATED STATEMENTS OF FINANCIAL POSITION
December 31
$ in millions 2013 2012
Assets
Cash and cash equivalents $ 5,150 $ 3,862
Accounts receivable, net 2,685 2,858
Inventoried costs, net 698 798
Deferred tax assets 605 574
Prepaid expenses and other current assets 350 300
Total current assets 9,488 8,392
Property, plant and equipment, net of accumulated depreciation of $4,337 in 2013 and
$4,146 in 2012 2,806 2,887
Goodwill 12,438 12,431
Non-current deferred tax assets 209 1,542
Other non-current assets 1,440 1,291
Total assets $26,381 $26,543
Liabilities
Trade accounts payable $ 1,229 $ 1,392
Accrued employee compensation 1,169 1,173
Advance payments and amounts in excess of costs incurred 1,722 1,759
Other current liabilities 1,695 1,732
Total current liabilities 5,815 6,056
Long-term debt, net of current portion of $2 in 2013 and $5 in 2012 5,928 3,930
Pension and other post-retirement benefit plan liabilities 2,954 6,085
Other non-current liabilities 1,064 958
Northrop Grumman Corporation 48
Total liabilities 15,761 17,029
Commitments and contingencies (Note 12)
Shareholders’ equity
Preferred stock, $1 par value; 10,000,000 shares authorized; no shares issued and
outstanding — —
Common stock, $1 par value; 800,000,000 shares authorized; issued and outstanding:
2013—217,599,230 and 2012—239,209,812 218 239
Paid-in capital 848 2,924
Retained earnings 12,538 11,138
Accumulated other comprehensive loss (2,984) (4,787)
Total shareholders’ equity 10,620 9,514
Total liabilities and shareholders’ equity $26,381 $26,543
The accompanying notes are an integral part of these consolidated financial statements.
-45-
NORTHROP GRUMMAN CORPORATION
CONSOLIDATED STATEMENTS OF EARNINGS AND COMPREHENSIVE INCOME
2012
Year Ended December 31
$ in millions, except per share amounts 2012 2011 2010
Sales
Product $13,838 $15,073 $16,091
Service 11,380 11,339 12,052
Total sales 25,218 26,412 28,143
Northrop Grumman Corporation 49
Operating costs and expenses
Product 10,415 11,491 12,558
Service 9,223 9,295 10,291
General and administrative expenses 2,450 2,350 2,467
Operating income 3,130 3,276 2,827
Other (expense) income
Interest expense (212) (221) (269)
Charge on debt redemption — — (229)
Other, net 47 28 37
Earnings from continuing operations before income taxes 2,965 3,083 2,366
Federal and foreign income tax expense 987 997 462
Earnings from continuing operations 1,978 2,086 1,904
Earnings from discontinued operations, net of tax — 32 149
Net earnings $ 1,978 $ 2,118 $ 2,053
Basic earnings per share
Continuing operations $ 7.96 $ 7.54 $ 6.41
Discontinued operations — 0.11 0.50
Basic earnings per share $ 7.96 $ 7.65 $ 6.91
Northrop Grumman Corporation 50
Weighted-average common shares outstanding, in millions 248.6 276.8 296.9
Diluted earnings per share
Continuing operations $ 7.81 $ 7.41 $ 6.32
Discontinued operations — 0.11 0.50
Diluted earnings per share $ 7.81 $ 7.52 $ 6.82
Weighted-average diluted shares outstanding, in millions 253.4 281.6 301.1
Net earnings (from above) $ 1,978 $ 2,118 $ 2,053
Other comprehensive income
Change in cumulative translation adjustment 8 (4) (41)
Change in unrealized (loss) gain on marketable securities
and cash flow hedges, net of tax benefit of $0 in 2012, $2
in 2011, and $0 in 2010 (2) (4) 1
Change in unamortized benefit plan costs, net of tax
benefit (expense) of $860 in 2012, $823 in 2011, and
$(183) in 2010 (1,303) (1,249) 297
Other comprehensive (loss) income, net of tax (1,297) (1,257) 257
Comprehensive income $ 681 $ 861 $ 2,310
The accompanying notes are an integral part of these consolidated financial statements.
Northrop Grumman Corporation 51
43
Table of Contents
NORTHROP GRUMMAN CORPORATION
CONSOLIDATED STATEMENTS OF FINANCIAL POSITION
December 31
$ in millions 2012 2011
Assets
Cash and cash equivalents $ 3,862 $ 3,002
Accounts receivable, net of progress payments 2,858 2,964
Inventoried costs, net of progress payments 798 873
Deferred tax assets 574 496
Prepaid expenses and other current assets 300 411
Total current assets 8,392 7,746
Property, plant and equipment, net of accumulated depreciation of
$4,146 in 2012 and $3,933 in 2011 2,887 3,047
Goodwill 12,431 12,374
Non-current deferred tax assets 1,542 900
Northrop Grumman Corporation 52
Other non-current assets 1,291 1,344
Total assets $26,543 $25,411
Liabilities
Trade accounts payable $ 1,392 $ 1,481
Accrued employee compensation 1,173 1,196
Advance payments and billings in excess of costs incurred 1,759 1,777
Other current liabilities 1,732 1,681
Total current liabilities 6,056 6,135
Long-term debt, net of current portion of $5 in 2012 and 2011 3,930 3,935
Pension and post-retirement plan liabilities 6,085 4,079
Other non-current liabilities 958 926
Total liabilities 17,029 15,075
Commitments and contingencies (Note 12)
Shareholders’ equity
Preferred Stock, $1 par value; 10,000,000 shares authorized; no shares
issued and outstanding — —
Common stock, $1 par value; 800,000,000 shares authorized; issued and 239 254
Northrop Grumman Corporation 53
outstanding: 2012 — 239,209,812; 2011 — 253,889,622
Paid-in capital 2,924 3,873
Retained earnings 11,138 9,699
Accumulated other comprehensive loss (4,787) (3,490)
Total shareholders’ equity 9,514 10,336
Total liabilities and shareholders’ equity $26,543 $25,411
The accompanying notes are an integral part of these consolidated financial statements.
44
Table of Contents
NORTHROP GRUMMAN CORPORATION
CONSOLIDATED STATEMENTS OF OPERATIONS
Year Ended December 31
$ in millions, except per share amounts 2011 2010 2009
Sales and Service Revenues
Product sales $15,073 $16,091 $16,004
Service revenues 11,339 12,052 11,646
Total sales and service revenues 26,412 28,143 27,650
Cost of Sales and Service Revenues
Northrop Grumman Corporation 54
Cost of product sales 11,491 12,558 12,648
Cost of service revenues 9,295 10,291 10,157
General and administrative expenses 2,350 2,467 2,571
Operating income 3,276 2,827 2,274
Other (expense) income
Interest expense (221) (269) (269)
Charge on debt redemption (229)
Other, net 28 37 65
Earnings from continuing operations before income taxes 3,083 2,366 2,070
Federal and foreign income tax expense 997 462 636
Earnings from continuing operations 2,086 1,904 1,434
Earnings from discontinued operations, net of tax 32 149 252
Net earnings $ 2,118 $ 2,053 $ 1,686
Basic Earnings Per Share
Continuing operations $ 7.54 $ 6.41 $ 4.49
Discontinued operations .11 .50 .79
Basic earnings per share $ 7.65 $ 6.91 $ 5.28
Weighted-average common shares outstanding, in millions 276.8 296.9 319.2
Diluted Earnings Per Share
Continuing operations $ 7.41 $ 6.32 $ 4.44
Discontinued operations .11 .50 .77
Diluted earnings per share $ 7.52 $ 6.82 $ 5.21
Northrop Grumman Corporation 55
Weighted-average diluted shares outstanding, in millions 281.6 301.1 323.3
Net earnings (from above) $ 2,118 $ 2,053 $ 1,686
Other comprehensive (loss) income
Change in cumulative translation adjustment (4) (41) 31
Change in unrealized (loss) gain on marketable securities and cash
flow hedges, net of tax benefit (expense) of $2 in 2011, $0 in
2010, and $(23) in 2009
(4) 1 36
Change in unamortized benefit plan costs, net of tax benefit
(expense) of $823 in 2011, $(183) in 2010, and $(374) in 2009
(1,249) 297 561
Other comprehensive (loss) income, net of tax (1,257) 257 628
Comprehensive income $ 861 $ 2,310 $ 2,314
The accompanying notes are an integral part of these consolidated financial statements.
-58-
Table of Contents
NORTHROP GRUMMAN CORPORATION
CONSOLIDATED STATEMENTS OF FINANCIAL POSITION
December 31
$ in millions 2011 2010
Assets
Current Assets
Cash and cash equivalents $ 3,002 $ 3,701
Accounts receivable, net of progress payments 2,964 3,329
Inventoried costs, net of progress payments 873 896
Deferred tax assets 496 392
Prepaid expenses and other current assets 411 244
Northrop Grumman Corporation 56
Assets of discontinued operations 5,212
Total current assets 7,746 13,774
Property, Plant, and Equipment
Land and land improvements 375 363
Buildings and improvements 1,433 1,363
Machinery and other equipment 4,143 3,972
Capitalized software costs 444 451
Leasehold improvements 585 608
Property, plant, and equipment, cost 6,980 6,757
Accumulated depreciation (3,933) (3,712)
Property, plant, and equipment, net 3,047 3,045
Other Assets
Goodwill 12,374 12,376
Other purchased intangibles, net of accumulated amortization of $1,650 in
2011 and $1,613 in 2010
155 192
Pension and post-retirement plan assets 153 320
Long-term deferred tax assets 900 628
Miscellaneous other assets 1,036 1,075
Total other assets 14,618 14,591
Total assets $25,411 $31,410
Liabilities and Shareholders’ Equity
Current Liabilities
Notes payables to banks and current portion of long-term debt $ 13 $ 784
Northrop Grumman Corporation 57
Trade accounts payable 1,481 1,573
Accrued employees’ compensation 1,196 1,146
Advance payments and billings in excess of costs incurred 1,777 1,969
Other current liabilities 1,668 1,763
Liabilities of discontinued operations 2,792
Total current liabilities 6,135 10,027
Long-term debt, net of current portion 3,935 3,940
Pension and post-retirement plan liabilities 4,079 3,089
Other long-term liabilities 926 918
Total liabilities 15,075 17,974
Commitments and Contingencies (Note 15)
Shareholders’ Equity
Preferred Stock, $1 par value; 10,000,000 shares authorized; no shares
issued and outstanding in 2011 and 2010
Common stock, $1 par value; 800,000,000 shares authorized; issued and
outstanding: 2011 — 253,889,622; 2010 — 290,956,752
254 291
Paid-in capital 3,873 7,778
Retained earnings 9,699 8,124
Accumulated other comprehensive loss (3,490) (2,757)
Total shareholders’ equity 10,336 13,436
Total liabilities and shareholders’ equity $25,411 $31,410
The accompanying notes are an integral part of these consolidated financial statements.
-59-
Northrop Grumman Corporation 58
CONSOLIDATED STATEMENTS OF OPERATIONS 2010
Year Ended December 31
$ in millions, except per share amounts 2010 2009 2008
Sales and Service Revenues
Product sales $21,776 $20,914 $19,634
Service revenues 12,981 12,841 12,681
Total sales and service revenues 34,757 33,755 32,315
Cost of Sales and Service Revenues
Cost of product sales 16,820 16,591 15,490
Cost of service revenues 11,789 11,539 10,885
General and administrative expenses 3,078 3,142 3,143
Goodwill impairment 3,060
Operating income (loss) 3,070 2,483 (263 )
Other (expense) income
Interest expense (281 ) (281 ) (295 )
Charge on debt redemption (231 )
Other, net 37 64 38
Earnings (loss) from continuing operations before income taxes 2,595 2,266 (520 )
Federal and foreign income taxes 557 693 859
Earnings (loss) from continuing operations 2,038 1,573 (1,379)
Earnings from discontinued operations, net of tax 15 113 117
Net earnings (loss) $ 2,053 $ 1,686 $(1,262)
Basic Earnings (Loss) Per Share
Continuing operations $ 6.86 $ 4.93 $ (4.12 )
Discontinued operations .05 .35 .35
Basic earnings (loss) per share $ 6.91 $ 5.28 $ (3.77 )
Weighted-average common shares outstanding, in millions 296.9 319.2 334.5
Diluted Earnings (Loss) Per Share
Continuing operations $ 6.77 $ 4.87 $ (4.12 )
Discontinued operations .05 .34 .35
Diluted earnings (loss) per share $ 6.82 $ 5.21 $ (3.77 )
Weighted-average diluted shares outstanding, in millions 301.1 323.3 334.5
Net earnings (loss) from above $ 2,053 $ 1,686 $(1,262)
Other comprehensive income (loss)
Change in cumulative translation adjustment (41 ) 31 (24 )
Change in unrealized gain (loss) on marketable securities and cash flow hedges, net of
tax benefit (expense) of $0 in 2010, $(23) in 2009, and $22 in 2008
1 36 (35 )
Change in unamortized benefit plan costs, net of tax (expense) benefit of $(183) in
2010, $(374) in 2009 and $1,888 in 2008
297 561 (2,884)
Other comprehensive income (loss), net of tax 257 628 (2,943)
Comprehensive income (loss) $ 2,310 $ 2,314 $(4,205)
The accompanying notes are an integral part of these consolidated financial statements.
-62-
Northrop Grumman Corporation 59
Table of Contents
NORTHROP GRUMMAN CORPORATION
CONSOLIDATED STATEMENTS OF FINANCIAL POSITION 2011
December 31 December 31
$ in millions 2010 2009
Assets
Current Assets
Cash and cash equivalents $ 3,701 $ 3,275
Accounts receivable, net of progress payments 4,057 3,394
Inventoried costs, net of progress payments 1,185 1,170
Deferred tax assets 710 524
Prepaid expenses and other current assets 251 272
Total current assets 9,904 8,635
Property, Plant, and Equipment
Land and land improvements 666 649
Buildings and improvements 2,658 2,422
Machinery and other equipment 5,134 4,759
Capitalized software costs 636 624
Leasehold improvements 670 630
9,764 9,084
Accumulated depreciation (4,722 ) (4,216 )
Property, plant, and equipment, net 5,042 4,868
Other Assets
Goodwill 13,517 13,517
Other purchased intangibles, net of accumulated amortization of $1,965 in 2010 and
$1,871 in 2009
779 873
Pension and post-retirement plan assets 450 300
Long-term deferred tax assets 612 1,010
Miscellaneous other assets 1,117 1,049
Total other assets 16,475 16,749
Total assets $ 31,421 $ 30,252
Liabilities and Shareholders’ Equity
Current Liabilities
Notes payable to banks $ 10 $ 12
Current portion of long-term debt 774 91
Trade accounts payable 1,846 1,921
Accrued employees’ compensation 1,349 1,281
Advance payments and billings in excess of costs incurred 2,076 1,954
Other current liabilities 2,331 1,726
Total current liabilities 8,386 6,985
Long-term debt, net of current portion 4,045 4,191
Pension and post-retirement plan liabilities 4,116 4,874
Other long-term liabilities 1,317 1,515
Total liabilities 17,864 17,565
Commitments and Contingencies (Note 16)
Shareholders’ Equity
Common stock, $1 par value; 800,000,000 shares authorized; issued and outstanding:
2010—290,956,752; 2009—306,865,201
291 307
Paid-in capital 7,778 8,657
Retained earnings 8,245 6,737
Accumulated other comprehensive loss (2,757 ) (3,014 )
Total shareholders’ equity 13,557 12,687
Total liabilities and shareholders’ equity $ 31,421 $ 30,252
Northrop Grumman Corporation 60
The accompanying notes are an integral part of these consolidated financial statements.
Northrop Grumman Corporation 61
Industry Data Source
Mergent Online
eStatement Studies
Northrop Grumman Corp
(NYS: NOC)
Northrop Grumman Corp (NYS: NOC)
General Company Information
Principal Office Website
2980 Fairview Park Drive Falls Church, VA 22042 USA www.northropgrumman.com
Phone Primary NAICS
703 280-2900
334511 : Search, Detection, Navigation,
Guidance, Aeronautical, and Nautical System and Instrument Manufacturing
Auditor Closing Stock Price
Deloitte & Touche LLP 162.3 (as of 09/04/2015)
Number of Employees Incorporated
64,300 (Year End Average Staff as of 12/31/2014) May 1939 , CA, United States
Country Mergent Dividend Achiever
United States No
Exchange and Ticker Number of Shareholders
NYS : NOC 26,699 (approx.) (as of 01/29/2015)
Primary SIC Annual Meeting
3812 : Search and navigation equipment In May
* all results are stated in US Dollars
Peer Grouping by: NAIC
Peer Scope: worldwide
Company Name Current Ratio - 2014
Northrop Grumman Corporation 62
Peer Avr: 1.32
BAE Systems Plc 0.74
Bosch (Robert) GmbH (Germany Fed. Rep.) 2.1
Finmeccanica S.p.A. 0.98
Lockheed Martin Corp. 1.11
NEC Corp 1.52
Northrop Grumman Corporation 63

Weitere ähnliche Inhalte

Was ist angesagt?

Financial Accounting Project.docx-2
Financial Accounting Project.docx-2Financial Accounting Project.docx-2
Financial Accounting Project.docx-2Thana Kittisathanon
 
Morgan McKinley Singapore Salary Survey 2012
Morgan McKinley Singapore Salary Survey 2012Morgan McKinley Singapore Salary Survey 2012
Morgan McKinley Singapore Salary Survey 2012Morgan McKinley
 
3Q 2013 Earnings Presentation
3Q 2013 Earnings Presentation3Q 2013 Earnings Presentation
3Q 2013 Earnings Presentationirbgcpartners
 
2005 Q2 TRW Auto Earnings Presentation
2005 Q2 TRW Auto Earnings Presentation2005 Q2 TRW Auto Earnings Presentation
2005 Q2 TRW Auto Earnings Presentationfinance18
 
5 ways CFOs can make cost cuts stick
5 ways CFOs can make cost cuts stick5 ways CFOs can make cost cuts stick
5 ways CFOs can make cost cuts stickManuel A. Velazquez
 
Miami University 2016 Cleveland Research Company Stock Pitch Competition Winner
Miami University 2016 Cleveland Research Company Stock Pitch Competition WinnerMiami University 2016 Cleveland Research Company Stock Pitch Competition Winner
Miami University 2016 Cleveland Research Company Stock Pitch Competition WinnerMichael T. Loffredo
 
black&decker 4Q06EarningsRelease
black&decker 4Q06EarningsReleaseblack&decker 4Q06EarningsRelease
black&decker 4Q06EarningsReleasefinance44
 
celanese sept_20th_china_investor_presentation_final-4
celanese sept_20th_china_investor_presentation_final-4celanese sept_20th_china_investor_presentation_final-4
celanese sept_20th_china_investor_presentation_final-4finance44
 
Fortune research om cs_look beyond fy15!
Fortune research om cs_look beyond fy15!Fortune research om cs_look beyond fy15!
Fortune research om cs_look beyond fy15!Saad Yousuf
 
JCI Summary Analysis
JCI Summary AnalysisJCI Summary Analysis
JCI Summary AnalysisJencil Philip
 
Investor Presentation - March 2015
Investor Presentation - March 2015Investor Presentation - March 2015
Investor Presentation - March 2015gstubel
 
BDO M&A report 2011
BDO M&A report 2011 BDO M&A report 2011
BDO M&A report 2011 kmrceltic
 
2005 Q3 TRW Auto Earnings Presentation
2005 Q3 TRW Auto Earnings Presentation 2005 Q3 TRW Auto Earnings Presentation
2005 Q3 TRW Auto Earnings Presentation finance18
 
SIM Equity Research Project - Spring 2014 - CCK - Martin Smith
SIM Equity Research Project - Spring 2014 - CCK - Martin SmithSIM Equity Research Project - Spring 2014 - CCK - Martin Smith
SIM Equity Research Project - Spring 2014 - CCK - Martin SmithMartin Smith
 

Was ist angesagt? (18)

Raymond James Investor Conference
Raymond James Investor ConferenceRaymond James Investor Conference
Raymond James Investor Conference
 
Financial Accounting Project.docx-2
Financial Accounting Project.docx-2Financial Accounting Project.docx-2
Financial Accounting Project.docx-2
 
Morgan McKinley Singapore Salary Survey 2012
Morgan McKinley Singapore Salary Survey 2012Morgan McKinley Singapore Salary Survey 2012
Morgan McKinley Singapore Salary Survey 2012
 
3Q 2013 Earnings Presentation
3Q 2013 Earnings Presentation3Q 2013 Earnings Presentation
3Q 2013 Earnings Presentation
 
2005 Q2 TRW Auto Earnings Presentation
2005 Q2 TRW Auto Earnings Presentation2005 Q2 TRW Auto Earnings Presentation
2005 Q2 TRW Auto Earnings Presentation
 
5 ways CFOs can make cost cuts stick
5 ways CFOs can make cost cuts stick5 ways CFOs can make cost cuts stick
5 ways CFOs can make cost cuts stick
 
Q4 2012 Presentation
Q4 2012 PresentationQ4 2012 Presentation
Q4 2012 Presentation
 
Miami University 2016 Cleveland Research Company Stock Pitch Competition Winner
Miami University 2016 Cleveland Research Company Stock Pitch Competition WinnerMiami University 2016 Cleveland Research Company Stock Pitch Competition Winner
Miami University 2016 Cleveland Research Company Stock Pitch Competition Winner
 
Chase Corp
Chase CorpChase Corp
Chase Corp
 
black&decker 4Q06EarningsRelease
black&decker 4Q06EarningsReleaseblack&decker 4Q06EarningsRelease
black&decker 4Q06EarningsRelease
 
Personal Portfolio
Personal PortfolioPersonal Portfolio
Personal Portfolio
 
celanese sept_20th_china_investor_presentation_final-4
celanese sept_20th_china_investor_presentation_final-4celanese sept_20th_china_investor_presentation_final-4
celanese sept_20th_china_investor_presentation_final-4
 
Fortune research om cs_look beyond fy15!
Fortune research om cs_look beyond fy15!Fortune research om cs_look beyond fy15!
Fortune research om cs_look beyond fy15!
 
JCI Summary Analysis
JCI Summary AnalysisJCI Summary Analysis
JCI Summary Analysis
 
Investor Presentation - March 2015
Investor Presentation - March 2015Investor Presentation - March 2015
Investor Presentation - March 2015
 
BDO M&A report 2011
BDO M&A report 2011 BDO M&A report 2011
BDO M&A report 2011
 
2005 Q3 TRW Auto Earnings Presentation
2005 Q3 TRW Auto Earnings Presentation 2005 Q3 TRW Auto Earnings Presentation
2005 Q3 TRW Auto Earnings Presentation
 
SIM Equity Research Project - Spring 2014 - CCK - Martin Smith
SIM Equity Research Project - Spring 2014 - CCK - Martin SmithSIM Equity Research Project - Spring 2014 - CCK - Martin Smith
SIM Equity Research Project - Spring 2014 - CCK - Martin Smith
 

Andere mochten auch

financial statement and trend analysis
financial statement and trend analysisfinancial statement and trend analysis
financial statement and trend analysisZai Amin
 
Trends Analysis Report
Trends Analysis ReportTrends Analysis Report
Trends Analysis Reportjenniferbehr
 
Trend analysis presentation
Trend analysis presentationTrend analysis presentation
Trend analysis presentationwiechmanna
 
Trends analysis power point presentation
Trends analysis power point presentationTrends analysis power point presentation
Trends analysis power point presentationbeaubecker
 
Financial statement analysis types & techniques
Financial statement analysis types & techniquesFinancial statement analysis types & techniques
Financial statement analysis types & techniquesDr. Abzal Basha
 
Financial statement analysis
Financial statement analysisFinancial statement analysis
Financial statement analysiskiran bala sahoo
 
Analysis of financial statements
Analysis of financial statementsAnalysis of financial statements
Analysis of financial statementsAdil Shaikh
 

Andere mochten auch (11)

financial statement and trend analysis
financial statement and trend analysisfinancial statement and trend analysis
financial statement and trend analysis
 
Trends Analysis Report
Trends Analysis ReportTrends Analysis Report
Trends Analysis Report
 
Du Pont Analysis
Du Pont AnalysisDu Pont Analysis
Du Pont Analysis
 
Trend analysis presentation
Trend analysis presentationTrend analysis presentation
Trend analysis presentation
 
Trends analysis power point presentation
Trends analysis power point presentationTrends analysis power point presentation
Trends analysis power point presentation
 
Trend analysis
Trend analysisTrend analysis
Trend analysis
 
Trend analysis
Trend analysisTrend analysis
Trend analysis
 
Trend analysis
Trend analysisTrend analysis
Trend analysis
 
Financial statement analysis types & techniques
Financial statement analysis types & techniquesFinancial statement analysis types & techniques
Financial statement analysis types & techniques
 
Financial statement analysis
Financial statement analysisFinancial statement analysis
Financial statement analysis
 
Analysis of financial statements
Analysis of financial statementsAnalysis of financial statements
Analysis of financial statements
 

Ähnlich wie Ratio Trend Analysis Project 1 copy

SM Energy - 4th Quarter 2013 Earnings Call
SM Energy - 4th Quarter 2013 Earnings CallSM Energy - 4th Quarter 2013 Earnings Call
SM Energy - 4th Quarter 2013 Earnings CallCompany Spotlight
 
Financial ration analysis
Financial ration analysisFinancial ration analysis
Financial ration analysisJordon Wong
 
Parker Hannifin 2013 Annual Report | Engineering Your Success
Parker Hannifin 2013 Annual Report | Engineering Your SuccessParker Hannifin 2013 Annual Report | Engineering Your Success
Parker Hannifin 2013 Annual Report | Engineering Your SuccessParker Hannifin Corporation
 
Financial ration-analysis-1
Financial ration-analysis-1Financial ration-analysis-1
Financial ration-analysis-1leejiakiam
 
Financial ration-analysis (1)
Financial ration-analysis (1)Financial ration-analysis (1)
Financial ration-analysis (1)jordanlim96
 
Procter & Gamble Analysis
Procter & Gamble AnalysisProcter & Gamble Analysis
Procter & Gamble AnalysisDavid Hatfield
 
Q2 2002 Conference Call Opening Comments
Q2 2002 Conference Call Opening CommentsQ2 2002 Conference Call Opening Comments
Q2 2002 Conference Call Opening Commentsfinance7
 
Analysis Based on the above factual data collected and complied
 Analysis Based on the above factual data collected and complied Analysis Based on the above factual data collected and complied
Analysis Based on the above factual data collected and compliedMargaritoWhitt221
 
Jefferies 2013 Global Industrials Conference Presentation
Jefferies 2013 Global Industrials Conference PresentationJefferies 2013 Global Industrials Conference Presentation
Jefferies 2013 Global Industrials Conference PresentationZep Inc.
 
Zep Inc. Investor Presentation
Zep Inc. Investor Presentation Zep Inc. Investor Presentation
Zep Inc. Investor Presentation Zep Inc.
 
Quarterly Earnings Presentation Q4
Quarterly Earnings Presentation Q4Quarterly Earnings Presentation Q4
Quarterly Earnings Presentation Q4rockwell_collins
 
corning annual reports 2008
corning annual reports 2008corning annual reports 2008
corning annual reports 2008finance35
 
CFA RESEARCH CHALLENGE REPORT FINAL (Feb 9,2014)-TEAM G(1)
CFA RESEARCH CHALLENGE REPORT FINAL (Feb 9,2014)-TEAM G(1)CFA RESEARCH CHALLENGE REPORT FINAL (Feb 9,2014)-TEAM G(1)
CFA RESEARCH CHALLENGE REPORT FINAL (Feb 9,2014)-TEAM G(1)Nathaniel Christopher
 
Boeing Financial analysis
Boeing Financial analysisBoeing Financial analysis
Boeing Financial analysis?? ?
 
Final LEG project copy
Final LEG project copyFinal LEG project copy
Final LEG project copyEric Nielsen
 
Q1 2002 Conference Call Opening Comments
Q1 2002 Conference Call Opening CommentsQ1 2002 Conference Call Opening Comments
Q1 2002 Conference Call Opening Commentsfinance7
 

Ähnlich wie Ratio Trend Analysis Project 1 copy (20)

SM Energy - 4th Quarter 2013 Earnings Call
SM Energy - 4th Quarter 2013 Earnings CallSM Energy - 4th Quarter 2013 Earnings Call
SM Energy - 4th Quarter 2013 Earnings Call
 
Enterprise Partners Valuation
Enterprise Partners ValuationEnterprise Partners Valuation
Enterprise Partners Valuation
 
Financial ration analysis
Financial ration analysisFinancial ration analysis
Financial ration analysis
 
Parker Hannifin 2013 Annual Report | Engineering Your Success
Parker Hannifin 2013 Annual Report | Engineering Your SuccessParker Hannifin 2013 Annual Report | Engineering Your Success
Parker Hannifin 2013 Annual Report | Engineering Your Success
 
Financial ration-analysis-1
Financial ration-analysis-1Financial ration-analysis-1
Financial ration-analysis-1
 
Financial ration-analysis (1)
Financial ration-analysis (1)Financial ration-analysis (1)
Financial ration-analysis (1)
 
Procter & Gamble Analysis
Procter & Gamble AnalysisProcter & Gamble Analysis
Procter & Gamble Analysis
 
Q2 2002 Conference Call Opening Comments
Q2 2002 Conference Call Opening CommentsQ2 2002 Conference Call Opening Comments
Q2 2002 Conference Call Opening Comments
 
Analysis Based on the above factual data collected and complied
 Analysis Based on the above factual data collected and complied Analysis Based on the above factual data collected and complied
Analysis Based on the above factual data collected and complied
 
Jefferies 2013 Global Industrials Conference Presentation
Jefferies 2013 Global Industrials Conference PresentationJefferies 2013 Global Industrials Conference Presentation
Jefferies 2013 Global Industrials Conference Presentation
 
Zep Inc. Investor Presentation
Zep Inc. Investor Presentation Zep Inc. Investor Presentation
Zep Inc. Investor Presentation
 
Quarterly Earnings Presentation Q4
Quarterly Earnings Presentation Q4Quarterly Earnings Presentation Q4
Quarterly Earnings Presentation Q4
 
Boom 3 12 final small
Boom 3 12 final smallBoom 3 12 final small
Boom 3 12 final small
 
corning annual reports 2008
corning annual reports 2008corning annual reports 2008
corning annual reports 2008
 
CFA RESEARCH CHALLENGE REPORT FINAL (Feb 9,2014)-TEAM G(1)
CFA RESEARCH CHALLENGE REPORT FINAL (Feb 9,2014)-TEAM G(1)CFA RESEARCH CHALLENGE REPORT FINAL (Feb 9,2014)-TEAM G(1)
CFA RESEARCH CHALLENGE REPORT FINAL (Feb 9,2014)-TEAM G(1)
 
Boeing Financial analysis
Boeing Financial analysisBoeing Financial analysis
Boeing Financial analysis
 
Final LEG project copy
Final LEG project copyFinal LEG project copy
Final LEG project copy
 
Q1 2002 Conference Call Opening Comments
Q1 2002 Conference Call Opening CommentsQ1 2002 Conference Call Opening Comments
Q1 2002 Conference Call Opening Comments
 
Sbm present13
Sbm present13Sbm present13
Sbm present13
 
Qlet2012 04
Qlet2012 04Qlet2012 04
Qlet2012 04
 

Ratio Trend Analysis Project 1 copy

  • 1. Northrop Grumman Corporation General Dynamics Corporation (Competitor) Rachel Voigtlander Financial Management FIN833 Professor Wiley September 14, 2015
  • 2. Northrop Grumman Corporation ii Table of Contents Executive Summary ......................................................................................................... 1 Ratio Charts and Analyses................................................................................................ 3 Liquidity Ratios............................................................................................................ 3 Current Ratio.......................................................................................................................................3 Quick Ratio .........................................................................................................................................5 Debt Management Ratios ............................................................................................. 7 Debt Ratio...........................................................................................................................................7 Times Interest Earned Ratio.................................................................................................................9 Asset Management Ratios........................................................................................... 11 Inventory Turnover Ratio...................................................................................................................11 Days Sales Outstanding Ratio ............................................................................................................13 Total Assets Turnover Ratio...............................................................................................................15 Fixed Assets Turnover Ratio ..............................................................................................................16 Profitability Ratios...................................................................................................... 18 Profit Margin on Sales........................................................................................................................18 Return on Total Assets.......................................................................................................................20 Return on Equity ...............................................................................................................................22 DuPont Analyses........................................................................................................ 24 Return on Total Assets.......................................................................................................................24 Return on Equity ...............................................................................................................................25 Excel Spreadsheet Printouts ........................................................................................ 27 NOC Spreadsheet ..............................................................................................................................27 GD Spreadsheet.................................................................................................................................28 Excel Ratio Checking Spreadsheet Printouts................................................................ 29 NOC Checker....................................................................................................................................29 GD Checker ......................................................................................................................................29 SEC Financial Statements for GD............................................................................... 30 SEC Financial Statements for NOC ............................................................................ 44
  • 3. Northrop Grumman Corporation iii Industry Data Source.................................................................................................. 61 Mergent Online..................................................................................................................................61 eStatement Studies.............................................................................................................................61
  • 4. Rachel Voigtlander Financial Management FIN338 Professor Wiley September 14, 2015 Northrop Grumman Corporation 1 Northrop Grumman Corporation General Dynamics Corporation (Competitor) Executive Summary Northrop Grumman (NOC) and General Dynamics (GD) are aerospace and defense companies with an overall positive outlook in the current market when compared to the top 10-industry average. Leading in key financial ratios, NOC appears to be sitting in a position to produce strong future revenues. NOC continues to remain stable in adequate liquidity, not heavily relying on inventory to pay off current liabilities, demonstrated by maintaining a Quick Ratio higher than industry average and the competitor, GD. Total asset turnover ratio has been in decline for NOC, GD, and the top 10-company industry average. However, Fixed Asset Turnover has increased from the low in 2009, demonstrating more effective asset management. In 2014, NOC had a solid performance, with upward trends in inventory turnover and profit margin on sales, positioned well above the top 10-industry average. Conflicts in the Middle East have yielded an environment of swift, strategic acquisitions for the company, as NOC’s products and services are in increasing demand, depicted by an increasing trend in the Inventory Turnover Ratio. A majority of NOC’s contracts are with the United States government; increased demand has led to an increased profit margin on sales ratio by 29% from 2009 to 2014. NOC falls below the industry average and competitors in Days Sales Outstanding ratio with an average of 42 days from 2009 to 2014. NOC falls below their competitor, GD, and the Industry average in the Times Interest Earned Ratio and may need to focus on increasing their ability to meet debt obligations. NOC is financed by approximately 60% debt, however both GD and industry averages prove this to be an industry norm. Due to NOC’s types of products and services and quality control, NOC has a lower inventory turnover when compared to the Industry average. An effective strategy may lie in improved inventory management systems. NOC’s Return on Equity Ratio is highly impressive. Since 2009, ROE has increased dramatically, and takes a sharp incline, well above the company’s competitor and the industry for 2014. In light of positively increasing trends in Profit Margins on Sales, Return on Equity, and Return on Assets Ratios demonstrating efficient costs strategies and management relative to total sales, NOC is positioned to ensure revenues and sales for the upcoming years.
  • 5. Northrop Grumman Corporation 2 GD is also capitalizing on the current tensions and conflicts in the Middle East and Europe. Military aviation, weapons, equipment, and intelligence are in strongly needed by the United States government. GD partakes in contracts with the U.S. government, along with other countries worldwide. Similarly to NOC, GD has made multiple acquisitions in the industry. These acquisitions led to a major disturbance in Profit Margin on Sales Ratio, Return on Assets Ratio, and Return on Equity, due to an 861% decline in net income in 2012 from the account goodwill impairment increasing by $1,994 million. Despite this occurrence, GD’s Return on Equity ratio was higher than NOC’s prior to the 2012 disturbance and since, has shifted to an increasing trend for 2014. GD remains above the industry average for the company’s Current and Quick Ratios, demonstrating a low reliance on inventory and stability in paying off current liabilities. GD is proficient in debt management and may be able to incur an increased amount of debt in the future. GD’s inventory management may need revision, as the company’s Industry Turnover Ratio is far below both NOC and the Industry average. While GD’s inventory does consist of large- scaled products, such as boats and planes, the strongly decreasing trend in the ratio proves concerning. Additionally, GD has seen a large decline in their ability to generate sales from their fixed assets, demonstrated in the Fixed Asset Turnover. GD may need to re-evaluate and align their fixed assets and inventories, due to the company’s increased acquisitions. GD was ahead of NOC from 2009 to 2011 in the ratios: Profit Margin on Sales, Return on Assets, and Return on Equity, yet experienced a decline from 2012 to 2013. GD appears to have recovered, and is upwardly trending in the ratios, proving to be a true competitor and likely continued threat to NOC in the future. According to the Industry’s ratio analysis, in 2009 and prior, the top 10-company Industry as a whole seems to have experienced a less-favorable environment. The Industry Debt Ratio was at a high of 80% in 2009, yet appears to have recovered. Troublingly, the Debt Ratio trend for the Industry, NOC, and GD appears to have taken an upward turn in 2014. The Industry ratio for Profit Margin on Sales was very low at 1.6% return on sales in 2009, yet overall has made a recovery and is on a significant upward trend. The ratios, Return on Assets and Return on Equity confirm harder times of 2009. Macro-environmental factors affected industry-wide companies’ net incomes, resulting in increased debt procurement. The Industry relies heavily on inventory when configuring overall liquidity, yet the Quick Ratio remains at a rather stably trending baseline. According to the Fixed Asset Turnover Ratio, the Industry has seen an improvement in the management of their fixed assets. Overall, the Industry appears to be gaining positive momentum and appears attractively positioned with upwardly inclining trends for the year 2014.
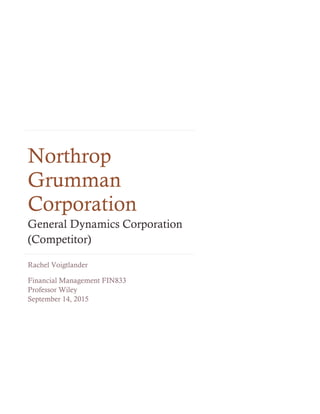
  • 6. Northrop Grumman Corporation 3 Ratio Charts and Analyses Liquidity Ratios Current Ratio NOC has had ups and downs in their current ratio since 2009. In 2010, there was a slight rise in the company’s ability to cover current liabilities, followed by a decrease in 2011, and then a more substantial rise, reaching a peak of liquidity in 2013. This peak in 2013 was caused by an increase in current assets, specifically cash and cash equivalents by 33%. In 2010, current assets were the highest at $13,774, an increase of 60% from 2009. This high was from assets of discontinued operations, totaling $5,212. Liabilities were also at the highest point at $10,027, contributing mainly to this total was the liabilities from discontinued operations in the amount of $2,792. In 2014 the company’s liquidity has declined slightly, mainly from a decrease in cash and equivalents by 25%. Overall NOC’s liquidity is consistently slightly higher than their competitor GC and the industry average for the top 10 companies. 0.0 0.2 0.4 0.6 0.8 1.0 1.2 1.4 1.6 1.8 2008 2009 2010 2011 2012 2013 2014 2015 Times Current Ratio NOC GD Industry
  • 7. Northrop Grumman Corporation 4 GD has seen a slight decrease in their current ratio for the year 2010 with an overall increase in current assets by 7% and increase in current liabilities by 8%. There was a slight rise in liquidity in 2011 from an increase of 8% in current assets, contributed mainly by accounts receivable increasing by 15% and other current assets increasing by 17%. There was another slight decrease in 2012, caused by a slightly greater increase in current liabilities compared to current assets. Cash and equivalents decreased by 24%, contributing mainly to the decrease in liquidity for 2012. Similarly to NOC, GD hit a peak in 2013. GD’s peak in 2013 was due to a current asset increase to a peak of $18,162, with a current liability peak of $12,259. The main contributors to the current asset peak of 2013 were an increase in cash and equivalents by 61% and an increase in other current assets by 63%. In the year 2014, the liquidity of GD started dropping back down, with increasing current liabilities by 12%, showing mainly from an increase in customer advances and deposits by 11%. The industry’s current ratio overall seems to appear rather stable. There was an overall low in 2009. Since 2009, there has been an increase in current ratio by .2.
  • 8. Northrop Grumman Corporation 5 Quick Ratio NOC’s quick ratio takes a similar pattern to their current ratio, with slightly higher peaks in the years 2010 and 2013. The peak in 2010 was caused mainly from an increase in current assets from discontinued operations. Without the influence of discontinued operations and inventories, current assets only increased by 3%, which shows why the liquidity decreased the following year, in 2011 from 1.37 to 1.26, still remaining near equivalent to 2009’s liquidity of 1.23. From the years 2011 to 2013 generally upward sloping trend occurs. The peak in 2013 was influenced by a near 25% increase in cash and equivalents and a decrease in current liabilities by 4%. After the peak in 2013, there has been a downward shift in liquidity mainly due to cash and equivalents decreasing by 25%. GD’s quick liquidity has remained more stable than the current ratio. There was less of a high in 2013 and associated decline in 2014. Inventories during those years rose by 4% and then fell by 11%, not accounting for inventory has yielded a more stable quick liquidity for GD. The top 10-company industry average of quick liquidity is substantially lower than NOC and GD. The industry average is 0.73, while NOC’s average is 1.250 and GD’s is 1.11. 0.0 0.2 0.4 0.6 0.8 1.0 1.2 1.4 1.6 2008 2009 2010 2011 2012 2013 2014 2015 Times Quick Ratio NOC GD Industry
  • 9. Northrop Grumman Corporation 6 Overall, the industry relies more heavily on inventory as apart of their current assets and overall liquidity. The difference between the current and quick ratio is 0.55. NOC maintains a high liquidity as compared to GD and the industry, without consideration for inventory, due to their inventory type. Some of NOC’s core competencies are in the areas of cyber security services and intelligence systems.
  • 10. Northrop Grumman Corporation 7 Debt Management Ratios Debt Ratio NOC’s debt ratio has remained relatively stable and slightly upward sloping from the years 2009 to 2012, with an average debt ratio of 58.2% for those years. The company experienced a slight decline in 2013, to a value of 59.74 % after the peak of 2012, at 64.16%, returning to a debt ratio similar to 2011, at 59.32%. The peak of 2012 was caused by an increase in pension and other post-retirement benefit plan liabilities by 49%. Due to a difference in the Financial Accounting Standards and Cost Accounting Standards, the estimated amount for retiree benefit plan expenses were not accurately aligned to the true expenditure. On December 27, 2011 a rule was changed by the CAS in the measurement of pension costs, and adjustment and allocation, including a 5-year transitional period. In result to this rule, pension and other post-retirement benefit plan liabilities increased. Health care cost trend rate projection has changed since the effects of new health care reform. NOC reports the company’s actual cost experience is low at this time, yet NOC predicts the economic conditions and effects of the reform should increase healthcare and benefit cots. (SEC, 10-k, 2011) The slight decline in 2013 was 0% 10% 20% 30% 40% 50% 60% 70% 80% 90% 2008 2009 2010 2011 2012 2013 2014 2015 Debt Ratio NOC GD Industry
  • 11. Northrop Grumman Corporation 8 mainly due to a decrease in pension and other post-retirement benefit plan liabilities by 122%. There is a slight increase in 2014, reaching this period’s high. In 2014, total liabilities increased by 23%, while total assets increased by only 1%. The main contributor to this increase in total liabilities was from the pension and other post-retirement benefit plan liabilities, increasing by 122%. Throughout the years 2009 through 2014, total assets only varied by 1% to 2%. GD follows a near identical trend to NOC, with a slightly upward slope through the years 2009 to 2012, followed by a slight decline in 2013 and upward turn in 2014. GD experienced a 5% increase in total assets from 2012 to 2013. This increase was contributed from a 15% increase in total current assets, from the accounts cash and equivalents and other current assets. Total liabilities were highest in the years of 2012, at $22,919 and $23,526 in year 2014. In 2012, this amount was contributed from a 4% increase in total current liabilities and an 8% increase in total noncurrent liabilities. Contributing to the 12% increase in total liabilities from 2013 to 2014 was the current liability account, customer advances and deposits with an increase of 11%. From 2013 to 2014, other liabilities also increased by 32%. For the industry data, the top 10 companies’ median values were used for the years 2009 through 2014. From 2011 to 2014, a nearly identical trend and value for the debt ratio is seen when compared to NOC and GD. From 2009 to 2011, the industry debt ratio drops from 80.5% to 62.5%, representing a 29% change during these years. During 2009, 80.5% of the industry’s total assets could be funded by incurred debt. During the same year, NOC had a debt ratio of 58.06% and GD had a debt ratio of 60.03%. The large-scaled economic crash of 2008 could have led to higher debt levels for the year 2009 overall. NOC and GD may be less affected due to fixed contracts with their main customer, the U.S. government. NOC appears to be less susceptible to the market and economic fluctuations when compared to the industry as a whole. From the date from 2009 to 2014, NOC appears to have a consistently, slightly lower debt ratio throughout this period when compared to the industry average and GD.
  • 12. Northrop Grumman Corporation 9 Times Interest Earned Ratio NOC has remained relatively stable throughout 2009 to 2014. The largest change in this ratio occurred from 2010 to 2011 by 41% increase. This increase was caused by an 18% decrease in interest expense and 16% increase in earnings before interest and taxes. Other less significant changes occur from 2012 to 2013 by 18% decrease. This change is reflective of interest expense increasing by 21% from $212 to $257, and earnings before interest and taxes remaining stable. A 24% increase from 2009 to 2010 is seen due to interest expense remaining stable and earnings before interest and taxes increasing by 24%. GD had an upward trend from 2009 to 2011. Moving from 21.49 to 24.68 during this time. In 2012, GD’s times interest earned plummeted, taking a 442% decrease. This was primarily due to an added operating cost and expense, goodwill impairment in the amount of $1,994 million. This account remained at 0$ for all other years from 2009 to 2014. Operating costs and expenses increased by 6% from 2011 to 2012. Through the acquisitions of over 60 businesses since 1995, good will and intangible assets have been recognized in the amount of $1.8 billion. The fair value of each reported units was found to exceed its carrying value, representing an unrecoverable value. GD decided to report the sum of the impairment on the 2012 10-k. GD has no previous record of goodwill impairment, and presumes to not have another in the future. (SEC, 0 5 10 15 20 25 30 35 40 45 2008 2009 2010 2011 2012 2013 2014 2015 Times Times Interest Earned NOC GD Industry
  • 13. Northrop Grumman Corporation 10 2012,10-k) In 2013 interest expense increased by 8%, while earnings before interest and tax decreased by 400%, rising from $3826 in 2011 to $765 in 2012. In 2013, GD’s ratio rose dramatically by increasing earnings before interest and taxes to $3,689 and decreasing interest expense by 63% to $103, compared to $168 in 2012. In 2014, interest expense remained stable, while earnings before interest and taxes increased by another 5%. NOC maintains an average times interest earned ratio of 12, while GD’s average times interest earned is 24.65 for the years 2009 to 2014. The industry average for this time frame is 15.14. In 2009, the industry had a higher times interest earned ratio at 24.54, this is followed by a decrease to 15.12 and relatively stable trend to 2014. NOC is below the average, indicating NOC is less easily able to cover interest payments when compared to their competitor and the industry. NOC may not be as readily able to take on additional debt as their counterparts, yet the company’s stability with the debt they do have appear encouraging. GD’s sharp decline in their times interest earned ratio is mainly due to a goodwill impairment recorded for 2012. This is a noncash transaction. This decline is not as concerning as it may appear; overall the company maintains sufficient ability to cover their interest. GD has seen an upward trending in this ratio; GD may be able to take on additional debt without concern in covering their interest payments.
  • 14. Northrop Grumman Corporation 11 Asset Management Ratios Inventory Turnover Ratio NOC maintains an average inventory turnover ratio of 12.99, trending upward. From 2009 to 2011, a steady incline in the ratio is seen. A slight decrease occurs in 2012, followed by an increase in 2013. Overall, the trend in the ratio is slowly upward; NOC has increased their inventory turnover by 20%, when comparing the starting year, 2009 to the ending year, 2014. In 2012, Cost of Goods Sold was the lowest compared to the other years from 2008 to 2015, decreasing by 10% since 2011, exhibiting the largest change in this account for the years 2008 to 2014. The largest change in inventory occurred from 2009 to 2010, decreasing by 31%. The second largest change was from the years 2012 to 2013, when inventory decreased by 14%. GD maintains an overall average inventory ratio of 6.83 for the years 2008 to 2014. GD’s inventory turnover ratio is steadily declining during this time, experiencing a decrease in the ratio by 71% when comparing the starting year, 2008 to the ending year, 2014. The sharpest decline in the ratio is seen from 2011 to 2012, decreasing by 24%. The following year the 0 2 4 6 8 10 12 14 16 18 2008 2009 2010 2011 2012 2013 2014 2015 Times Inventory Turnover NOC GD Industry
  • 15. Northrop Grumman Corporation 12 ratio decreased by an additional 17%. From 2011 to 2012 inventory decreased by 17% and Cost of Goods Sold decreased by 9%. Overall, throughout the years 2008 to 2014, inventories decreased by 37% and Cost of Goods Sold decreased by 16%. The ratio showed a year-to-year averaged decrease of 3% from 2009 to 2914. The industry average, using the median value for the top 10 competing companies, according to Mergent, appears stable in showing a slight decline in the ratio for the years 2009 to 2014. When comparing the start of this period to the end, the ratio decreased by 9%. The year-to-year average decrease is 2%. From 2009 to 2011, a slight increase occurs in the ratio, increasing by 4% in 2009 and 1% in 2010. GD’s ratio is quite lower than the industry average. GD specializes in larger crafted inventory items, while others included in the industry average focus on other aspects, such as intelligence, cyber security, and systems.
  • 16. Northrop Grumman Corporation 13 Days Sales Outstanding Ratio The figures calculated for NOC and GD’s graphs were used given the annual, 365-day period. NOC remained rather stable through 2009 and 2014. There was a slightly downward trend in the ratio until 2011, decreasing by 4% and 5% for the years 2009 and 2010. In 2011 there was a small change with a 1% increase. The largest change occurred from 2013 and 2014, when the number of days outstanding increased by 7%. This was due to a relatively low amount of sales compared to other years of sale throughout 2009 to 2014 of $23,979. Overall, NOC decreased their days outstanding from 44.8 days in 2009 to 42.7 days in 2014. Through the years 2009 to 2014, GD’s average days until collection are 47.2. In 2009, GD collected payment in 41.9 days, while in 2014, the company collected in 47.9 days. GD’s Days Sales Outstanding increases from 2009 to 2013, by a year-to-year average of 5%. The largest increase is seen from 2010 to 2011, when the days increased by 13% from 43 to 49 days. A slight decline in the days sales outstanding occurs from 2013 to 2014, by 8%. From 2010 to 2011 accounts receivable increased by 13%, while sales only increased by 1%. In 2014, accounts receivable decreased by 8%, while sales did not change. 0 10 20 30 40 50 60 2008 2009 2010 2011 2012 2013 2014 2015 Days Days Sales Outstanding NOC GD Industry
  • 17. Northrop Grumman Corporation 14 NOC, GD, and the industry are all fairly similar in their days of sales outstanding ratio, calculating with 365-day annual period. The averages were as follows: NOC 42.13 days; GD 47.28 days; industry 48.049 days. Some larger gaps occur when comparing NOC and GD’s number of days outstanding. In 2013, there is a difference of 11.8 days. GD starts in 2009, below the industry average, but from 2011 to 2014 GD remains above the industry and NOC. GD is experiencing a longer amount of days until the company collects, this may be signifying a negative trend in their ability to collect payments. There are some significant factors that may be effecting the days of uncollected sales. NOC and GD both contract most of their sales through their main customer, the United States government. This may yield longer wait times for payment, due to processing times, than other industries. GD is also positioned NOC and the industry in inventory turnover, yet profit margins on sales remain high. This may indicate GD is selling larger ticketed items. Larger individual accounts and big inventory item sales may increase the collection time required, compared with selling smaller inventory items. GD may be more flexible in collecting payments, providing customers with a longer collection time, due to the high cost of the item to the consumer.
  • 18. Northrop Grumman Corporation 15 Total Assets Turnover Ratio Aside from an increase in 2011, NOC’s Total Asset Turnover declines each year. An increase of 14% in NOC’s Total Asset Turnover is seen from the year 2010 to 2011. The following year, the ratio declines by 9%. In 2011, total assets decreased by 24%, while sales decreased by 7%. Year-to-year total assets and sales declined by the same amount, an averaged 3%. Comparing the year 2009 to 2014, total assets decreased by 14%, and sales decreased by 15%. GD’s Total Asset Turnover ratio downwardly trends from 2009 to 2014. Decreasing by a year-to-year average of 3%. Comparing year 2009 to 2014, a decline of 18% is seen in the ratio. Year-to-year GD’s total assets increased by 2%, while sales declined by 1%. Comparing the year 2009 to 2014, total assets increased by 12%, while sales declined by 4%. In 2012, sales declined by 5%. In 2011, a 7% increase is observed in GD’s total assets. The industry’s Total Asset Turnover remains fairly level throughout the period. Overall, the industry’s total asset turnover experienced a decrease of 1% each year. The largest change in the ratio occurs from the years 2010 to 2011, decreasing by 3%. GD starts at a higher 0.0 0.2 0.4 0.6 0.8 1.0 1.2 2008 2009 2010 2011 2012 2013 2014 2015 Times Total Asset Turnover NOC GD Industry
  • 19. Northrop Grumman Corporation 16 figure in the starting year, yet follows a similar declining trend through the years. When both the industry and GD declined in 2011, NOC experienced an increase in their ratio. Fixed Assets Turnover Ratio NOC’s Fixed Asset Turnover takes a sharp incline from 2009 to 2010 by a 39% increase in the ratio, followed by a slight decline in 2011 of 7%. From 2011 to 2013 the ratio remains stable at a minimal incline of 1%. From the year 2013 to 2014 a downward turn in the ratio occurs of 10%. In 2010, net fixed assets declined by 60%, while sales increased by only 2%. This contributes to the sharp incline seen in the ratio. In the following year, net fixed assets remained unchanged, and sales decreased by 7%. From 2011 to 2013, fixed assets and sales decrease proportion to each other. GD’s Fixed Asset Turnover starts higher than both the industry and NOC, at a ratio value of 1.0, then downwardly trends to a value of 0.87. The largest decline in the ratio occurs from 2010 to 2012, decreasing by 3%, 6%, and 4%. Year-to-year, the ratio decreases by 3%. An 18% decrease is seen from the starting to end ratio value. In 2011, fixed assets increased 0.0 2.0 4.0 6.0 8.0 10.0 12.0 2008 2009 2010 2011 2012 2013 2014 2015 Times Fixed Asset Turnover NOC GD Industry
  • 20. Northrop Grumman Corporation 17 by 10%, while sales increased by 1%, contributing to the largest decline in the ratio. In 2012, fixed assets increased again by 3%, while sales decreased by 5%. GD’s sales decrease on average year-to-year by 1%, while fixed assets increased year-to-year by 3%. The industry data for the Fixed Asset Turnover ratio remains an overall flat trend from 2009 to 2014, with a slight upward trend presented with an averaged 1% increase year-to-year. The largest change is seen in 2012 when a 7% increase is observed, creating a slightly upward rise in the trend. The industry ratio compared to GD and NOC vary significantly in year 2009. The industry ratio starts at 7.36, GD at 10.98, and NOC at 5.68. Other than in year 2009, NOC appears to remain over the industry average, yet a downward dive is seen in 2014, as it nearly approaches the industry ratio. GD is positioned well above the industry average during much of the period. GD’s ratio value nearly reaches NOC’s in the years 2012 and 2013. There is a wide divide in GD’s ratio value when compared to the values of NOC and the industry from the years 2009 to 2011. From 2012 to 2014, the ratio values of the industry, NOC, and GD are the closest in range. The largest difference in 2014’s ratio value was 1.61, between GD and the industry, while year 2009’s ratio value difference was 5.3, between GD and NOC
  • 21. Northrop Grumman Corporation 18 Profitability Ratios Profit Margin on Sales NOC’s Profit Margin on Sales ratio has a steady upward trend from 2009 to 2011, followed by a slight decline from 2011 to 2013. From 2013 to 2014 there is an upward curve. For the first 2 years, the ratio increased by 16 and 9%. The ratio decreased by 2% in 2012, due to net income’s decrease of 7% and sales decrease of 5%. Sales have remained in a stable decline year-to-year by an average 3%. Net Income increases by a year-to-year average of 4%. From 2009 to 2014, Net Income has increased by 19%, showing steady growth in revenues gained on sales. According to this ratio, it appears NOC is adequately and efficiently managing their costs in relation to their sales, as the company is steadily increasing profit margins. Disregarding the year 2012, GD’s Profit Margin on Sales ratio has remained fairly consistent with a gradual upward trend from 2009 to 2014. The significantly sharp decline in 2012 is mainly due to the goodwill impairment affecting GD’s net income by a decrease -2% 0% 2% 4% 6% 8% 10% 2008 2009 2010 2011 2012 2013 2014 2015 Profit Margin on Sales NOC GD Industry
  • 22. Northrop Grumman Corporation 19 of 861% from 2011, as previously discussed in the times interest earned analysis. Since the transaction is non-cash, GD’s analysis should be evaluated for the company’s overall trending. GD’s profit margin ratio increased by 9% from the starting figure to ending figure. Sales decreased year-to-year by an averaged 1%. In 2014 sales remained the same, while net income increased by 7%. The industry’s Profit Margin on Sales ratio is substantially lower than GD and NOC. The industry’s ratio trends upward throughout the period, with a more substantial rise in 2010 by 52%, followed by a slight decline of 23% in 2011. In 2012 a larger increase is seen in the ratio with a rise by 32%. On average, the ratio rose year-to-year by 15%. The average profit margins are: NOC 0.08, GD O.06, and industry 0.04. NOC and GD’s higher ratios, in comparison to the top 10-industry average, may indicate adequate managing of expenses in relation to sales. A good proportion of GD and NOC’s sales are being converted into net income. The industry’s overall ratio may suggest past performance of high expenses in relation to overall sales. GD had a higher profit margin in the years 2009 and 2010, prior to the disturbance in the ratio caused by the goodwill impairment. In 2014, GD’s profit margins remain just under NOCs. While GD has a lower profit margin ratio, the company’s times interest earned ratio is significantly higher than NOCs. The stability of GD’s return on sales may indicate the company could responsibility take on more debt with success. Both GD and NOC appear to maintain lower expenses and higher overall sales when compared to the industry average. GD’s sales appear to be declining by an averaged 1% year-to-year, while NOC’s sales declined by 3% year-to-year.
  • 23. Northrop Grumman Corporation 20 Return on Total Assets The Return on Assets Ratio shows a similar trending to the Profit Margin on Sales. NOC’s ratio is observed to trend more sharply at an incline from 2009 to the peak in 2011. The peak in 2011 is slightly higher than the peak for the profit margin ratio. There is a slight decline from 2012 to 2013, followed by a gradual upward trend to 2014. From the starting value to finishing value, an increase by 28% in the return on assets ratio occurred. The rise from 2009 to 2011 is due to the increase in net income by 20% in 2010 and decrease in total assets by 24% in 2011. Influencing the downward trends from 2010 to 2011 in both the current and quick ratio, these decreases represent the decrease in current assets by 78% for those years. This decrease in current assets contributes to the change in total assets influencing the Return on Asset Ratio contributing to the decrease of 24% in total assets during the same years. The decrease in total assets and simultaneous increase in net income by 3% in 2011 explains the sharp rise in the Return on Assets Ratio. The ratio decline from the peak of 2011 to 2013 corresponds with a 7 and 1% decrease in net income during those years. Product sales decreased by 9% from 2011 to 2012, decreasing total sales by 5%, -2% 0% 2% 4% 6% 8% 10% 2008 2009 2010 2011 2012 2013 2014 2015 Return on Assets NOC GD Industry
  • 24. Northrop Grumman Corporation 21 down by 12% from 2010. The ending upward trend in 2014 is due to a 6% increase in net income. In NOC’s SEC 2012 Statement of Earnings and Comprehensive Income, a reported value of $3,130 is given. GD’s Return on Asset Ratio shows a slight declining trend from 2009 to 2011, a downward turn in 2011, a sharp decline and rise from 2011 to 2013, with a slight rise in 2014. The sharp decline in 2012 was mainly due to Goodwill Impairment’s effect on net income. To assume a more realistic normality, removing the decline in 2012, GD’s average ROA was 7.36. With 2012 removed, ROA from 2011 to 2012 decreased by 9%. The previous year, from 2010 to 2011, the ratio decreased by 11%. This decline is in result of a simultaneous increase in total assets by 7% and decrease in net income by 4%. Total assets increased mainly in response to an increase in accounts receivable by 13%. This same increase was the contributor to the largest change in the days sales outstanding ratio, increasing the number of days by 6.13 days. Other assets also increased by 11% from the previous year, along with other current assets increasing by 15%. From 2011 to 2013 a large increase is noted in current assets. From 2011 to 2013 there’s a rise in GD’s current ratio by 7%, largely due to an increase of 15% in current assets from 2011 to 2013. In the current assets, cash and equivalents increased by 50% from 2011 to 2013. The combining factors on this asset increase and decrease in net income, resulted in the decline from 2011 to 2013, disregarding the effects of the goodwill impairment. The industry averages are much lower in ROA compared to GD and NOC. Held assets in the industry may be incurring too high of costs when compared to the income being generated by the same asset. There is an upward trend in the industry ROA, with a sharp increase from 2009 to 2010, followed by a slight downturn in 2011. From 2011 to 2014, the industry ROA gradually inclines. In 2009, ROA was rather low compared to 2014, represented by a change of 64%. Similar to profit margin, wide fluctuations are observed from 2010 to 2012. Due to the similar trending in ROA and profit margin, it seems net income was generally low and fluctuating in the industry as a whole. GD’s sharp decline in ROA in 2011 is largely due to goodwill impairment, however an increase in product costs and expenses occurred by 6% from 2011 to 2012, and sales of products sold decreased by 11% from 2010 to 2012. This may lead to the conclusion that GD’s product costs were too excessive to support the sales incurred from products from 2010 to 2012.
  • 25. Northrop Grumman Corporation 22 Return on Equity NOC’s Return on Equity ratio trends below their competitor from 2009 to 2011. The ratio has an upward shift from 2010 to 2011, followed by a slight downfall from 2012 to 2013. NOC’s ROE makes a sharp incline from 2013 to 2014, reaching 28.6%. NOC’s ROE has a year-by-year increase of an averaged 13%. Positioned well above the industry, from 2009 to 2014, the ratio has increased by 54%. NOC’s ROA and PMS show similar increasing trends, contributed by the fact that the company’s net income did experience a 6% increase from 2013 to 2014, and increased each year by an averaged 2%. However, this sharper rise from 2013 to 2014, specific to ROE is caused by the strong decline of 47% in owner’s equity. Upon recent acquisitions, NOC’s current position demonstrates their success in using investor’s funds more efficiently in profit generation. Shifting upward trends should increase investor’s confidence in management’s decisions. GD’s Return on Equity ratio trends above NOC and the industry for 2009 and 2010. ROE shifts to a sharp decline in 2011, as acquisitions have been reassessed. GD’s goodwill impairment affected the shape decline seen in ROE for 2012. During this year net income plummeted by 861%. Additionally, product costs and expenses increased costs by 6%, -5% 0% 5% 10% 15% 20% 25% 30% 35% 2008 2009 2010 2011 2012 2013 2014 2015 Return on Equity NOC GD Industry
  • 26. Northrop Grumman Corporation 23 while sales from products sold by 8% from 2011 to 2012. GD has undergone changes in their product focus and core competencies, as the market has shifted areas of demand. GD’s ROE ratio takes a sharper incline in 2014, when compared to ROA and Profit Margin on Sales. This is mainly due to a decrease in owners’ equity by 23%. All of GD’s profitability ratios are positioned towards an upward trending due to a 7% rise in net income for the year 2014. In 2009, ROE for the industry was at a low of 4.74%. This low in 2009 is congruent other ratios, ROA, Profit Margin on Sales, Debt ratio, and Current ratio. 2009 there was an overall more hostile market environment. It appears the industry was selling their inventory at a faster rate to attempt to increase profits and net income, yet at a lower price in the market. This is demonstrated by a high inventory turnover ratio and low profit margin on sales. From 2009 to 2012, the industry’s ROE ratio shows a strong upward shift, demonstrating a successful recovery from the market environment, which brought lows in 2009. The largest increase in seen from 2011 to 2012, when ROE increased by 43%. However, the next year, a sharp decline is seen as the ratio falls by 50%. ROE is now on another upward trend, yet remains below GD and NOC. On average, ROE has increased by 16% each year, showing successful market incline since 2009, with a starting and ending difference depicted by an increase of 71% in the ratio.
  • 27. Northrop Grumman Corporation 24 DuPont Analyses Return on Total Assets ROA= (Profit Margin) x (Total Asset Turnover) ROA= (Net Income/Sales) x (Sales/Total Assets) = Net Income/Total Assets NOC ROA= 2,069 x 23,979 23,979 26,572 0.086283832 x 0.902416077 = 7.79% GD ROA= 2,533 x 30,852 30,852 35,355 0.0821016 x 0.8726347 = 7.16% NOC maintains a higher ROA than GD. Both of NOC’s profit margin and total asset turnover excel that of GDs. While NOC’s DuPont is a more favorable value than GDs, GD’s overall profit margin was influenced by a large change in net income. Due to this, the companies may be more neutrally aligned than the DuPont depicts. However, DuPont’s lower value for GD’s total asset turnover is accurate, and the company’s overall decreasing trend raises concern. This decrease may be linked to the fact that GD is turning over less of their inventory; GD’s inventory turnover is also on a sharp downward trend. GD maintains a relatively high profit margin on the inventory the company is selling, and with the shifting upward trend in profit margin on sales, it appears each individual inventory item GD is selling is bringing larger profits. GD may be shifting towards selling an increased amount of their larger inventory items, rather than total inventory. This shift in selling may be caused by the change in market demand, affected by the global changes in national defense needs and increasing security threats.
  • 28. Northrop Grumman Corporation 25 Return on Equity ROE= Net Income/Owner’s Equity ROE= (Profit Margin) x (Total Asset Turnover) x (Equity Multiplier) ROE – (Net Income/Sales) x (Sales/Total Assets) x (1/1-debt ratio) NOC ROE= 2,069 x 23,979 x 1 23,979 26,572 (1- .7277) 0.086283832 x 0.902416077 x 3.672 = 28.59% GD ROE= 2,533 x 30,852 x 1 30,852 35,355 (1- .6654) 0.0821016 x 0.8726347 x 2.989 = 21.41% NOC is positioned significantly higher than GD in ROE. This difference is much more substantial than their positions in ROA. NOC has a better equity multiplier than GD, largely influencing the ROE in the DuPont analysis. NOC has much greater financial leverage at this time than GD. While NOC’s total asset turnover has downward shifted, the company’s inventory turnover has shifted upward. The company is selling more of their inventory, most likely due to the market’s overall increasing demand. NOC is selling inventory at adequate pricing, as depicted by the consistency in the upward trending in the profit margin on sales ratio. NOC should review their asset management to ensure their assets continue to generate an adequate amount of sales. GD may need to review their inventory and assets management. According to the company’s 10-k, GD has had many new acquisitions, effecting the 2009 to 2014 ratios. While management’s acquisition decisions are done in hopes to broaden GD’s future successes, these changes have shifted the companies positioned to below their competitor for
  • 29. Northrop Grumman Corporation 26 this time. Concern raised for management’s overvaluing of their new acquisitions, may be supported by the significant goodwill impairment that effected net income in 2011. The company’s inventory turnover ratio is below the average market; this may be explained by describing the differences in their products when compared to other companies in the industry, however there are some trends that should raise awareness. While, their position as a whole is relatively stable, the decreasing trend in total asset turnover, and large downward shift in this ratio is congruent with the position of company’s ROE from the years 2011 to 2014. GD’s ratios were on a higher averaged trend, above NOC prior to the 2011 to 2014 shift. The company’s fluctuations may be warranted, if revenues are projected to increase. ROE has turned and is trending upwards, however asset management needs to be evaluated, as the trend for Total Asset Turnover has not changed in 2014, and persists at a decline. The inventory the company is selling, must be selling at higher prices, due to the upward trend in the company’s profit margin on sales.
  • 30. Northrop Grumman Corporation 27 Excel Spreadsheet Printouts NOC Spreadsheet
  • 31. Northrop Grumman Corporation 28 GD Spreadsheet
  • 32. Northrop Grumman Corporation 29 Excel Ratio Checking Spreadsheet Printouts NOC Checker GD Checker
  • 33. Northrop Grumman Corporation 30 SEC Financial Statements for GD CONSOLIDATED STATEMENTS OF EARNINGS (LOSS) 2014 Year Ended December 31 (Dollars in millions, except per-share amounts) 2014 2013 2012 Revenues: Products $ 19,564 $ 19,100 $ 19,264 Services 11,288 11,830 11,728 30,852 30,930 30,992 Operating costs and expenses: Products 15,335 15,065 15,830 Services 9,644 10,137 10,182 Goodwill impairment — — 1,994 General and administrative (G&A) 1,984 2,039 2,221 26,963 27,241 30,227 Operating earnings 3,889 3,689 765 Interest, net (86) (86) (156) Other, net (1) 8 (136) Earnings from continuing operations before income tax 3,802 3,611 473 Provision for income tax, net 1,129 1,125 854 Earnings (loss) from continuing operations 2,673 2,486 (381) Discontinued operations, net of tax of ($16) in 2014, ($73) in 2013, and $19 in 2012 (140) (129) 49 Net earnings (loss) $ 2,533 $ 2,357 $ (332) Earnings (loss) per share Basic: Continuing operations $ 7.97 $ 7.09 $ (1.08) Discontinued operations (0.41) (0.37) 0.14 Net earnings (loss) $ 7.56 $ 6.72 $ (0.94) Diluted: Continuing operations $ 7.83 $ 7.03 $ (1.08) Discontinued operations (0.41) (0.36) 0.14 Net earnings (loss) $ 7.42 $ 6.67 $ (0.94) The accompanying Notes to Consolidated Financial Statements are an integral part of these statements. (Dollars in millions) 2014 2013 2012 Net earnings (loss) $ 2,533 $ 2,357 $ (332) (Losses) gains on cash flow hedges (279) 3 (23)
  • 34. Northrop Grumman Corporation 31 Unrealized gains on securities 10 12 6 Foreign currency translation adjustments (436) (118) 141 Change in retirement plans’ funded status (1,745) 2,595 (1,149) Other comprehensive (loss) income, pretax (2,450) 2,492 (1,025) (Benefit) provision for income tax, net (703) 902 (562) Other comprehensive (loss) income, net of tax (1,747) 1,590 (463) Comprehensive income (loss) $ 786 $ 3,947 $ (795) The accompanying Notes to Consolidated Financial Statements are an integral part of these statements. CONSOLIDATED BALANCE SHEETS December 31 (Dollars in millions) 2014 2013 ASSETS Current assets: Cash and equivalents $ 4,388 $ 5,301 Accounts receivable 4,050 4,370 Contracts in process 4,591 4,780 Inventories 3,221 2,890 Other current assets 1,157 821 Total current assets 17,407 18,162 Noncurrent assets: Property, plant and equipment, net 3,329 3,359 Intangible assets, net 912 1,044 Goodwill 11,731 11,932 Other assets 1,976 997 Total noncurrent assets 17,948 17,332 Total assets $ 35,355 $ 35,494 LIABILITIES AND SHAREHOLDERS’ EQUITY Current liabilities: Short-term debt and current portion of long-term debt $ 501 $ 1 Accounts payable 2,057 2,216 Customer advances and deposits 7,335 6,584 Other current liabilities 3,858 3,458 Total current liabilities 13,751 12,259 Noncurrent liabilities: Long-term debt 3,410 3,908 Other liabilities 6,365 4,826 Commitments and contingencies (see Note N) Total noncurrent liabilities 9,775 8,734
  • 35. Northrop Grumman Corporation 32 Shareholders’ equity: Common stock 482 482 Surplus 2,548 2,226 Retained earnings 21,127 19,428 Treasury stock (9,396) (6,450) Accumulated other comprehensive loss (2,932) (1,185) Total shareholders’ equity 11,829 14,501 Total liabilities and shareholders’ equity $ 35,355 $ 35,494 The accompanying Notes to Consolidated Financial Statements are an integral part of these statements. CONSOLIDATED STATEMENTS OF EARNINGS (LOSS) 2013 Year Ended December 31 (Dollars in millions, except per-share amounts) 2011 2012 2013 Revenues: Products $ 21,440 $ 19,784 $ 19,371 Services 11,237 11,729 11,847 32,677 31,513 31,218 Operating costs and expenses: Products 17,230 16,228 15,296 Services 9,591 10,182 10,158 Goodwill impairment — 1,994 — General and administrative (G&A) 2,030 2,276 2,079 28,851 30,680 27,533 Operating earnings 3,826 833 3,685 Interest, net (141) (156) (86) Other, net 33 (136) 8 Earnings from continuing operations before income taxes 3,718 541 3,607 Provision for income taxes, net 1,166 873 1,121 Earnings (loss) from continuing operations 2,552 (332) 2,486 Discontinued operations, net of tax (26) — (129) Net earnings (loss) $ 2,526 $ (332) $ 2,357 Earnings (loss) per share Basic: Continuing operations $ 7.01 $ (0.94) $ 7.09
  • 36. Northrop Grumman Corporation 33 Discontinued operations (0.07) — (0.37) Net earnings (loss) $ 6.94 $ (0.94) $ 6.72 Diluted: Continuing operations $ 6.94 $ (0.94) $ 7.03 Discontinued operations (0.07) — (0.36) Net earnings (loss) $ 6.87 $ (0.94) $ 6.67 The accompanying Notes to Consolidated Financial Statements are an integral part of these statements. CONSOLIDATED STATEMENTS OF COMPREHENSIVE INCOME (LOSS) Year Ended December 31 (Dollars in millions) 2011 2012 2013 Net earnings (loss) $ 2,526 $ (332) $ 2,357 Gains (losses) on cash flow hedges (81) (23) 3 Unrealized gains (losses) on securities (1) 6 12 Foreign currency translation adjustments (89) 141 (118) Change in retirement plans’ funded status (1,129) (1,149) 2,595 Other comprehensive income (loss) before tax (1,300) (1,025) 2,492 Provision (benefit) for income tax, net (424) (562) 902 Other comprehensive income (loss), net of tax (876) (463) 1,590 Comprehensive income (loss) $ 1,650 $ (795) $ 3,947 The accompanying Notes to Consolidated Financial Statements are an integral part of these statements CONSOLIDATED BALANCE SHEETS December 31 (Dollars in millions) 2012 2013 ASSETS Current assets: Cash and equivalents $ 3,296 $ 5,301 Accounts receivable 4,204 4,402
  • 37. Northrop Grumman Corporation 34 Contracts in process 4,964 4,780 Inventories 2,776 2,968 Other current assets 504 435 Total current assets 15,744 17,886 Noncurrent assets: Property, plant and equipment, net 3,403 3,415 Intangible assets, net 1,383 1,217 Goodwill 12,048 11,977 Other assets 1,731 953 Total noncurrent assets 18,565 17,562 Total assets $ 34,309 $ 35,448 LIABILITIES AND SHAREHOLDERS’ EQUITY Current liabilities: Accounts payable $ 2,469 $ 2,248 Customer advances and deposits 6,042 6,584 Other current liabilities 3,109 3,362 Total current liabilities 11,620 12,194 Noncurrent liabilities: Long-term debt 3,908 3,908 Other liabilities 7,391 4,845 Commitments and contingencies (see Note N) Total noncurrent liabilities 11,299 8,753 Shareholders’ equity: Common stock 482 482 Surplus 1,988 2,226 Retained earnings 17,860 19,428 Treasury stock (6,165) (6,450) Accumulated other comprehensive loss (2,775) (1,185) Total shareholders’ equity 11,390 14,501 Total liabilities and shareholders’ equity $ 34,309 $ 35,448 The accompanying Notes to Consolidated Financial Statements are an integral part of these statements. CONSOLIDATED STATEMENTS OF EARNINGS (LOSS) 2012 Year Ended December 31 (Dollars in millions, except per-share amounts) 2010 2011 2012
  • 38. Northrop Grumman Corporation 35 Revenues: Products $ 21,723 $ 21,440 $ 19,784 Services 10,743 11,237 11,729 32,466 32,677 31,513 Operating costs and expenses: Products 17,359 17,230 16,228 Services 9,198 9,591 10,182 Goodwill impairment — — 1,994 General and administrative (G&A) 1,964 2,030 2,276 28,521 28,851 30,680 Operating earnings 3,945 3,826 833 Interest, net (157) (141) (156) Other, net 2 33 (136) Earnings from continuing operations before income taxes 3,790 3,718 541 Provision for income taxes, net 1,162 1,166 873 Earnings (loss) from continuing operations 2,628 2,552 (332) Discontinued operations, net of tax (4) (26) — Net earnings (loss) $ 2,624 $ 2,526 $ (332) Earnings (loss) per share Basic: Continuing operations $ 6.89 $ 7.01 $ (0.94) Discontinued operations (0.01) (0.07) — Net earnings (loss) $ 6.88 $ 6.94 $ (0.94) Diluted: Continuing operations $ 6.82 $ 6.94 $ (0.94) Discontinued operations (0.01) (0.07) — Net earnings (loss) $ 6.81 $ 6.87 $ (0.94) The accompanying Notes to Consolidated Financial Statements are an integral part of these statements. CONSOLIDATED STATEMENTS OF COMPREHENSIVE INCOME (LOSS) Year Ended December 31 (Dollars in millions) 2010 2011 2012 Net earnings (loss) $ 2,624 $ 2,526 $ (332) Net gain (loss) on cash flow hedges 89 (81) (23) Unrealized gains (losses) on securities 1 (1) 6 Foreign currency translation adjustments 308 (89) 141
  • 39. Northrop Grumman Corporation 36 Change in retirement plans’ funded status (878) (1,129) (1,149) Other comprehensive loss before tax (480) (1,300) (1,025) Benefit for income tax, net (251) (424) (562) Other comprehensive loss, net of tax (229) (876) (463) Comprehensive income (loss) $ 2,395 $ 1,650 $ (795) The accompanying Notes to Consolidated Financial Statements are an integral part of these statements. CONSOLIDATED BALANCE SHEETS December 31 (Dollars in millions) 2011 2012 ASSETS Current assets: Cash and equivalents $ 2,649 $ 3,296 Accounts receivable 4,429 4,204 Contracts in process 5,168 4,964 Inventories 2,310 2,776 Other current assets 812 504 Total current assets 15,368 15,744 Noncurrent assets: Property, plant and equipment, net 3,284 3,403 Intangible assets, net 1,813 1,383 Goodwill 13,576 12,048 Other assets 842 1,731 Total noncurrent assets 19,515 18,565 Total assets $ 34,883 $ 34,309 LIABILITIES AND SHAREHOLDERS’ EQUITY Current liabilities: Accounts payable $ 2,895 $ 2,469 Customer advances and deposits 5,011 6,042 Other current liabilities 3,239 3,109 Total current liabilities 11,145 11,620 Noncurrent liabilities: Long-term debt 3,907 3,908 Other liabilities 6,599 7,391 Commitments and contingencies (See Note N) Total noncurrent liabilities 10,506 11,299 Shareholders’ equity: Common stock 482 482
  • 40. Northrop Grumman Corporation 37 Surplus 1,888 1,988 Retained earnings 18,917 17,860 Treasury stock (5,743) (6,165) Accumulated other comprehensive loss (2,312) (2,775) Total shareholders’ equity 13,232 11,390 Total liabilities and shareholders’ equity $ 34,883 $ 34,309 The accompanying Notes to Consolidated Financial Statements are an integral part of these statements. CONSOLIDATED STATEMENT OF EARNINGS 2011 Year Ended December 31 (Dollars in millions, except per-share amounts) 2009 2010 2011 Revenues: Products $ 21,977 $ 21,723 $ 21,440 Services 10,004 10,743 11,237 31,981 32,466 32,677 Operating costs and expenses: Products 17,808 17,359 17,230 Services 8,544 9,198 9,591 General and administrative 1,954 1,964 2,030 28,306 28,521 28,851 Operating earnings 3,675 3,945 3,826 Interest, net (160) (157) (141) Other, net (2) 2 33 Earnings from continuing operations before income taxes 3,513 3,790 3,718 Provision for income taxes, net 1,106 1,162 1,166
  • 41. Northrop Grumman Corporation 38 Earnings from continuing operations 2,407 2,628 2,552 Discontinued operations, net of tax (13) (4) (26) Net earnings $ 2,394 $ 2,624 $ 2,526 Earnings per share Basic: Continuing operations $ 6.24 $ 6.89 $ 7.01 Discontinued operations (0.03) (0.01) (0.07) Net earnings $ 6.21 $ 6.88 $ 6.94 Diluted: Continuing operations $ 6.20 $ 6.82 $ 6.94 Discontinued operations (0.03) (0.01) (0.07) Net earnings $ 6.17 $ 6.81 $ 6.87 The accompanying Notes to Consolidated Financial Statements are an integral part of this statement. 36 General Dynamics Annual Report 2011 CONSOLIDATED BALANCE SHEET December 31 (Dollars in millions) 2010 2011 ASSETS Current assets: Cash and equivalents $ 2,613 $ 2,649 Accounts receivable 3,848 4,452 Contracts in process 4,873 5,168 Inventories 2,158 2,310
  • 42. Northrop Grumman Corporation 39 Other current assets 694 789 Total current assets 14,186 15,368 Noncurrent assets: Property, plant and equipment, net 2,971 3,284 Intangible assets, net 1,992 1,813 Goodwill 12,649 13,576 Other assets 747 842 Total noncurrent assets 18,359 19,515 Total assets $ 32,545 $ 34,883 LIABILITIES AND SHAREHOLDERS’ EQUITY Current liabilities: Short-term debt and current portion of long-term debt $ 773 $ 23 Accounts payable 2,736 2,895 Customer advances and deposits 4,465 5,011 Other current liabilities 3,203 3,216 Total current liabilities 11,177 11,145 Noncurrent liabilities: Long-term debt 2,430 3,907 Other liabilities 5,622 6,599 Commitments and contingencies (see Note N) Total noncurrent liabilities 8,052 10,506 Shareholders’ equity:
  • 43. Northrop Grumman Corporation 40 Common stock 482 482 Surplus 1,729 1,888 Retained earnings 17,076 18,917 Treasury stock (4,535) (5,743) Accumulated other comprehensive loss (1,436) (2,312) Total shareholders’ equity 13,316 13,232 Total liabilities and shareholders’ equity $ 32,545 $ 34,883 The accompanying Notes to Consolidated Financial Statements are an integral part of this statement. General Dynamics Annual Report 2011 37 CONSOLIDATED STATEMENT OF EARNINGS 2010 Year Ended December 31 (Dollars in millions, except per-share amounts) 2008 2009 2010 Revenues: Products $ 20,185 $ 21,977 $ 21,619 Services 9,115 10,004 10,847 29,300 31,981 32,466 Operating costs and expenses: Products 16,230 17,808 17,253 Services 7,698 8,544 9,304 General and administrative 1,719 1,954 1,964 25,647 28,306 28,521 Operating earnings 3,653 3,675 3,945
  • 44. Northrop Grumman Corporation 41 Interest, net (66) (160) (157) Other, net 17 (2) 2 Earnings from continuing operations before income taxes 3,604 3,513 3,790 Provision for income taxes, net 1,126 1,106 1,162 Earnings from continuing operations 2,478 2,407 2,628 Discontinued operations, net of tax (19) (13) (4) Net earnings $ 2,459 $ 2,394 $ 2,624 Earnings per share Basic: Continuing operations $ 6.26 $ 6.24 $ 6.89 Discontinued operations (0.05) (0.03) (0.01) Net earnings $ 6.21 $ 6.21 $ 6.88 Diluted: Continuing operations $ 6.22 $ 6.20 $ 6.82 Discontinued operations (0.05) (0.03) (0.01) Net earnings $ 6.17 $ 6.17 $ 6.81 The accompanying Notes to Consolidated Financial Statements are an integral part of this statement. 36 General Dynamics Annual Report Ÿ 2010 CONSOLIDATED BALANCE SHEET December 31 (Dollars in millions) 2009 2010 ASSETS
  • 45. Northrop Grumman Corporation 42 Current assets: Cash and equivalents $ 2,263 $ 2,613 Accounts receivable 3,678 3,848 Contracts in process 4,449 4,873 Inventories 2,126 2,158 Other current assets 733 694 Total current assets 13,249 14,186 Noncurrent assets: Property, plant and equipment, net 2,912 2,971 Intangible assets, net 2,098 1,992 Goodwill 12,269 12,649 Other assets 549 747 Total noncurrent assets 17,828 18,359 Total assets $ 31,077 $ 32,545 LIABILITIES AND SHAREHOLDERS’ EQUITY Current liabilities: Short-term debt and current portion of long-term debt $ 705 $ 773 Accounts payable 2,365 2,736 Customer advances and deposits 4,313 4,465 Other current liabilities 2,988 3,203 Total current liabilities 10,371 11,177 Noncurrent liabilities:
  • 46. Northrop Grumman Corporation 43 Long-term debt 3,159 2,430 Other liabilities 5,124 5,622 Commitments and contingencies (see Note N) Total noncurrent liabilities 8,283 8,052 Shareholders’ equity: Common stock 482 482 Surplus 1,518 1,729 Retained earnings 15,093 17,076 Treasury stock (3,463) (4,535) Accumulated other comprehensive loss (1,207) (1,436) Total shareholders’ equity 12,423 13,316 Total liabilities and shareholders’ equity $ 31,077 $ 32,545 The accompanying Notes to Consolidated Financial Statements are an integral part of this statement. General Dynamics Annual Report Ÿ 2010 37
  • 47. Northrop Grumman Corporation 44 SEC Financial Statements for NOC CONSOLIDATED STATEMENTS OF EARNINGS AND COMPREHENSIVE (LOSS) INCOME 2014 Year Ended December 31 $ in millions, except per share amounts 2014 2013 2012 Sales Product $ 14,015 $ 14,033 $ 13,838 Service 9,964 10,628 11,380 Total sales 23,979 24,661 25,218 Operating costs and expenses Product 10,431 10,623 10,415 Service 7,947 8,659 9,223 General and administrative expenses 2,405 2,256 2,450 Operating income 3,196 3,123 3,130 Other (expense) income Interest expense (282) (257) (212) Other, net 23 (3) 47 Earnings before income taxes 2,937 2,863 2,965 Federal and foreign income tax expense 868 911 987 Net earnings $ 2,069 $ 1,952 $ 1,978 Basic earnings per share $ 9.91 $ 8.50 $ 7.96 Weighted-average common shares outstanding, in millions 208.8 229.6 248.6 Diluted earnings per share $ 9.75 $ 8.35 $ 7.81 Weighted-average diluted shares outstanding, in millions 212.1 233.9 253.4 Net earnings (from above) $ 2,069 $ 1,952 $ 1,978 Other comprehensive (loss) income Change in unamortized benefit plan costs, net of tax benefit (expense) of $1,423 in 2014, ($1,177) in 2013 and $860 in 2012 (2,316) 1,790 (1,303) Change in cumulative translation adjustment (59) 14 8 Other, net 3 (1) (2) Other comprehensive (loss) income, net of tax (2,372) 1,803 (1,297) Comprehensive (loss) income $ (303) $ 3,755 $ 681 The accompanying notes are an integral part of these consolidated financial statements. CONSOLIDATED STATEMENTS OF FINANCIAL POSITION December 31
  • 48. Northrop Grumman Corporation 45 $ in millions 2014 2013 Assets Cash and cash equivalents $ 3,863 $ 5,150 Accounts receivable, net 2,806 2,685 Inventoried costs, net 742 698 Deferred tax assets 404 605 Prepaid expenses and other current assets 369 350 Total current assets 8,184 9,488 Property, plant and equipment, net of accumulated depreciation of $4,611 in 2014 and $4,337 in 2013 2,991 2,806 Goodwill 12,466 12,438 Non-current deferred tax assets 1,622 209 Other non-current assets 1,309 1,440 Total assets $ 26,572 $ 26,381 Liabilities Trade accounts payable $ 1,305 $ 1,229 Accrued employee compensation 1,441 1,446 Advance payments and amounts in excess of costs incurred 1,713 1,722 Other current liabilities 1,433 1,418 Total current liabilities 5,892 5,815 Long-term debt, net of current portion of $3 in 2014 and $2 in 2013 5,925 5,928 Pension and other post-retirement benefit plan liabilities 6,555 2,954 Other non-current liabilities 965 1,064 Total liabilities 19,337 15,761 Commitments and contingencies (Note 11) Shareholders’ equity Preferred stock, $1 par value; 10,000,000 shares authorized; no shares issued and outstanding — — Common stock, $1 par value; 800,000,000 shares authorized; issued and outstanding: 2014—198,930,240 and 2013—217,599,230 199 218 Paid-in capital — 848 Retained earnings 12,392 12,538 Accumulated other comprehensive loss (5,356) (2,984) Total shareholders’ equity 7,235 10,620 Total liabilities and shareholders’ equity $ 26,572 $ 26,381 The accompanying notes are an integral part of these consolidated financial statements. -42-
  • 49. Northrop Grumman Corporation 46 NORTHROP GRUMMAN CORPORATION CONSOLIDATED STATEMENTS OF EARNINGS AND COMPREHENSIVE INCOME 2013 Year Ended December 31 $ in millions, except per share amounts 2013 2012 2011 Sales Product $14,033 $13,838 $15,073 Service 10,628 11,380 11,339 Total sales 24,661 25,218 26,412 Operating costs and expenses Product 10,623 10,415 11,491 Service 8,659 9,223 9,295 General and administrative expenses 2,256 2,450 2,350 Operating income 3,123 3,130 3,276 Other (expense) income Interest expense (257) (212) (221) Other, net (3) 47 28 Earnings from continuing operations before income taxes 2,863 2,965 3,083 Federal and foreign income tax expense 911 987 997 Earnings from continuing operations 1,952 1,978 2,086 Earnings from discontinued operations, net of tax — — 32 Net earnings $ 1,952 $ 1,978 $ 2,118 Basic earnings per share Continuing operations $ 8.50 $ 7.96 $ 7.54 Discontinued operations — — 0.11 Basic earnings per share $ 8.50 $ 7.96 $ 7.65 Weighted-average common shares outstanding, in millions 229.6 248.6 276.8 Diluted earnings per share Continuing operations $ 8.35 $ 7.81 $ 7.41 Discontinued operations — — 0.11 Diluted earnings per share $ 8.35 $ 7.81 $ 7.52 Weighted-average diluted shares outstanding, in millions 233.9 253.4 281.6 Net earnings (from above) $ 1,952 $ 1,978 $ 2,118 Other comprehensive income Change in unamortized benefit plan costs, net of tax (expense) benefit of ($1,177) in 2013, $860 in 2012 and $823 in 2011 1,790 (1,303) (1,249)
  • 50. Northrop Grumman Corporation 47 Change in cumulative translation adjustment 14 8 (4) Change in unrealized loss on marketable securities and cash flow hedges, net of tax benefit of $1 in 2013, $0 in 2012 and $2 in 2011 (1) (2) (4) Other comprehensive income (loss), net of tax 1,803 (1,297) (1,257) Comprehensive income $ 3,755 $ 681 $ 861 The accompanying notes are an integral part of these consolidated financial statements. -44- NORTHROP GRUMMAN CORPORATION CONSOLIDATED STATEMENTS OF FINANCIAL POSITION December 31 $ in millions 2013 2012 Assets Cash and cash equivalents $ 5,150 $ 3,862 Accounts receivable, net 2,685 2,858 Inventoried costs, net 698 798 Deferred tax assets 605 574 Prepaid expenses and other current assets 350 300 Total current assets 9,488 8,392 Property, plant and equipment, net of accumulated depreciation of $4,337 in 2013 and $4,146 in 2012 2,806 2,887 Goodwill 12,438 12,431 Non-current deferred tax assets 209 1,542 Other non-current assets 1,440 1,291 Total assets $26,381 $26,543 Liabilities Trade accounts payable $ 1,229 $ 1,392 Accrued employee compensation 1,169 1,173 Advance payments and amounts in excess of costs incurred 1,722 1,759 Other current liabilities 1,695 1,732 Total current liabilities 5,815 6,056 Long-term debt, net of current portion of $2 in 2013 and $5 in 2012 5,928 3,930 Pension and other post-retirement benefit plan liabilities 2,954 6,085 Other non-current liabilities 1,064 958
  • 51. Northrop Grumman Corporation 48 Total liabilities 15,761 17,029 Commitments and contingencies (Note 12) Shareholders’ equity Preferred stock, $1 par value; 10,000,000 shares authorized; no shares issued and outstanding — — Common stock, $1 par value; 800,000,000 shares authorized; issued and outstanding: 2013—217,599,230 and 2012—239,209,812 218 239 Paid-in capital 848 2,924 Retained earnings 12,538 11,138 Accumulated other comprehensive loss (2,984) (4,787) Total shareholders’ equity 10,620 9,514 Total liabilities and shareholders’ equity $26,381 $26,543 The accompanying notes are an integral part of these consolidated financial statements. -45- NORTHROP GRUMMAN CORPORATION CONSOLIDATED STATEMENTS OF EARNINGS AND COMPREHENSIVE INCOME 2012 Year Ended December 31 $ in millions, except per share amounts 2012 2011 2010 Sales Product $13,838 $15,073 $16,091 Service 11,380 11,339 12,052 Total sales 25,218 26,412 28,143
  • 52. Northrop Grumman Corporation 49 Operating costs and expenses Product 10,415 11,491 12,558 Service 9,223 9,295 10,291 General and administrative expenses 2,450 2,350 2,467 Operating income 3,130 3,276 2,827 Other (expense) income Interest expense (212) (221) (269) Charge on debt redemption — — (229) Other, net 47 28 37 Earnings from continuing operations before income taxes 2,965 3,083 2,366 Federal and foreign income tax expense 987 997 462 Earnings from continuing operations 1,978 2,086 1,904 Earnings from discontinued operations, net of tax — 32 149 Net earnings $ 1,978 $ 2,118 $ 2,053 Basic earnings per share Continuing operations $ 7.96 $ 7.54 $ 6.41 Discontinued operations — 0.11 0.50 Basic earnings per share $ 7.96 $ 7.65 $ 6.91
  • 53. Northrop Grumman Corporation 50 Weighted-average common shares outstanding, in millions 248.6 276.8 296.9 Diluted earnings per share Continuing operations $ 7.81 $ 7.41 $ 6.32 Discontinued operations — 0.11 0.50 Diluted earnings per share $ 7.81 $ 7.52 $ 6.82 Weighted-average diluted shares outstanding, in millions 253.4 281.6 301.1 Net earnings (from above) $ 1,978 $ 2,118 $ 2,053 Other comprehensive income Change in cumulative translation adjustment 8 (4) (41) Change in unrealized (loss) gain on marketable securities and cash flow hedges, net of tax benefit of $0 in 2012, $2 in 2011, and $0 in 2010 (2) (4) 1 Change in unamortized benefit plan costs, net of tax benefit (expense) of $860 in 2012, $823 in 2011, and $(183) in 2010 (1,303) (1,249) 297 Other comprehensive (loss) income, net of tax (1,297) (1,257) 257 Comprehensive income $ 681 $ 861 $ 2,310 The accompanying notes are an integral part of these consolidated financial statements.
  • 54. Northrop Grumman Corporation 51 43 Table of Contents NORTHROP GRUMMAN CORPORATION CONSOLIDATED STATEMENTS OF FINANCIAL POSITION December 31 $ in millions 2012 2011 Assets Cash and cash equivalents $ 3,862 $ 3,002 Accounts receivable, net of progress payments 2,858 2,964 Inventoried costs, net of progress payments 798 873 Deferred tax assets 574 496 Prepaid expenses and other current assets 300 411 Total current assets 8,392 7,746 Property, plant and equipment, net of accumulated depreciation of $4,146 in 2012 and $3,933 in 2011 2,887 3,047 Goodwill 12,431 12,374 Non-current deferred tax assets 1,542 900
  • 55. Northrop Grumman Corporation 52 Other non-current assets 1,291 1,344 Total assets $26,543 $25,411 Liabilities Trade accounts payable $ 1,392 $ 1,481 Accrued employee compensation 1,173 1,196 Advance payments and billings in excess of costs incurred 1,759 1,777 Other current liabilities 1,732 1,681 Total current liabilities 6,056 6,135 Long-term debt, net of current portion of $5 in 2012 and 2011 3,930 3,935 Pension and post-retirement plan liabilities 6,085 4,079 Other non-current liabilities 958 926 Total liabilities 17,029 15,075 Commitments and contingencies (Note 12) Shareholders’ equity Preferred Stock, $1 par value; 10,000,000 shares authorized; no shares issued and outstanding — — Common stock, $1 par value; 800,000,000 shares authorized; issued and 239 254
  • 56. Northrop Grumman Corporation 53 outstanding: 2012 — 239,209,812; 2011 — 253,889,622 Paid-in capital 2,924 3,873 Retained earnings 11,138 9,699 Accumulated other comprehensive loss (4,787) (3,490) Total shareholders’ equity 9,514 10,336 Total liabilities and shareholders’ equity $26,543 $25,411 The accompanying notes are an integral part of these consolidated financial statements. 44 Table of Contents NORTHROP GRUMMAN CORPORATION CONSOLIDATED STATEMENTS OF OPERATIONS Year Ended December 31 $ in millions, except per share amounts 2011 2010 2009 Sales and Service Revenues Product sales $15,073 $16,091 $16,004 Service revenues 11,339 12,052 11,646 Total sales and service revenues 26,412 28,143 27,650 Cost of Sales and Service Revenues
  • 57. Northrop Grumman Corporation 54 Cost of product sales 11,491 12,558 12,648 Cost of service revenues 9,295 10,291 10,157 General and administrative expenses 2,350 2,467 2,571 Operating income 3,276 2,827 2,274 Other (expense) income Interest expense (221) (269) (269) Charge on debt redemption (229) Other, net 28 37 65 Earnings from continuing operations before income taxes 3,083 2,366 2,070 Federal and foreign income tax expense 997 462 636 Earnings from continuing operations 2,086 1,904 1,434 Earnings from discontinued operations, net of tax 32 149 252 Net earnings $ 2,118 $ 2,053 $ 1,686 Basic Earnings Per Share Continuing operations $ 7.54 $ 6.41 $ 4.49 Discontinued operations .11 .50 .79 Basic earnings per share $ 7.65 $ 6.91 $ 5.28 Weighted-average common shares outstanding, in millions 276.8 296.9 319.2 Diluted Earnings Per Share Continuing operations $ 7.41 $ 6.32 $ 4.44 Discontinued operations .11 .50 .77 Diluted earnings per share $ 7.52 $ 6.82 $ 5.21
  • 58. Northrop Grumman Corporation 55 Weighted-average diluted shares outstanding, in millions 281.6 301.1 323.3 Net earnings (from above) $ 2,118 $ 2,053 $ 1,686 Other comprehensive (loss) income Change in cumulative translation adjustment (4) (41) 31 Change in unrealized (loss) gain on marketable securities and cash flow hedges, net of tax benefit (expense) of $2 in 2011, $0 in 2010, and $(23) in 2009 (4) 1 36 Change in unamortized benefit plan costs, net of tax benefit (expense) of $823 in 2011, $(183) in 2010, and $(374) in 2009 (1,249) 297 561 Other comprehensive (loss) income, net of tax (1,257) 257 628 Comprehensive income $ 861 $ 2,310 $ 2,314 The accompanying notes are an integral part of these consolidated financial statements. -58- Table of Contents NORTHROP GRUMMAN CORPORATION CONSOLIDATED STATEMENTS OF FINANCIAL POSITION December 31 $ in millions 2011 2010 Assets Current Assets Cash and cash equivalents $ 3,002 $ 3,701 Accounts receivable, net of progress payments 2,964 3,329 Inventoried costs, net of progress payments 873 896 Deferred tax assets 496 392 Prepaid expenses and other current assets 411 244
  • 59. Northrop Grumman Corporation 56 Assets of discontinued operations 5,212 Total current assets 7,746 13,774 Property, Plant, and Equipment Land and land improvements 375 363 Buildings and improvements 1,433 1,363 Machinery and other equipment 4,143 3,972 Capitalized software costs 444 451 Leasehold improvements 585 608 Property, plant, and equipment, cost 6,980 6,757 Accumulated depreciation (3,933) (3,712) Property, plant, and equipment, net 3,047 3,045 Other Assets Goodwill 12,374 12,376 Other purchased intangibles, net of accumulated amortization of $1,650 in 2011 and $1,613 in 2010 155 192 Pension and post-retirement plan assets 153 320 Long-term deferred tax assets 900 628 Miscellaneous other assets 1,036 1,075 Total other assets 14,618 14,591 Total assets $25,411 $31,410 Liabilities and Shareholders’ Equity Current Liabilities Notes payables to banks and current portion of long-term debt $ 13 $ 784
  • 60. Northrop Grumman Corporation 57 Trade accounts payable 1,481 1,573 Accrued employees’ compensation 1,196 1,146 Advance payments and billings in excess of costs incurred 1,777 1,969 Other current liabilities 1,668 1,763 Liabilities of discontinued operations 2,792 Total current liabilities 6,135 10,027 Long-term debt, net of current portion 3,935 3,940 Pension and post-retirement plan liabilities 4,079 3,089 Other long-term liabilities 926 918 Total liabilities 15,075 17,974 Commitments and Contingencies (Note 15) Shareholders’ Equity Preferred Stock, $1 par value; 10,000,000 shares authorized; no shares issued and outstanding in 2011 and 2010 Common stock, $1 par value; 800,000,000 shares authorized; issued and outstanding: 2011 — 253,889,622; 2010 — 290,956,752 254 291 Paid-in capital 3,873 7,778 Retained earnings 9,699 8,124 Accumulated other comprehensive loss (3,490) (2,757) Total shareholders’ equity 10,336 13,436 Total liabilities and shareholders’ equity $25,411 $31,410 The accompanying notes are an integral part of these consolidated financial statements. -59-
  • 61. Northrop Grumman Corporation 58 CONSOLIDATED STATEMENTS OF OPERATIONS 2010 Year Ended December 31 $ in millions, except per share amounts 2010 2009 2008 Sales and Service Revenues Product sales $21,776 $20,914 $19,634 Service revenues 12,981 12,841 12,681 Total sales and service revenues 34,757 33,755 32,315 Cost of Sales and Service Revenues Cost of product sales 16,820 16,591 15,490 Cost of service revenues 11,789 11,539 10,885 General and administrative expenses 3,078 3,142 3,143 Goodwill impairment 3,060 Operating income (loss) 3,070 2,483 (263 ) Other (expense) income Interest expense (281 ) (281 ) (295 ) Charge on debt redemption (231 ) Other, net 37 64 38 Earnings (loss) from continuing operations before income taxes 2,595 2,266 (520 ) Federal and foreign income taxes 557 693 859 Earnings (loss) from continuing operations 2,038 1,573 (1,379) Earnings from discontinued operations, net of tax 15 113 117 Net earnings (loss) $ 2,053 $ 1,686 $(1,262) Basic Earnings (Loss) Per Share Continuing operations $ 6.86 $ 4.93 $ (4.12 ) Discontinued operations .05 .35 .35 Basic earnings (loss) per share $ 6.91 $ 5.28 $ (3.77 ) Weighted-average common shares outstanding, in millions 296.9 319.2 334.5 Diluted Earnings (Loss) Per Share Continuing operations $ 6.77 $ 4.87 $ (4.12 ) Discontinued operations .05 .34 .35 Diluted earnings (loss) per share $ 6.82 $ 5.21 $ (3.77 ) Weighted-average diluted shares outstanding, in millions 301.1 323.3 334.5 Net earnings (loss) from above $ 2,053 $ 1,686 $(1,262) Other comprehensive income (loss) Change in cumulative translation adjustment (41 ) 31 (24 ) Change in unrealized gain (loss) on marketable securities and cash flow hedges, net of tax benefit (expense) of $0 in 2010, $(23) in 2009, and $22 in 2008 1 36 (35 ) Change in unamortized benefit plan costs, net of tax (expense) benefit of $(183) in 2010, $(374) in 2009 and $1,888 in 2008 297 561 (2,884) Other comprehensive income (loss), net of tax 257 628 (2,943) Comprehensive income (loss) $ 2,310 $ 2,314 $(4,205) The accompanying notes are an integral part of these consolidated financial statements. -62-
  • 62. Northrop Grumman Corporation 59 Table of Contents NORTHROP GRUMMAN CORPORATION CONSOLIDATED STATEMENTS OF FINANCIAL POSITION 2011 December 31 December 31 $ in millions 2010 2009 Assets Current Assets Cash and cash equivalents $ 3,701 $ 3,275 Accounts receivable, net of progress payments 4,057 3,394 Inventoried costs, net of progress payments 1,185 1,170 Deferred tax assets 710 524 Prepaid expenses and other current assets 251 272 Total current assets 9,904 8,635 Property, Plant, and Equipment Land and land improvements 666 649 Buildings and improvements 2,658 2,422 Machinery and other equipment 5,134 4,759 Capitalized software costs 636 624 Leasehold improvements 670 630 9,764 9,084 Accumulated depreciation (4,722 ) (4,216 ) Property, plant, and equipment, net 5,042 4,868 Other Assets Goodwill 13,517 13,517 Other purchased intangibles, net of accumulated amortization of $1,965 in 2010 and $1,871 in 2009 779 873 Pension and post-retirement plan assets 450 300 Long-term deferred tax assets 612 1,010 Miscellaneous other assets 1,117 1,049 Total other assets 16,475 16,749 Total assets $ 31,421 $ 30,252 Liabilities and Shareholders’ Equity Current Liabilities Notes payable to banks $ 10 $ 12 Current portion of long-term debt 774 91 Trade accounts payable 1,846 1,921 Accrued employees’ compensation 1,349 1,281 Advance payments and billings in excess of costs incurred 2,076 1,954 Other current liabilities 2,331 1,726 Total current liabilities 8,386 6,985 Long-term debt, net of current portion 4,045 4,191 Pension and post-retirement plan liabilities 4,116 4,874 Other long-term liabilities 1,317 1,515 Total liabilities 17,864 17,565 Commitments and Contingencies (Note 16) Shareholders’ Equity Common stock, $1 par value; 800,000,000 shares authorized; issued and outstanding: 2010—290,956,752; 2009—306,865,201 291 307 Paid-in capital 7,778 8,657 Retained earnings 8,245 6,737 Accumulated other comprehensive loss (2,757 ) (3,014 ) Total shareholders’ equity 13,557 12,687 Total liabilities and shareholders’ equity $ 31,421 $ 30,252
  • 63. Northrop Grumman Corporation 60 The accompanying notes are an integral part of these consolidated financial statements.
  • 64. Northrop Grumman Corporation 61 Industry Data Source Mergent Online eStatement Studies Northrop Grumman Corp (NYS: NOC) Northrop Grumman Corp (NYS: NOC) General Company Information Principal Office Website 2980 Fairview Park Drive Falls Church, VA 22042 USA www.northropgrumman.com Phone Primary NAICS 703 280-2900 334511 : Search, Detection, Navigation, Guidance, Aeronautical, and Nautical System and Instrument Manufacturing Auditor Closing Stock Price Deloitte & Touche LLP 162.3 (as of 09/04/2015) Number of Employees Incorporated 64,300 (Year End Average Staff as of 12/31/2014) May 1939 , CA, United States Country Mergent Dividend Achiever United States No Exchange and Ticker Number of Shareholders NYS : NOC 26,699 (approx.) (as of 01/29/2015) Primary SIC Annual Meeting 3812 : Search and navigation equipment In May * all results are stated in US Dollars Peer Grouping by: NAIC Peer Scope: worldwide Company Name Current Ratio - 2014
  • 65. Northrop Grumman Corporation 62 Peer Avr: 1.32 BAE Systems Plc 0.74 Bosch (Robert) GmbH (Germany Fed. Rep.) 2.1 Finmeccanica S.p.A. 0.98 Lockheed Martin Corp. 1.11 NEC Corp 1.52