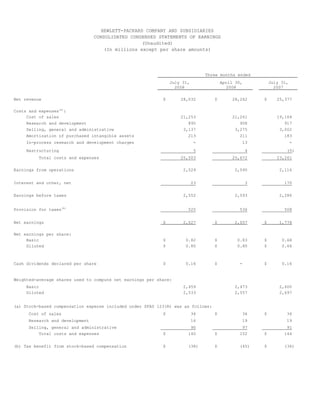
1. HEWLETT-PACKARD COMPANY AND SUBSIDIARIES
CONSOLIDATED CONDENSED STATEMENTS OF EARNINGS
(Unaudited)
(In millions except per share amounts)
Three months ended
July 31, April 30, July 31,
2008 2008 2007
Net revenue $ 28,032 $ 28,262 $ 25,377
Costs and expenses(a):
Cost of sales 21,253 21,261 19,164
Research and development 895 908 917
Selling, general and administrative 3,137 3,275 3,002
Amortization of purchased intangible assets 213 211 183
In-process research and development charges - 13 -
Restructuring 5 4 (5)
Total costs and expenses 25,503 25,672 23,261
Earnings from operations 2,529 2,590 2,116
Interest and other, net 23 3 170
Earnings before taxes 2,552 2,593 2,286
Provision for taxes(b) 525 536 508
Net earnings $ 2,027 $ 2,057 $ 1,778
Net earnings per share:
Basic $ 0.82 $ 0.83 $ 0.68
Diluted $ 0.80 $ 0.80 $ 0.66
Cash dividends declared per share $ 0.16 $ - $ 0.16
Weighted-average shares used to compute net earnings per share:
Basic 2,459 2,473 2,600
Diluted 2,533 2,557 2,697
(a) Stock-based compensation expense included under SFAS 123(R) was as follows:
Cost of sales $ 34 $ 36 $ 34
Research and development 16 19 19
Selling, general and administrative 90 97 91
Total costs and expenses $ 140 $ 152 $ 144
(b) Tax benefit from stock-based compensation $ (38) $ (45) $ (36)
2. HEWLETT-PACKARD COMPANY AND SUBSIDIARIES
CONSOLIDATED CONDENSED STATEMENTS OF EARNINGS
(Unaudited)
(In millions except per share amounts)
Nine months ended
July 31, July 31,
2008 2007
Net revenue $ 84,761 $ 75,993
Costs and expenses(a):
Cost of sales 64,013 57,583
Research and development 2,701 2,697
Selling, general and administrative 9,653 8,954
Amortization of purchased intangible assets 630 596
In-process research and development charges 13 186
Restructuring 19 407
Pension curtailments and pension settlements, net - (517)
Total costs and expenses 77,029 69,906
Earnings from operations 7,732 6,087
Interest and other, net 98 391
Earnings before taxes 7,830 6,478
Provision for taxes(b) 1,613 1,378
Net earnings $ 6,217 $ 5,100
Net earnings per share:
Basic $ 2.49 $ 1.93
Diluted $ 2.41 $ 1.87
Cash dividends declared per share $ 0.32 $ 0.32
Weighted-average shares used to compute net earnings per share:
Basic 2,497 2,648
Diluted 2,577 2,734
(a) Stock-based compensation expense included under SFAS 123(R) was as follows:
Cost of sales $ 106 $ 121
Research and development 55 56
Selling, general and administrative 288 284
Total costs and expenses $ 449 $ 461
(b) Tax benefit from stock-based compensation $ (130) $ (128)
3. HEWLETT-PACKARD COMPANY AND SUBSIDIARIES
ADJUSTMENTS TO GAAP NET EARNINGS, EARNINGS FROM OPERATIONS,
OPERATING MARGIN AND EARNINGS PER SHARE
(Unaudited)
(In millions except per share amounts)
Three Three Three
months Diluted months Diluted months Diluted
ended earnings ended earnings ended earnings
July 31, per April 30, per July 31, per
2008 share 2008 share 2007 share
GAAP net earnings $ 2,027 $ 0.80 $ 2,057 $ 0.80 $ 1,778 $ 0.66
Non-GAAP adjustments:
Amortization of purchased
213 0.08 211 0.08 183 0.07
intangible assets
In-process research and
- - 13 0.01 - -
development charges
Restructuring 5 - 4 - (5) -
Pension curtailments and
pension settlements, net - - - - - -
Adjustments for taxes (57) (0.02) (56) (0.02) (44) (0.02)
Non-GAAP net earnings $ 2,188 $ 0.86 $ 2,229 $ 0.87 $ 1,912 $ 0.71
GAAP earnings from operations $ 2,529 $ 2,590 $ 2,116
Non-GAAP adjustments:
Amortization of purchased
213 211 183
intangible assets
In-process research and
- 13 -
development charges
Restructuring 5 4 (5)
Pension curtailments and
pension settlements, net - - -
Non-GAAP earnings from operations $ 2,747 $ 2,818 $ 2,294
GAAP operating margin 9% 9% 8%
Non-GAAP adjustments 1% 1% 1%
Non-GAAP operating margin 10% 10% 9%
4. HEWLETT-PACKARD COMPANY AND SUBSIDIARIES
ADJUSTMENTS TO GAAP NET EARNINGS, EARNINGS FROM OPERATIONS,
OPERATING MARGIN AND EARNINGS PER SHARE
(Unaudited)
(In millions except per share amounts)
Nine months Diluted Nine months Diluted
ended earnings ended earnings
July 31, 2008 per share July 31, 2007 per share
GAAP net earnings $ 6,217 $ 2.41 $ 5,100 $ 1.87
Non-GAAP adjustments:
Amortization of purchased
intangible assets 630 0.24 596 0.22
In-process research and
development charges 13 0.01 186 0.07
Restructuring 19 0.01 407 0.15
Pension curtailments and
pension settlements, net - - (517) (0.19)
Adjustments for taxes (171) (0.07) (114) (0.05)
Non-GAAP net earnings $ 6,708 $ 2.60 $ 5,658 $ 2.07
GAAP earnings from operations $ 7,732 $ 6,087
Non-GAAP adjustments:
Amortization of purchased
intangible assets 630 596
In-process research and
development charges 13 186
Restructuring 19 407
Pension curtailments and
pension settlements, net - (517)
Non-GAAP earnings from operations $ 8,394 $ 6,759
GAAP operating margin 9% 8%
Non-GAAP adjustments 1% 1%
Non-GAAP operating margin 10% 9%
5. HEWLETT-PACKARD COMPANY AND SUBSIDIARIES
CONSOLIDATED CONDENSED BALANCE SHEETS
(In millions)
July 31, October 31,
2008 2007
(unaudited)
ASSETS
Current assets:
Cash and cash equivalents $ 14,783 $ 11,293
Short-term investments 64 152
Accounts receivable 13,754 13,420
Financing receivables 2,594 2,507
Inventory 8,160 8,033
Other current assets 11,681 11,997
Total current assets 51,036 47,402
Property, plant and equipment 7,971 7,798
Long-term financing receivables and other assets 10,306 7,647
Goodwill and purchased intangible assets 26,581 25,852
Total assets $ 95,894 $ 88,699
LIABILITIES AND STOCKHOLDERS' EQUITY
Current liabilities:
Notes payable and short-term borrowings $ 3,591 $ 3,186
Accounts payable 14,021 11,787
Employee compensation and benefits 3,206 3,465
Taxes on earnings 806 1,891
Deferred revenue 5,664 5,025
Other accrued liabilities 14,612 13,906
Total current liabilities 41,900 39,260
Long-term debt 6,628 4,997
Other liabilities 8,871 5,916
Stockholders' equity 38,495 38,526
Total liabilities and stockholders' equity $ 95,894 $ 88,699
6. HEWLETT-PACKARD COMPANY AND SUBSIDIARIES
CONSOLIDATED CONDENSED STATEMENTS OF CASH FLOWS
(Unaudited)
(In millions)
Three months Nine months
ended ended
July 31, 2008 July 31, 2008
Cash flows from operating activities:
Net earnings $ 2,027 $ 6,217
Adjustments to reconcile net earnings to
net cash provided by operating activities:
Depreciation and amortization 759 2,268
Stock-based compensation expense 140 449
Provision for bad debt and inventory 111 296
In-process research and development charges - 13
Restructuring 5 19
Deferred taxes on earnings 177 1,163
Excess tax benefit from stock-based compensation (50) (213)
Other, net (2) (25)
Changes in assets and liabilities:
Accounts and financing receivables (239) (437)
Inventory (541) (255)
Accounts payable 1,590 2,148
Taxes on earnings 101 (269)
Restructuring (14) (69)
Other assets and liabilities (701) 10
Net cash provided by operating activities 3,363 11,315
Cash flows from investing activities:
Investment in property, plant and equipment (651) (1,966)
Proceeds from sale of property, plant and equipment 78 271
Purchases of available-for-sale securities
and other investments (8) (86)
Maturities and sales of available-for-sale
securities and other investments 21 212
Payments made in connection with business
acquisitions, net (213) (1,478)
Net cash used in investing activities (773) (3,047)
Cash flows from financing activities:
Issuance (repayment) of commercial paper and notes
payable, net 1,877 (21)
Issuance of debt 36 3,054
Payment of debt (43) (1,051)
Issuance of common stock under employee stock plans 430 1,347
Repurchase of common stock (1,551) (7,720)
Excess tax benefit from stock-based compensation 50 213
Dividends (197) (600)
Net cash provided by (used in) financing activities 602 (4,778)
Increase in cash and cash equivalents 3,192 3,490
Cash and cash equivalents at beginning of period 11,591 11,293
Cash and cash equivalents at end of period $ 14,783 $ 14,783
7. HEWLETT-PACKARD COMPANY AND SUBSIDIARIES
SEGMENT INFORMATION
(Unaudited)
(In millions)
Three months ended
July 31, April 30, July 31,
2007(a)
2008 2008
Net revenue:
Enterprise Storage and Servers $ 4,741 $ 4,780 $ 4,516
HP Services 4,753 4,627 4,165
HP Software 781 727 606
Technology Solutions Group 10,275 10,134 9,287
Personal Systems Group 10,254 10,071 8,894
Imaging and Printing Group 6,979 7,591 6,751
HP Financial Services 680 685 582
Corporate Investments 271 230 220
Total Segments 28,459 28,711 25,734
Eliminations of intersegment net revenue and other (427) (449) (357)
Total HP Consolidated $ 28,032 $ 28,262 $ 25,377
Earnings (Loss) from operations:
Enterprise Storage and Servers $ 544 $ 655 $ 507
HP Services 574 508 417
HP Software 122 93 51
Technology Solutions Group 1,240 1,256 975
Personal Systems Group 587 544 519
Imaging and Printing Group 1,048 1,230 981
HP Financial Services 51 47 39
Corporate Investments 26 6 (5)
Total Segments 2,952 3,083 2,509
Corporate and unallocated costs and eliminations (85) (134) (101)
Unallocated costs related to stock-based compensation
expense (120) (131) (114)
Amortization of purchased intangible assets (213) (211) (183)
In-process research and development charges - (13) -
Restructuring (5) (4) 5
Pension curtailments and pension settlements, net - - -
Interest and other, net 23 3 170
Total HP Consolidated Earnings Before Taxes $ 2,552 $ 2,593 $ 2,286
(a) Certain fiscal 2008 organizational reclassifications have been reflected retroactively to provide improved visibility and
comparability. For each of the quarters in fiscal year 2007, the reclassifications resulted in the transfer of revenue and
operating profit among the Enterprise Storage and Servers, HP Services and HP Software segments within the Technology
Solutions Group. There was no impact on the previously reported financial results for the other segments.
8. HEWLETT-PACKARD COMPANY AND SUBSIDIARIES
SEGMENT INFORMATION
(Unaudited)
(In millions)
Nine months ended
July 31,
2007(a)
2008
Net revenue:
Enterprise Storage and Servers $ 14,341 $ 13,531
HP Services 13,758 12,222
HP Software 2,174 1,772
Technology Solutions Group 30,273 27,525
Personal Systems Group 31,116 26,276
Imaging and Printing Group 21,882 20,911
HP Financial Services 2,007 1,679
Corporate Investments 719 552
Total Segments 85,997 76,943
Eliminations of intersegment net revenue and other (1,236) (950)
Total HP Consolidated $ 84,761 $ 75,993
Earnings (Loss) from operations:
Enterprise Storage and Servers $ 1,872 $ 1,412
HP Services 1,571 1,272
HP Software 266 76
Technology Solutions Group 3,709 2,760
Personal Systems Group 1,759 1,350
Imaging and Printing Group 3,428 3,221
HP Financial Services 141 107
Corporate Investments 40 (52)
Total Segments 9,077 7,386
Corporate and unallocated costs and eliminations (308) (242)
Unallocated costs related to stock-based compensation
expense (375) (385)
Amortization of purchased intangible assets (630) (596)
In-process research and development charges (13) (186)
Restructuring (19) (407)
Pension curtailments and pension settlements, net - 517
Interest and other, net 98 391
Total HP Consolidated Earnings Before Taxes $ 7,830 $ 6,478
(a) Certain fiscal 2008 organizational reclassifications have been reflected retroactively to provide improved
visibility and comparability. For each of the quarters in fiscal year 2007, the reclassifications resulted
in the transfer of revenue and operating profit among the Enterprise Storage and Servers, HP Services and HP
Software segments within the Technology Solutions Group. There was no impact on the previously reported
financial results for the other segments.
9. HEWLETT-PACKARD COMPANY AND SUBSIDIARIES
SEGMENT / BUSINESS UNIT INFORMATION
(Unaudited)
(In millions)
Three months ended
July 31, April 30, July 31,
2007(a)
2008 2008
Net revenue:
Industry standard servers $ 2,874 $ 2,818 $ 2,814
Business critical systems 829 919 811
Storage 1,038 1,043 891
Enterprise Storage and Servers 4,741 4,780 4,516
Technology services 2,394 2,331 2,128
Outsourcing services 1,456 1,370 1,239
Consulting and integration 903 926 798
HP Services 4,753 4,627 4,165
Business technology optimization(b) 642 593 487
Other(b) 139 134 119
HP Software 781 727 606
Technology Solutions Group 10,275 10,134 9,287
Notebooks 5,350 5,373 4,254
Desktops 4,158 3,921 3,933
Workstations 468 494 441
Handhelds 90 102 116
Other 188 181 150
Personal Systems Group 10,254 10,071 8,894
Commercial Hardware 1,567 1,811 1,658
Consumer Hardware 861 974 996
Supplies 4,551 4,812 4,097
Other - (6) -
Imaging and Printing Group 6,979 7,591 6,751
HP Financial Services 680 685 582
Corporate Investments 271 230 220
Total Segments 28,459 28,711 25,734
Eliminations of intersegment net revenue and other (427) (449) (357)
Total HP Consolidated $ 28,032 $ 28,262 $ 25,377
(a) Certain fiscal 2008 organizational reclassifications have been reflected retroactively to provide improved
visibility and comparability. For each of the quarters in fiscal year 2007, the reclassifications resulted in
the transfer of revenue among Enterprise Storage and Servers, HP Services and HP Software segments within the
Technology Solutions Group. In addition, revenue was transferred among the business units within the Imaging
and Printing Group and among the business units within the Personal Systems Group, but there was no change to
the previously reported revenue for either segment as a whole. There was no impact on the previously reported
financial results for the HP Financial Services and Corporate Investments segments.
(b) The OpenView business unit was renamed as “Business Technology Optimization” and the OpenCall and Other
business unit was renamed as “Other” effective in fiscal 2008. The renamed quot;Otherquot; business unit includes
primarily the OpenCall and Business Information Optimization products.
10. HEWLETT-PACKARD COMPANY AND SUBSIDIARIES
SEGMENT / BUSINESS UNIT INFORMATION
(Unaudited)
(In millions)
Nine months ended
July 31,
2007(a)
2008
Net revenue:
Industry standard servers $ 8,680 $ 8,321
Business critical systems 2,603 2,519
Storage 3,058 2,691
Enterprise Storage and Servers 14,341 13,531
Technology services 6,966 6,310
Outsourcing services 4,129 3,568
Consulting and integration 2,663 2,344
HP Services 13,758 12,222
Business technology optimization(b) 1,783 1,384
Other(b) 391 388
HP Software 2,174 1,772
Technology Solutions Group 30,273 27,525
Notebooks 16,387 12,486
Desktops 12,480 11,667
Workstations 1,429 1,248
Handhelds 281 423
Other 539 452
Personal Systems Group 31,116 26,276
Commercial Hardware 5,104 4,983
Consumer Hardware 3,015 3,245
Supplies 13,762 12,683
Other 1 -
Imaging and Printing Group 21,882 20,911
HP Financial Services 2,007 1,679
Corporate Investments 719 552
Total Segments 85,997 76,943
Eliminations of intersegment net revenue and other (1,236) (950)
Total HP Consolidated $ 84,761 $ 75,993
(a) Certain fiscal 2008 organizational reclassifications have been reflected retroactively to provide improved
visibility and comparability. For each of the quarters in fiscal year 2007, the reclassifications resulted in
the transfer of revenue among Enterprise Storage and Servers, HP Services and HP Software segments within the
Technology Solutions Group. In addition, revenue was transferred among the business units within the Imaging
and Printing Group and among the business units within the Personal Systems Group, but there was no change to
the previously reported revenue for either segment as a whole. There was no impact on the previously reported
financial results for the HP Financial Services and Corporate Investments segments.
(b) The OpenView business unit was renamed as “Business Technology Optimization” and the OpenCall and Other
business unit was renamed as “Other” effective in fiscal 2008. The renamed quot;Otherquot; business unit includes
primarily the OpenCall and Business Information Optimization products.
11. HEWLETT-PACKARD COMPANY AND SUBSIDIARIES
CALCULATION OF NET EARNINGS PER SHARE
(Unaudited)
(In millions except per share amounts)
Three months ended
July 31, April 30, July 31,
2008 2008 2007
Numerator:
Net earnings $ 2,027 $ 2,057 $ 1,778
Adjustment for interest expense on zero-coupon
subordinated convertible notes, net of taxes - 1 1
Net earnings, adjusted $ 2,027 $ 2,058 $ 1,779
Denominator:
Weighted-average shares used to compute
basic EPS 2,459 2,473 2,600
Effect of dilutive securities:
Dilution from employee stock plans 74 79 89
Zero-coupon subordinated convertible notes - 5 8
Dilutive potential common shares 74 84 97
Weighted-average shares used to compute
diluted EPS 2,533 2,557 2,697
Net earnings per share:
Basic(a) $ 0.82 $ 0.83 $ 0.68
Diluted(b) $ 0.80 $ 0.80 $ 0.66
(a) HP's basic earnings per share was calculated based on net earnings and the weighted-average
number of shares outstanding during the reporting period.
(b) The diluted earnings per share included additional dilution from potential issuance of
common stock, such as stock issuable pursuant to exercise of stock options and conversion of
debt, except when such issuances would be antidilutive.
12. HEWLETT-PACKARD COMPANY AND SUBSIDIARIES
CALCULATION OF NET EARNINGS PER SHARE
(Unaudited)
(In millions except per share amounts)
Nine months ended
July 31,
2008 2007
Numerator:
Net earnings $ 6,217 $ 5,100
Adjustment for interest expense on zero-coupon
subordinated convertible notes, net of taxes 3 5
Net earnings, adjusted $ 6,220 $ 5,105
Denominator:
Weighted-average shares used to compute
basic EPS 2,497 2,648
Effect of dilutive securities:
Dilution from employee stock plans 76 78
Zero-coupon subordinated convertible notes 4 8
Dilutive potential common shares 80 86
Weighted-average shares used to compute
diluted EPS 2,577 2,734
Net earnings per share:
Basic(a) $ 2.49 $ 1.93
Diluted(b) $ 2.41 $ 1.87
(a) HP's basic earnings per share was calculated based on net earnings and the
weighted-average number of shares outstanding during the reporting period.
(b) The diluted earnings per share included additional dilution from potential
issuance of common stock, such as stock issuable pursuant to exercise of stock
options and conversion of debt, except when such issuances would be
antidilutive.
13. HEWLETT-PACKARD COMPANY AND SUBSIDIARIES
CALCULATION OF NON-GAAP NET EARNINGS PER SHARE
(Unaudited)
(In millions except per share amounts)
Three months ended
July 31, April 30, July 31,
2008 2008 2007
Numerator:
Non-GAAP net earnings $ 2,188 $ 2,229 $ 1,912
Adjustment for interest expense on zero-
coupon subordinated convertible notes,
net of taxes - 1 1
Non-GAAP net earnings, adjusted $ 2,188 $ 2,230 $ 1,913
Denominator:
Weighted-average shares used to compute
basic EPS 2,459 2,473 2,600
Effect of dilutive securities:
Dilution from employee stock plans 74 79 89
Zero-coupon subordinated convertible notes - 5 8
Dilutive potential common shares 74 84 97
Weighted-average shares used to compute
diluted EPS 2,533 2,557 2,697
Non-GAAP net earnings per share:
Basic(a) $ 0.89 $ 0.90 $ 0.74
Diluted(b) $ 0.86 $ 0.87 $ 0.71
(a) HP's basic non-GAAP earnings per share was calculated based on non-GAAP net earnings and the
weighted-average number of shares outstanding during the reporting period.
(b) HP’s diluted non-GAAP earnings per share included additional dilution from potential issuance
of common stock, such as stock issuable pursuant to exercise of stock options and conversion
of debt, except when such issuances would be antidilutive.
14. HEWLETT-PACKARD COMPANY AND SUBSIDIARIES
CALCULATION OF NON-GAAP NET EARNINGS PER SHARE
(Unaudited)
(In millions except per share amounts)
Nine months ended
July 31,
2008 2007
Numerator:
Non-GAAP net earnings $ 6,708 $ 5,658
Adjustment for interest expense on zero-
coupon subordinated convertible notes,
net of taxes 3 5
Non-GAAP net earnings, adjusted $ 6,711 $ 5,663
Denominator:
Weighted-average shares used to compute
basic EPS 2,497 2,648
Effect of dilutive securities:
Dilution from employee stock plans 76 78
Zero-coupon subordinated convertible notes 4 8
Dilutive potential common shares 80 86
Weighted-average shares used to compute
diluted EPS 2,577 2,734
Non-GAAP net earnings per share:
Basic(a) $ 2.69 $ 2.14
Diluted(b) $ 2.60 $ 2.07
(a) HP's basic non-GAAP earnings per share was calculated based on non-GAAP net
earnings and the weighted-average number of shares outstanding during the
reporting period.
(b) HP’s diluted non-GAAP earnings per share included additional dilution from potential
issuance of common stock, such as stock issuable pursuant to exercise of stock
options and conversion of debt, except when such issuances would be antidilutive.