High Class Call Girls Nagpur Grishma Call 7001035870 Meet With Nagpur Escorts
citigroup January 19, 2007 - Fourth Quarter Press Release
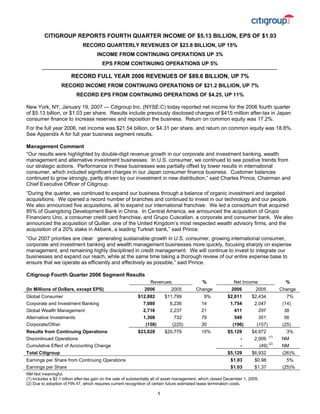
1. CITIGROUP REPORTS FOURTH QUARTER INCOME OF $5.13 BILLION, EPS OF $1.03
RECORD QUARTERLY REVENUES OF $23.8 BILLION, UP 15%
INCOME FROM CONTINUING OPERATIONS UP 3%
EPS FROM CONTINUING OPERATIONS UP 5%
RECORD FULL YEAR 2006 REVENUES OF $89.6 BILLION, UP 7%
RECORD INCOME FROM CONTINUING OPERATIONS OF $21.2 BILLION, UP 7%
RECORD EPS FROM CONTINUING OPERATIONS OF $4.25, UP 11%
New York, NY, January 19, 2007 — Citigroup Inc. (NYSE:C) today reported net income for the 2006 fourth quarter
of $5.13 billion, or $1.03 per share. Results include previously disclosed charges of $415 million after-tax in Japan
consumer finance to increase reserves and reposition the business. Return on common equity was 17.2%.
For the full year 2006, net income was $21.54 billion, or $4.31 per share, and return on common equity was 18.8%.
See Appendix A for full year business segment results.
Management Comment
“Our results were highlighted by double-digit revenue growth in our corporate and investment banking, wealth
management and alternative investment businesses. In U.S. consumer, we continued to see positive trends from
our strategic actions. Performance in these businesses was partially offset by lower results in international
consumer, which included significant charges in our Japan consumer finance business. Customer balances
continued to grow strongly, partly driven by our investment in new distribution,” said Charles Prince, Chairman and
Chief Executive Officer of Citigroup.
“During the quarter, we continued to expand our business through a balance of organic investment and targeted
acquisitions. We opened a record number of branches and continued to invest in our technology and our people.
We also announced five acquisitions, all to expand our international franchise. We led a consortium that acquired
85% of Guangdong Development Bank in China. In Central America, we announced the acquisition of Grupo
Financiero Uno, a consumer credit card franchise, and Grupo Cuscatlan, a corporate and consumer bank. We also
announced the acquisition of Quilter, one of the United Kingdom’s most respected wealth advisory firms, and the
acquisition of a 20% stake in Akbank, a leading Turkish bank,” said Prince.
“Our 2007 priorities are clear: generating sustainable growth in U.S. consumer, growing international consumer,
corporate and investment banking and wealth management businesses more quickly, focusing sharply on expense
management, and remaining highly disciplined in credit management. We will continue to invest to integrate our
businesses and expand our reach, while at the same time taking a thorough review of our entire expense base to
ensure that we operate as efficiently and effectively as possible,” said Prince.
Citigroup Fourth Quarter 2006 Segment Results
% %
Revenues Net Income
(In Millions of Dollars, except EPS) 2006 2006
2005 Change 2005 Change
$12,882 $2,611
Global Consumer $11,799 9% $2,434 7%
7,080 1,754
Corporate and Investment Banking 6,236 14 2,047 (14)
2,716 411
Global Wealth Management 2,237 21 297 38
1,308 549
Alternative Investments 732 79 351 56
(158) (196)
Corporate/Other (225) 30 (157) (25)
Results from Continuing Operations $23,828 $5,129
$20,779 15% $4,972 3%
2,009 (1)
-
Discontinued Operations NM
(49) (2)
-
Cumulative Effect of Accounting Change NM
Total Citigroup $5,129 $6,932 (26)%
$1.03
Earnings per Share from Continuing Operations $0.98 5%
$1.03
Earnings per Share $1.37 (25)%
NM Not meaningful.
(1) Includes a $2.1 billion after-tax gain on the sale of substantially all of asset management, which closed December 1, 2005.
(2) Due to adoption of FIN 47, which requires current recognition of certain future estimated lease termination costs.
1
2. Fourth Quarter Summary
• Revenues were a record, up 15%, driven by 14% revenue growth in corporate and investment banking, 79% in
alternative investments and 21% in global wealth management. Global consumer revenues increased 9%.
– International revenues grew 11%, with international corporate and investment banking up 20% and
international wealth management up 48%. International consumer revenues increased 2%, including the
impact of charges in Japan consumer finance.
– Deposits and loans grew 20% and 16%, respectively. In global consumer, investment AUMs increased
17%. Capital markets and banking ranked #1 in global debt underwriting, #2 in announced M&A and #2 in
global equity underwriting and global loan syndications for the full year 2006. In global wealth
management, client assets under fee-based management grew 15%.
• Operating expenses increased 23%, including 4 percentage points due to increased investment spending, 3
percentage points due to acquisitions and foreign exchange, and 2 percentage points due to SFAS 123(R)
accruals. The remaining expense growth was driven by higher business volumes, and the absence of a net
release of legal reserves that lowered expenses in the prior-year period.
– The company opened a record 380 new branches, including 288 internationally and 92 in the U.S. For the
full year 2006, a record 1,165 branches have been opened, of which 862 are international and 303 are in
the U.S.
• Credit costs increased 10%, as lower costs in U.S. consumer were more than offset by increased credit costs in
international consumer and corporate and investment banking. U.S. consumer credit costs declined due to
lower bankruptcy filings. In international consumer, credit costs primarily reflected portfolio growth, including a
significant increase in Mexico due to target market expansion. The international and U.S. consumer credit
environment was generally stable. The global corporate credit environment also remained stable.
• Excluding charges in Japan consumer finance, the net interest margin was even with the 2006 third quarter.
• Share repurchases totaled $1 billion, or approximately 19 million shares. For the full year 2006, share
repurchases totaled $7 billion and dividends paid to common shareholders totaled $9.8 billion.
Expanding Distribution
During the fourth quarter and for the full year 2006, continued investment spending led to record branch expansion.
New Branches Opened
United States International Total
4Q FY 4Q FY 4Q FY
Retail Bank Branches 42 101 119 342 161 443
Consumer Finance Branches 50 202 169 520 219 722
Total 92 303 288 862 380 1,165
International retail branch openings in the fourth quarter included 60 in Mexico, 16 in Brazil, 13 in Russia and 8 in
Turkey. International consumer finance branch openings included 45 in Mexico, 41 in India, 38 in Brazil and 11 in
Korea.
2
3. APPENDIX
GLOBAL CONSUMER GROUP
Fourth Quarter Revenues % Fourth Quarter Net Income %
2006 2006
(In Millions of Dollars) 2005 Change 2005 Change
$3,571 $1,001
U.S. Cards $2,725 31% $444 NM
2,407 463
U.S. Retail Distribution 2,359 2 391 18%
1,471 484
U.S. Consumer Lending 1,388 6 458 6
508 146
U.S. Commercial Business 481 6 121 21
Total U.S. Consumer $7,957 $2,094
$6,953 14% $1,414 48%
$1,650 $231
International Cards $1,360 21% $357 (35)%
349 (351)
International Consumer Finance 958 (64) 174 NM
2,946 748
International Retail Banking 2,552 15 565 32
Total International Consumer $4,945 $628
$4,870 2% $1,096 (43)%
(20) (111)
Other (24) 17 (76) (46)
Global Consumer $12,882 $2,611
$11,799 9% $2,434 7%
NM Not meaningful.
• U.S. Cards
Revenues increased 31% and net income was up 125%, primarily reflecting the absence of a $545 million
–
pre-tax charge to conform accounting practices for customer rewards in the prior-year period. Excluding
the rewards charge, revenues increased 9% and net income grew 27%.
Revenue growth was primarily driven by higher results from previously securitized receivables and
–
increased fee revenue. Net interest revenues declined due to net interest margin compression.
Credit costs declined 15% due to lower bankruptcy filings and a stable credit environment. The managed
–
net credit loss ratio was 4.35%, a decline of 233 basis points versus the prior year.
Average managed loans grew 2%, driven by higher reward and private label card balances, including the
–
addition of Federated card receivables.
• U.S. Retail Distribution
Revenue growth was primarily driven by increased customer business volumes, which were largely offset
–
by net interest margin compression. Average deposits and loans grew 19% and 11%, respectively, and
investment product sales grew 27%. Deposits in Citibank e-savings reached $9.9 billion. Lower net
interest margins reflected increased e-savings and time deposits, which were driven by new marketing
campaigns and a shift in customer preferences.
Expenses increased 13% on higher customer activity, increased marketing, and investment in new
–
branches. During the quarter, 42 new Citibank branches and 50 consumer finance branches were opened.
Net income increased 18%, as credit costs declined significantly due to lower bankruptcy filings. The net
–
credit loss ratio declined 110 basis points to 2.88%.
• U.S. Consumer Lending
– Revenues increased 6%, driven by increased loan balances and higher gains on sales of securities. Net
interest revenues increased slightly, as 17% growth in average loans was largely offset by net interest
margin compression across the loan portfolios.
– Expenses increased 3%, primarily due to investment spending and higher collection costs. Higher credit
costs reflected portfolio growth and seasoning, as well as increased net credit losses in second mortgages
and auto loans.
3
4. • U.S. Commercial Business
Revenue growth of 6% was driven by increased loan and deposit balances, up 9% and 4% respectively,
–
and stable net interest margins.
Net income increased 21%, as higher credit costs were partially offset by a decline in expenses. Credit
–
costs increased due to the absence of loan loss reserve releases recorded in the prior-year period. Credit
conditions remained stable.
• International Cards
Revenues were a record, increasing 21% on higher purchase sales and average loans, both up 26%; this
–
was partially offset by the continued revenue impact of industry-wide credit conditions in the Taiwan cards
market. Revenue and volume growth includes the integration of Credicard in Brazil. Loan balances grew
at a double-digit pace in Mexico, EMEA, Asia and Latin America.
Expenses grew 26%, reflecting the integration of Credicard, continued investment in organic growth and
–
higher customer activity.
Credit costs increased $272 million, primarily driven by target market expansion in Mexico, which led to
–
higher net credit losses and a $111 million pre-tax addition to increase loan loss reserves.
Net income declined due to higher credit costs, increased investment spending and the absence of a $57
–
million after-tax gain on sale of a merchant acquiring business in EMEA in the prior-year period.
• International Consumer Finance
– In Japan, revenues and net income declined due to a $375 million after-tax charge to increase reserves for
estimated losses due to customer settlements. Results also include a $40 million after-tax charge to
reposition the business, and $74 million after-tax in increased customer settlements and net credit losses
versus the prior-year period. These charges reflect recent changes in the operating environment and the
December 13, 2006, passage of changes to consumer lending laws.
– Outside of Japan, revenues increased 27%, driven by 23% growth in average loans. Net income declined
as revenue growth was offset by increased investment spending, including the opening of 169 new
branches, and an increase in credit costs due to portfolio growth.
• International Retail Banking
Revenues were a record, increasing 15%, driven by increased deposits and loans, up 8% and 12%
–
respectively, and 33% growth in investment product sales. Results also include a $234 million net pre-tax
gain on the sale of Avantel, a telecommunications company in Mexico. Loan balances grew at a double-
digit pace in Asia, EMEA and Latin America.
Expense growth reflected increased business volumes and continued investment spending. During the
–
quarter, 119 new branches were opened.
Credit costs declined due to the absence of charges to increase loan loss reserves in the prior-year period.
–
The NCL rate remained stable at 1.29%.
4
5. CORPORATE AND INVESTMENT BANKING
Fourth Quarter Revenues % Fourth Quarter Net Income %
2006 2006
(In Millions of Dollars) 2005 Change 2005 Change
$5,486 $1,389
Capital Markets and Banking $4,919 12% $1,421 (2)%
1,594 378
Transaction Services 1,317 21 275 37
- (13)
Other - - 351 NM
Corporate and Investment Banking $7,080 $1,754
$6,236 14% $2,047 (14)%
$4,658 $1,347
$3,872 20% $1,089 24%
International Results
• Capital Markets and Banking
Fixed income markets revenues increased 32% to $2.75 billion, primarily driven by improved results in
–
interest rate and credit products and foreign exchange.
Equity markets revenues grew 17% to $900 million on higher results in cash trading, convertibles and
–
equity finance and prime brokerage.
Investment banking revenues increased 16% to a record $1.34 billion, reflecting higher debt and equity
–
underwriting revenues, up 17% and 47% respectively.
Operating expenses increased 21% due to increased staffing, higher business volumes and SFAS 123(R)
–
accruals.
Net income declined due to the absence of a $386 million pre-tax gain on the sale of Nikko Cordial shares
–
in the prior-year period.
• Transaction Services
Revenues and net income, up 21% and 37% respectively, were driven by higher customer volumes,
–
reflecting increased liability balances, up 24%; assets under custody, up 21%; and the positive impact of
higher short-term interest rates.
Operating expenses increased 15%, primarily driven by increased business volumes.
–
• Other
Net income declined due to the absence of a $375 million after-tax release of WorldCom/research litigation
–
reserves in the prior-year period.
GLOBAL WEALTH MANAGEMENT
Fourth Quarter Revenues % Fourth Quarter Net Income %
2006 2006
(In Millions of Dollars) 2005 Change 2005 Change
$2,189 $305
Smith Barney $1,781 23% $208 47%
527 106
Private Bank 456 16 89 19
Global Wealth Management $2,716 $411
$2,237 21% $297 38%
$379 $61
$256 48% $32 91%
International Results
• Smith Barney
Revenue growth was driven by a continued shift toward offering fee-based advisory products and services,
–
resulting in a 33% increase in fee-based and net interest revenues. Transactional revenues increased 8%,
as a higher volume of new securities offerings drove increased customer trading. Results also reflected the
acquisition of the Legg Mason business in December 2005.
Assets under fee-based management increased 15% to $343 billion, driven by net client asset flows and
–
positive market action. Net client asset flows were $9 billion during the quarter.
Results included $58 million in SFAS 123(R) expenses.
–
5
6. • Private Bank
Revenue and net income growth was driven by a 29% increase in international revenues, reflecting strong
–
growth in Asia capital markets products. Expense growth primarily reflected increased client activity, which
led to higher compensation costs, including the net addition of 49 bankers since the fourth quarter of 2005.
Client business volumes increased 14%, including 17% growth in client assets under fee-based
–
management.
ALTERNATIVE INVESTMENTS
Fourth Quarter Revenues % Fourth Quarter Net Income %
2006 2006
(In Millions of Dollars) 2005 Change 2005 Change
Alternative Investments $1,308 $549
$732 79% $351 56%
• Alternative Investments
Revenues and net income were a record, driven by strong performance across all proprietary investment
–
products, including increased results in private equity and hedge funds, and higher client revenues. During
the quarter, capital raising for a new $3.3 billion private equity fund was successfully completed.
CORPORATE/OTHER
Corporate/Other income declined, as improved treasury results were more than offset by increased taxes.
INTERNATIONAL OPERATIONS (1)
Fourth Quarter Revenues % Fourth Quarter Net Income %
2006 2005 Change 2006 2005 Change
(In Millions of Dollars)
$1,612 $1,219 $477
Global Consumer………………………………. 32% $276 73%
199 85
Corporate and Investment Banking………….. 212 (6) 114 (25)
33 9
Global Wealth Management………………….. 32 3 9 -
Mexico $1,844 $1,463 $571
26% $399 43%
$1,404 $112
Global Consumer………………………………. $1,426 (2)% $282 (60)%
2,252 545
Corporate and Investment Banking………….. 1,646 37 248 NM
90 8
Global Wealth Management………………….. 74 22 (2) NM
Europe, Middle East and Africa (EMEA) $3,746 $665
$3,146 19% $528 26%
$91 $(326)
Global Consumer………………………………. $800 (89)% $174 NM
310 77
Corporate and Investment Banking………….. 646 (52) 338 (77)%
- -
Global Wealth Management………………….. - - - -
Japan $401 $(249)
$1,446 (72)% $512 NM
$1,291 $332
Global Consumer………………………………. $1,132 14% $323 3%
1,440 510
Corporate and Investment Banking………….. 1,017 42 295 73
206 40
Global Wealth Management……….…………. 103 100 24 67
Asia (excluding Japan) $2,937 $882
$2,252 30% $642 37%
$547 $33
Global Consumer………………………………. $293 87% $41 (20)%
457 130
Corporate and Investment Banking………….. 351 30 94 38
50 4
Global Wealth Management………………….. 47 6 1 NM
Latin America $1,054 $167
$691 53% $136 23%
Total International $9,982 $2,036
$8,998 11% $2,217 (8)%
(1) International results for the quarter are fully reflected in the product disclosures.
6
7. • Mexico
Consumer revenue and income growth was driven by a $234 million net pre-tax gain on the sale of Avantel,
–
a telecommunications company, and 13% growth in average loans, which was partially offset by net
interest margin compression. Credit costs increased due to target market expansion and portfolio growth in
cards, which led to a $111 million pre-tax addition to loan loss reserves and higher net credit losses.
During the quarter, 60 new retail bank branches and 45 new consumer finance branches were opened.
Corporate and investment banking revenues and net income declined as double-digit revenue growth in
–
equity markets and transaction services was offset by lower results in fixed income markets.
• Europe, Middle East and Africa
Consumer revenues declined due to the absence of a $95 million pre-tax gain on sale of a card merchant
–
acquiring business recorded in the prior-year period. Excluding the gain, revenues increased 5% on
growth in customer deposits and loans of 17% and 16% respectively, and higher investment product sales.
The net income decline also reflected higher expenses due to increased business volumes and investment
spending, which included the opening of 28 retail bank branches and 21 consumer finance branches.
Corporate and investment banking results were driven by strong double-digit growth across all products,
–
including equity and fixed income markets, investment banking and transaction services.
• Japan
Consumer revenues and net income declined due to a $375 million after-tax charge to increase reserves
–
for estimated losses due to customer settlements. Results also include a $40 million after-tax charge to
reposition the business, and $74 million after-tax in increased customer settlements and net credit losses
versus the prior-year period. These charges reflect recent changes in the operating environment and the
December 13, 2006, passage of changes to consumer lending laws.
Corporate and investment banking revenues and net income were down as strong growth in fixed income
–
markets and underwriting was offset by lower results in equity markets, and the absence of a $386 million
pre-tax gain on the sale of Nikko Cordial shares in the prior-year period.
• Asia
Consumer revenues increased 14% as growth in deposits and loans, up 9% and 15% respectively, were
–
partially offset by net interest margin compression. Net income increased 3%, reflecting higher investment
spending, increased business volumes and higher credit costs. During the quarter, 61 new consumer
finance branches and 8 retail bank branches were opened.
Record revenues and net income in corporate and investment banking were driven by double-digit growth
–
in fixed income and equity markets, investment banking and transaction services.
Wealth management results were driven by strong growth in capital markets products.
–
• Latin America
Consumer revenues increased 87%, driven by double-digit organic loan growth in retail banking, consumer
–
finance and cards, and the integration of Credicard in Brazil. Net income declined due to higher investment
spending and increased credit costs. During the quarter, 42 consumer finance and 23 retail bank branches
were opened.
Corporate and investment banking revenue and net income growth was driven by double-digit revenue
–
growth in fixed income and equity markets, lending and transaction services.
A reconciliation of non-GAAP financial information contained in this press release is set forth in page 11.
7
8. Citigroup (NYSE: C), the leading global financial services company, has some 200 million customer accounts and does business in more than
100 countries, providing consumers, corporations, governments, and institutions with a broad range of financial products and services, including
consumer banking and credit, corporate and investment banking, securities brokerage, and wealth management. Major brand names under
Citigroup's trademark red umbrella include Citibank, CitiFinancial, Primerica, Smith Barney, and Banamex. Additional information may be found
at www.citigroup.com.
Additional financial, statistical, and business-related information, as well as business and segment trends, is included in a Financial Supplement.
Both the earnings release and the Financial Supplement are available on Citigroup’s website at www.citigroup.com.
Certain statements in this document are “forward-looking statements” within the meaning of the Private Securities Litigation Reform Act. These
statements are based on management’s current expectations and are subject to uncertainty and changes in circumstances. Actual results may
differ materially from those included in these statements due to a variety of factors. More information about these factors is contained in
Citigroup’s filings with the Securities and Exchange Commission.
Contacts:
Press: Shannon Bell (212) 793-6206 Equity Investors: Arthur Tildesley (212) 559-2718
Michael Hanretta (212) 559-9466 Fixed Income Investors: Maurice Raichelson (212) 559-5091
8
9. APPENDIX A
CITIGROUP FULL YEAR 2006 SEGMENT RESULTS
% %
Revenues Net Income
(In Millions of Dollars, except EPS) 2006 2006
2005 Change 2005 Change
Global Consumer:
$13,508 $3,890
U.S. Cards $12,824 5% $2,754 41%
9,584 2,027
U.S. Retail Distribution 9,515 1 1,752 16
5,519 1,912
U.S. Consumer Lending 5,469 1 1,938 (1)
1,983 561
U.S. Commercial Business 2,299 (14) 729 (23)
Total U.S. Consumer $30,594 $8,390
$30,107 2% $7,173 17%
$5,959 $1,137
International Cards $4,850 23% $1,373 (17)%
3,318 40
International Consumer Finance 3,819 (13) 642 (94)
10,518 2,840
International Retail Banking 9,727 8 2,083 36
Total International Consumer $19,795 $4,017
$18,396 8% $4,098 (2)%
(90) (351)
Other (258) 65 (374) 6
Total Global Consumer $50,299 $12,056
$48,245 4% $10,897 11%
Corporate and Investment Banking:
$21,218 $5,763
Capital Markets and Banking $18,970 12% $5,327 8%
5,971 1,426
Transaction Services 4,891 22 1,135 26
(2) (62)
Other 2 NM 433 NM
Total Corporate and Investment Banking $27,187 $7,127
$23,863 14% $6,895 3%
Global Wealth Management:
$8,160 $1,005
Smith Barney $6,825 20% $871 15%
2,017 439
Private Bank 1,859 8 373 18
Total Global Wealth Management $10,177 $1,444
$8,684 17% $1,244 16%
Alternative Investments $2,901 $1,276
$3,430 (15)% $1,437 (11)%
Corporate/Other $(949) $(654)
$(580) (64)% $(667) 2%
Income From Continuing Operations $21,249 $19,806 7%
Discontinued Operations (1) 289 4,832 --
(2)
Cumulative Effect of Accounting Change -- (49) --
Total Citigroup $89,615 $21,538
$83,642 7% $24,589 (12)%
(1) Primarily includes gains and tax benefits relating to the final settlement of the life insurance and annuities and asset management sale
transactions. The life insurance and annuities sale transaction closed on July 1, 2005, resulting in a total gain of $2.2 billion after-tax.
The asset management sale transaction closed on December 1, 2005, resulting in a gain of $2.1 billion after-tax.
(2) Due to adoption of FIN 47, which requires current recognition of certain future estimated lease termination costs.
9
10. SUMMARY OF PRESS RELEASE DISCLOSED ITEMS - NET INCOME IMPACT ($MM)
4Q’05 4Q’06
(1, 2,3)
Cards $(408) $-
(1, 2, 3)
Retail Distribution (100) -
Consumer Lending - -
(2)
Commercial Business Group 19 -
U.S. Consumer (489) -
(2, 6)
Cards 35 -
(9)
Consumer Finance - (489)
(2) (10)
Retail Banking (32) 145
International Consumer 3 (344)
Other Consumer - -
Global Consumer (486) (344)
(2, 5, 7)
Capital Markets and Banking 101 -
(2)
Transaction Services (4) -
(4)
Other 375 -
Corporate & Investment Banking 472 -
Smith Barney - -
(2)
Private Bank (8) -
Global Wealth Management (8) -
Alternative Investments - -
Corporate / Other - -
(8)
Discontinued Operations 2,082 -
(1) Impact on revenues and net credit losses from increased consumer bankruptcy filings due to new legislation of ($393) pretax (($252) after-tax)
comprised of ($300) pre-tax (($192) after-tax) in U.S. Cards and ($93) pre-tax (($60) after-tax) in U.S. Retail Distribution.
(2) LLR release of $3 pre-tax ($1 after-tax) comprised of after-tax $126 in U.S. Cards, ($28) in U.S. Retail Distribution, $19 in U.S. Commercial Business
Group, ($22) in International Cards, ($32) in International Retail Banking, ($50) in CM&B, ($4) in GTS and ($8) in Private Bank.
(3) Charge to conform accounting practice for customer rewards of ($565) pre-tax (($354) after-tax) comprised of ($545) pre-tax (($342) after-tax) in U.S.
Cards and ($20) pre-tax (($12) after-tax) in U.S. Retail Distribution.
(4) Release of WorldCom/Research litigation reserves of $600 pre-tax ($375 after-tax) in CIB Other.
(5) Gain on sale of Nikko Cordial stock of $386 pre-tax ($248 after-tax) in CM&B.
(6) Gain on sale of card merchant acquiring business of $89 pre-tax ($57 after-tax) in International Cards.
(7) Increased reserve for previously disclosed legal matters of ($160) pre-tax (($97) after-tax) in CM&B.
(8) Gain on sale of Asset Management of $2.08B after-tax in Discontinued Operations.
(9) Establishment of a reserve for customer settlements, higher year-over-year credit costs and refunds, and a repositioning charge of ($755) pre-tax
(($489) after-tax) in Japan Consumer Finance.
(10) Gain on sale of Avantel of $234 pre-tax ($145 after-tax) in International Retail Banking.
10
11. Non-GAAP Financial Measures
The following measures are considered quot;non-GAAP financial measuresquot; under SEC guidelines:
(i) U.S. Cards revenues and net income excluding the impact of the charge to conform accounting practices for
customer rewards.
(ii) EMEA Consumer revenues excluding gain on sale of a card merchant acquiring business.
The Company believes that these non-GAAP financial measures provide a fuller understanding of ongoing operations and
enhance comparability of those results in prior periods as well as demonstrating the effects of unusual charges in the quarter.
The Company believes that a meaningful analysis of its financial performance requires an understanding of the factors
underlying that performance. The Company believes that investors may find it useful to see these non-GAAP financial
measures to analyze financial performance without the impact of unusual items that may obscure trends in the Company's
underlying performance.
Reconciliation of the GAAP financial measures to the aforementioned non-GAAP measures follows:
4Q 4Q 4Q'06 vs. 4Q’05
2006 2005 % Change
($ in millions)
GAAP U.S. Cards Revenues $ 3,571 $ 2,725 31%
Excluding the impact of the charge to conform accounting
practices for customer rewards - 545
Non-GAAP U.S. Cards Revenues as Adjusted $ 3,571 $ 3,270 9%
GAAP U.S. Cards Net Income $ 1,001 $ 444 125%
Excluding the impact of the charge to conform accounting
practices for customer rewards - 342
Non-GAAP U.S. Cards Net Income as Adjusted $ 1,001 $ 786 27%
GAAP EMEA Consumer Revenues $ 1,404 $ 1,426 (2)%
Excluding the impact of the gain on sale of a card merchant
acquiring business - (95)
Non-GAAP EMEA Consumer Revenues as Adjusted $ 1,404 $ 1,331 5%
11