1. CITIGROUP - QUARTERLY FINANCIAL DATA SUPPLEMENT
Page Number
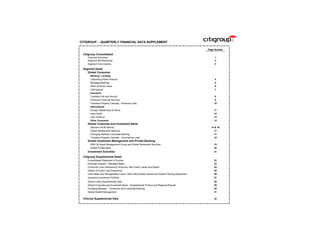
Citigroup Consolidated
Financial Summary 1
Segment Net Revenues 2
Segment Core Income 3
Segment Detail
Global Consumer:
Banking / Lending
Citibanking North America 4
Mortgage Banking 5
North America Cards 6
CitiFinancial 7
Insurance
Travelers Life and Annuity 8
Primerica Financial Services 9
Travelers Property Casualty - Personal Lines 10
International
Europe, Middle East & Africa 11
Asia Pacific 12
Latin America 13
Other Consumer 14
Global Corporate and Investment Bank:
Salomon Smith Barney 15 & 16
Global Relationship Banking 17
Emerging Markets Corporate Banking 17
Travelers Property Casualty - Commercial Lines 18
Global Investment Management and Private Banking:
SSB Citi Asset Management Group and Global Retirement Services 19
Global Private Bank 20
Investment Activities 21
Citigroup Supplemental Detail
Consolidated Statement of Income 22
Earnings Analysis - Managed Basis 23
Consumer Loan Delinquency Amounts, Net Credit Losses and Ratios 24
Details of Credit Loss Experience 25
Cash Basis and Renegotiated Loans, Other Real Estate Owned and Assets Pending Disposition 26
Insurance Investment Portfolio 27
Global Cards Supplemental Data 28
Global Corporate and Investment Bank - Supplemental Product and Regional Results 29
Emerging Markets - Consumer and Corporate Banking 30
Global Wealth Management 31
Citicorp Supplemental Data 32
2. CITIGROUP -- FINANCIAL SUMMARY
(In millions of dollars, except per share amounts)
Citigroup, the most global financial services company, provides some 100 million consumers, corporations, governments and institutions in over 100 countries with a broad range of financial products and services.
3Q 2000 vs. YTD YTD YTD 3Q 2000 vs.
1Q 2Q 3Q 4Q 1Q 2Q 3Q 3Q 1999 Increase/ 3Q 3Q YTD 3Q 1999 Increase/
1999 1999 1999 1999 2000 2000 2000 (Decrease) 1999 2000 (Decrease)
Core Income $ 2,415 $ 2,477 $ 2,450 $ 2,605 $ 3,602 $ 3,007 $ 3,111 27% $ 7,342 $ 9,720 32%
Restructuring - Related Items 74 (29) (15) 17 (12) (2) (23) 30 (37)
Cumulative Effect of Accounting Changes (127) - - - - - - (127) -
Net Income $ 2,362 $ 2,448 $ 2,435 $ 2,622 $ 3,590 $ 3,005 $ 3,088 27% $ 7,245 $ 9,683 34%
Basic Earnings Per Share:
Core Income $ 0.53 $ 0.55 $ 0.54 $ 0.58 $ 0.80 $ 0.67 $ 0.69 28% $ 1.63 $ 2.17 33%
Net Income $ 0.52 $ 0.54 $ 0.54 $ 0.58 $ 0.80 $ 0.67 $ 0.69 28% $ 1.60 $ 2.16 35%
Weighted average common shares
applicable to Basic EPS 4,453.6 4,443.6 4,442.7 4,441.2 4,442.1 4,443.6 4,444.8 4,446.6 4,443.5
Preferred Dividends - Basic $ 40 $ 38 $ 38 $ 33 $ 30 $ 29 $ 29 $ 116 $ 88
Diluted Earnings Per Share:
Core Income $ 0.52 $ 0.53 $ 0.53 $ 0.56 $ 0.78 $ 0.65 $ 0.67 26% $ 1.58 $ 2.10 33%
Net Income $ 0.51 $ 0.52 $ 0.52 $ 0.56 $ 0.78 $ 0.65 $ 0.67 29% $ 1.55 $ 2.09 35%
Core diluted earnings per share excluding
goodwill amortization $ 0.53 $ 0.54 $ 0.54 $ 0.57 $ 0.79 $ 0.66 $ 0.68 26% $ 1.61 $ 2.13 32%
Adjusted weighted average common shares
applicable to Diluted EPS 4,586.6 4,600.4 4,586.9 4,591.5 4,580.9 4,586.9 4,599.4 4,591.3 4,589.1
Preferred Dividends - Diluted $ 37 $ 35 $ 34 $ 33 $ 30 $ 29 $ 29 $ 106 $ 88
Common Shares Outstanding, at period end 4,507.1 4,502.3 4,489.0 4,490.0 4,494.2 4,493.0 4,491.9 4,489.0 4,491.9
Tier 1 Capital Ratio 8.86% 9.37% 9.59% 9.65% 9.78% 8.62% 8.3% * 9.59% 8.3% *
Total Capital Ratio 11.54% 12.07% 12.28% 12.33% 12.47% 11.12% 10.6% * 12.28% 10.6% *
Leverage Ratio 6.24% 6.38% 6.62% 6.80% 6.73% 6.07% 6.0% * 6.62% 6.0% *
Total Assets, at period end (in billions) $ 690.5 $ 689.1 $ 686.8 $ 715.7 $ 738.2 $ 791.3 $ 805 * $ 686.8 $ 805 *
Stockholders' Equity, at period end (in billions) $ 43.8 $ 44.9 $ 46.3 $ 48.9 $ 50.3 $ 51.6 $ 53.6 * $ 46.3 $ 53.6 *
Stockholders' Equity and Trust Securities, at period end (in billions) $ 48.8 $ 49.8 $ 51.2 $ 53.8 $ 55.2 $ 56.5 $ 58.6 * $ 51.2 $ 58.6 *
Book Value Per Share, at period end $ 9.26 $ 9.51 $ 9.85 $ 10.46 $ 10.80 $ 11.08 $ 11.55 $ 9.85 $ 11.55
Return on Common Equity (Net Income) 23.1% 22.9% 22.0% 22.8% 29.8% 24.7% 24.0% * 22.7% 26.1% *
Return on Common Equity (Core Income) 23.6% 23.2% 22.1% 22.6% 29.9% 24.8% 24.2% * 23.0% 26.2% *
* Preliminary
Page 1
3. CITIGROUP -- SEGMENT NET REVENUES
(In millions of dollars)
3Q 2000 vs. YTD YTD YTD 3Q 2000 vs.
1Q 2Q 3Q 4Q 1Q 2Q 3Q 3Q 1999 Increase/ 3Q 3Q YTD 3Q 1999 Increase/
1999 1999 1999 1999 2000 2000 2000 (Decrease) 1999 2000 (Decrease)
Global Consumer:
Banking / Lending
Citibanking North America $ 506 $ 516 $ 526 $ 556 $ 575 $ 569 $ 572 9% $ 1,548 $ 1,716 11%
Mortgage Banking 169 183 199 196 204 206 203 2% 551 613 11%
North America Cards 1,961 1,981 1,971 2,042 1,996 1,969 2,059 4% 5,913 6,024 2%
CitiFinancial 361 396 421 441 462 474 491 17% 1,178 1,427 21%
Total Banking / Lending 2,997 3,076 3,117 3,235 3,237 3,218 3,325 7% 9,190 9,780 6%
Insurance
Travelers Life and Annuity 771 867 869 887 1,010 983 899 3% 2,507 2,892 15%
Primerica Financial Services 432 443 444 456 472 479 474 7% 1,319 1,425 8%
Personal Lines 983 1,005 1,018 1,037 1,027 1,041 1,048 3% 3,006 3,116 4%
Total Insurance 2,186 2,315 2,331 2,380 2,509 2,503 2,421 4% 6,832 7,433 9%
International
Western Europe 493 489 499 510 497 474 466 (7%) 1,481 1,437 (3%)
Japan 84 92 108 108 142 169 170 57% 284 481 69%
Asia 433 450 471 498 541 522 525 11% 1,354 1,588 17%
Latin America 464 496 499 511 513 466 436 (13%) 1,459 1,415 (3%)
Central & Eastern Europe, Middle East and Africa 68 74 108 87 96 102 106 (2%) 250 304 22%
Total Emerging Markets Consumer Banking 965 1,020 1,078 1,096 1,150 1,090 1,067 (1%) 3,063 3,307 8%
Total International 1,542 1,601 1,685 1,714 1,789 1,733 1,703 1% 4,828 5,225 8%
e-Consumer 24 23 27 34 31 28 77 185% 74 136 84%
Other 49 39 30 8 11 (11) (11) NM 118 (11) NM
Total Global Consumer 6,798 7,054 7,190 7,371 7,577 7,471 7,515 5% 21,042 22,563 7%
Global Corporate and Investment Bank:
Salomon Smith Barney 3,341 3,269 2,791 3,279 4,186 3,693 3,870 39% 9,401 11,749 25%
Global Relationship Banking 1,117 1,038 1,020 1,033 1,207 1,265 1,215 19% 3,175 3,687 16%
Emerging Markets Corporate Banking 1,145 1,098 1,057 1,052 1,240 1,272 1,265 20% 3,300 3,777 14%
Commercial Lines 1,534 1,558 1,578 1,595 1,568 1,626 1,747 11% 4,670 4,941 6%
Total Global Corporate and Investment Bank 7,137 6,963 6,446 6,959 8,201 7,856 8,097 26% 20,546 24,154 18%
Global Investment Management & Private Banking:
SSB Citi Asset Management Group and Global Retirement Services 356 358 371 409 436 479 491 32% 1,085 1,406 30%
Global Private Bank 274 301 305 332 362 338 337 10% 880 1,037 18%
Total Global Investment Management & Private Banking 630 659 676 741 798 817 828 22% 1,965 2,443 24%
Investment Activities 153 270 311 356 1,016 387 495 59% 734 1,898 159%
Corporate / Other (60) 7 (43) (100) (99) (155) (163) (279%) (96) (417) (334%)
e-Citi - (3) (7) (2) 10 (3) (8) (14%) (10) (1) 90%
Total Corporate / Other (60) 4 (50) (102) (89) (158) (171) (242%) (106) (418) (294%)
Total Adjusted Net Revenues $ 14,658 $ 14,950 $ 14,573 $ 15,325 $ 17,503 $ 16,373 $ 16,764 15% $ 44,181 $ 50,640 15%
SUPPLEMENTAL INFORMATION:
Emerging Markets - Consumer and Corporate Banking $ 2,343 $ 2,440 $ 2,454 $ 2,453 $ 2,802 $ 2,775 $ 2,725 11% $ 7,237 $ 8,302 15%
Global Wealth Management $ 3,335 $ 3,641 $ 3,564 $ 3,829 $ 4,384 $ 4,120 $ 4,035 13% $ 10,540 $ 12,539 19%
Global Cards $ 2,418 $ 2,422 $ 2,460 $ 2,559 $ 2,539 $ 2,550 $ 2,623 7% $ 7,300 $ 7,712 6%
Reclassified to conform to the current period's presentation.
Page 2
4. CITIGROUP -- SEGMENT CORE INCOME
(In millions of dollars)
3Q 2000 vs. YTD YTD YTD 3Q 2000 vs.
1Q 2Q 3Q 4Q 1Q 2Q 3Q 3Q 1999 Increase/ 3Q 3Q YTD 3Q 1999 Increase/
1999 1999 1999 1999 2000 2000 2000 (Decrease) 1999 2000 (Decrease)
Global Consumer:
Banking / Lending
Citibanking North America $ 72 $ 104 $ 107 $ 115 $ 138 $ 139 $ 143 34% $ 283 $ 420 48%
Mortgage Banking 59 52 59 55 61 65 70 19% 170 196 15%
North America Cards 277 280 301 324 296 308 369 23% 858 973 13%
CitiFinancial 71 78 135 108 112 117 124 (8%) 284 353 24%
Total Banking / Lending 479 514 602 602 607 629 706 17% 1,595 1,942 22%
Insurance
Travelers Life and Annuity 147 173 168 135 187 202 179 7% 488 568 16%
Primerica Financial Services 110 113 114 115 119 125 124 9% 337 368 9%
Personal Lines 83 79 23 94 75 82 68 196% 185 225 22%
Total Insurance 340 365 305 344 381 409 371 22% 1,010 1,161 15%
International
Western Europe 65 67 71 72 88 75 88 24% 203 251 24%
Japan 21 23 25 18 29 39 36 44% 69 104 51%
Asia 81 84 92 99 144 142 142 54% 257 428 67%
Latin America 47 41 52 82 66 41 32 (38%) 140 139 (1%)
Central & Eastern Europe, Middle East and Africa 3 6 27 10 14 16 15 (44%) 36 45 25%
Total Emerging Markets Consumer Banking 131 131 171 191 224 199 189 11% 433 612 41%
Total International 217 221 267 281 341 313 313 17% 705 967 37%
e-Consumer (22) (27) (29) (33) (68) (46) (43) (48%) (78) (157) (101%)
Other (16) (25) (12) (22) (29) (28) (25) (108%) (53) (82) (55%)
Total Global Consumer 998 1,048 1,133 1,172 1,232 1,277 1,322 17% 3,179 3,831 21%
Global Corporate and Investment Bank:
Salomon Smith Barney 648 610 432 664 957 641 622 44% 1,690 2,220 31%
Global Relationship Banking 184 146 143 163 240 261 250 75% 473 751 59%
Emerging Markets Corporate Banking 315 286 303 257 392 370 401 32% 904 1,163 29%
Commercial Lines 189 201 255 200 240 267 315 24% 645 822 27%
Total Global Corporate and Investment Bank 1,336 1,243 1,133 1,284 1,829 1,539 1,588 40% 3,712 4,956 34%
Global Investment Management & Private Banking:
SSB Citi Asset Management Group and Global Retirement Services 81 85 84 79 95 92 96 14% 250 283 13%
Global Private Bank 55 71 70 73 80 79 80 14% 196 239 22%
Total Global Investment Management & Private Banking 136 156 154 152 175 171 176 14% 446 522 17%
Investment Activities 89 162 194 213 634 234 292 51% 445 1,160 161%
Corporate / Other (138) (121) (145) (202) (253) (196) (244) (68%) (404) (693) (72%)
e-Citi (6) (11) (19) (14) (15) (18) (23) (21%) (36) (56) (56%)
Total Corporate / Other (144) (132) (164) (216) (268) (214) (267) (63%) (440) (749) (70%)
Total Core Income $ 2,415 $ 2,477 $ 2,450 $ 2,605 $ 3,602 $ 3,007 $ 3,111 27% $ 7,342 $ 9,720 32%
SUPPLEMENTAL INFORMATION:
Emerging Markets - Consumer and Corporate Banking $ 465 $ 485 $ 545 $ 490 $ 703 $ 632 $ 641 18% $ 1,495 $ 1,976 32%
Global Wealth Management $ 607 $ 683 $ 663 $ 685 $ 892 $ 782 $ 758 14% $ 1,953 $ 2,432 25%
Global Cards $ 334 $ 330 $ 360 $ 422 $ 385 $ 430 $ 476 32% $ 1,024 $ 1,291 26%
Reclassified to conform to the current period's presentation.
Page 3
5. GLOBAL CONSUMER - Banking/Lending
CITIBANKING NORTH AMERICA
(In millions of dollars)
3Q 2000 vs. YTD YTD YTD 3Q 2000 vs.
1Q 2Q 3Q 4Q 1Q 2Q 3Q 3Q 1999 Increase/ 3Q 3Q YTD 3Q 1999 Increase/
1999 1999 1999 1999 2000 2000 2000 (Decrease) 1999 2000 (Decrease)
Total Revenues, Net of Interest Expense $ 506 $ 516 $ 526 $ 556 $ 575 $ 569 $ 572 9% $ 1,548 $ 1,716 11%
Adjusted Operating Expenses 358 323 330 343 334 329 325 (2%) 1,011 988 (2%)
Provision for Loan Losses 23 15 11 15 9 7 7 (36%) 49 23 (53%)
Core Income Before Taxes 125 178 185 198 232 233 240 30% 488 705 44%
Income Taxes 53 74 78 83 94 94 97 24% 205 285 39%
Core Income $ 72 $ 104 $ 107 $ 115 $ 138 $ 139 $ 143 34% $ 283 $ 420 48%
Average Assets (in billions of dollars) $ 10 $ 9 $ 9 $ 9 $ 9 $ 9 $ 9 - $ 9 $ 9 -
Return on Assets 2.92% 4.63% 4.72% 5.07% 6.17% 6.21% 6.32% 4.20% 6.23%
Average Loans (in billions of dollars) $ 7.5 $ 7.5 $ 7.3 $ 7.1 $ 7.0 $ 7.0 $ 7.0 (4%) $ 7.4 $ 7.0 (5%)
Average Customer Deposits (in billions of dollars) $ 41.6 $ 42.2 $ 42.2 $ 42.4 $ 43.5 $ 44.3 $ 44.8 6% $ 42.0 $ 44.2 5%
EOP Accounts (in millions) 5.9 6.0 6.2 6.3 6.3 6.4 6.5 5%
Non-Interest Revenue as % of Total Revenues 26.5% 26.7% 25.3% 26.0% 27.4% 26.5% 26.5% 26.2% 26.8%
Net Credit Loss Ratio 1.31% 1.23% 1.06% 1.27% 1.00% 0.88% 0.86%
Loans 90+Days Past Due:
In millions of dollars $ 103 $ 92 $ 64 $ 55 $ 48 $ 33 $ 33 (48%)
% 1.38% 1.24% 0.90% 0.78% 0.68% 0.47% 0.46%
Proprietary Mutual Funds / UIT $ 186 $ 180 $ 126 $ 232 $ 373 $ 124 $ 280 122% $ 492 $ 777 58%
Proprietary Money Market Funds 441 394 470 584 1,015 679 748 59% 1,305 2,442 87%
Total Proprietary Funds 627 574 596 816 1,388 803 1,028 72% 1,797 3,219 79%
Third Party Funds 659 715 540 608 947 599 426 (21%) 1,914 1,972 3%
Mutual Fund / UIT Sales at NAV (in millions of dollars) $ 1,286 $ 1,289 $ 1,136 $ 1,424 $ 2,335 $ 1,402 $ 1,454 28% $ 3,711 $ 5,191 40%
Variable Annuity Premiums & Deposits (in millions of dollars) $ 127 $ 210 $ 169 $ 233 $ 302 $ 379 $ 385 128% $ 506 $ 1,066 111%
Branches 380 372 373 371 371 367 367 (2%)
ATM-only locations 69 53 54 52 54 60 60 11%
Proprietary ATMs 2,163 2,063 2,050 2,050 2,050 2,047 2,047 0%
Reclassified to conform to the current period's presentation.
Page 4
6. GLOBAL CONSUMER - Banking/Lending
MORTGAGE BANKING (1)
(In millions of dollars)
3Q 2000 vs. YTD YTD YTD 3Q 2000 vs.
1Q 2Q 3Q 4Q 1Q 2Q 3Q 3Q 1999 Increase/ 3Q 3Q YTD 3Q 1999 Increase/
1999 1999 1999 1999 2000 2000 2000 (Decrease) 1999 2000 (Decrease)
Total Revenues, Net of Interest Expense $ 169 $ 183 $ 199 $ 196 $ 204 $ 206 $ 203 2% $ 551 $ 613 11%
Adjusted Operating Expenses 61 84 93 91 92 95 85 (9%) 238 272 14%
Provision for Loan Losses 3 5 2 7 5 (4) (3) (250%) 10 (2) (120%)
Core Income Before Taxes and Minority Interest 105 94 104 98 107 115 121 16% 303 343 13%
Income Taxes 41 37 41 38 41 44 45 10% 119 130 9%
Minority Interest, Net of Tax 5 5 4 5 5 6 6 50% 14 17 21%
Core Income $ 59 $ 52 $ 59 $ 55 $ 61 $ 65 $ 70 19% $ 170 $ 196 15%
Average Assets (in billions of dollars) $ 28 $ 29 $ 29 $ 31 $ 33 $ 35 $ 40 38% $ 29 $ 36 24%
Return on Assets 0.85% 0.72% 0.81% 0.70% 0.74% 0.75% 0.70% 0.78% 0.73%
EOP Accounts Owned and Serviced:
Student Loans 2.2 2.3 2.5 2.7 2.8 3.0 3.3 32%
Mortgages 0.5 0.6 0.6 0.6 0.6 0.8 0.8 33%
Consumer Finance 0.1 0.1 0.1 0.1 0.1 0.1 0.1 -
Total 2.8 3.0 3.2 3.4 3.5 3.9 4.2 31%
Total Owned and Serviced Average Loans (in billion of dollars):
Mortgages (2) $ 16.4 $ 17.0 $ 17.2 $ 17.6 $ 18.9 $ 20.3 $ 22.3 30% $ 16.9 $ 20.5 21%
Student Loans 9.2 9.2 9.3 10.6 11.6 12.3 14.2 53% 9.2 12.7 38%
Consumer Finance 1.0 1.1 0.6 0.4 0.4 0.5 0.7 17% 0.9 0.5 (44%)
Average Loans - On Balance Sheet 26.6 27.3 27.1 28.6 30.9 33.1 37.2 37% 27.0 33.7 25%
Other Serviced Loans 40.5 46.4 51.0 52.5 54.1 59.9 61.8 21% 46.0 58.6 27%
Total $ 67.1 $ 73.7 $ 78.1 $ 81.1 $ 85.0 $ 93.0 $ 99.0 27% $ 73.0 $ 92.3 26%
Mortgage Originations (in billions of dollars) $ 3.8 $ 4.9 $ 4.7 $ 4.8 $ 3.5 $ 4.9 $ 5.4 15% $ 13.4 $ 13.8 3%
Student Loan Originations $ 0.7 $ 0.3 $ 0.7 $ 0.6 $ 1.0 $ 0.7 $ 1.4 100% $ 1.7 $ 3.1 82%
Consumer Finance Originations $ 0.2 $ 0.3 $ 0.2 $ 0.2 $ 0.2 $ 0.3 $ 0.3 50% $ 0.7 $ 0.8 -
Net Credit Loss Ratio 0.20% 0.17% 0.12% 0.15% 0.14% 0.05% 0.06%
Loans 90+ Days Past Due:
In millions of dollars $ 610 $ 575 $ 629 $ 696 $ 719 $ 709 $ 709 13%
% 2.29% 2.09% 2.28% 2.31% 2.29% 1.98% 1.82%
(1) Includes Student Loans.
(2) Includes loans held for sale.
Reclassified to conform to the current period's presentation.
Page 5
7. GLOBAL CONSUMER - Banking/Lending
NORTH AMERICA CARDS (1)
(In millions of dollars)
3Q 2000 vs. YTD YTD YTD 3Q 2000 vs.
1Q 2Q 3Q 4Q 1Q 2Q 3Q 3Q 1999 Increase/ 3Q 3Q YTD 3Q 1999 Increase/
1999 1999 1999 1999 2000 2000 2000 (Decrease) 1999 2000 (Decrease)
Adjusted Revenues, Net of Interest Expense $ 1,961 $ 1,981 $ 1,971 $ 2,042 $ 1,996 $ 1,969 $ 2,059 4% $ 5,913 $ 6,024 2%
Adjusted Operating Expenses 710 713 697 727 728 720 742 6% 2,120 2,190 3%
Adjusted Provision for Loan Losses (2) 811 825 797 801 799 758 728 (9%) 2,433 2,285 (6%)
Core Income Before Taxes 440 443 477 514 469 491 589 23% 1,360 1,549 14%
Income Taxes 163 163 176 190 173 183 220 25% 502 576 15%
Core Income $ 277 $ 280 $ 301 $ 324 $ 296 $ 308 $ 369 23% $ 858 $ 973 13%
Managed Average Assets (in billions of dollars) $ 73 $ 75 $ 76 $ 76 $ 78 $ 81 $ 87 14% $ 75 $ 82 9%
Return on Managed Assets 1.54% 1.50% 1.57% 1.69% 1.53% 1.53% 1.69% 1.53% 1.59%
N.A. BANKCARDS DATA :
(in billions of dollars)
Net Interest Revenue (in millions of dollars) (3) $ 1,513 $ 1,466 $ 1,482 $ 1,491 $ 1,472 $ 1,405 $ 1,482 - $ 4,461 $ 4,359 (2%)
% of Average Managed Loans 9.06% 8.46% 8.39% 8.39% 8.14% 7.47% 7.26% 8.63% 7.61%
Risk Adjusted Revenue (in millions of dollars) (4) $ 1,083 $ 1,087 $ 1,109 $ 1,172 $ 1,112 $ 1,134 $ 1,254 13% $ 3,279 $ 3,500 7%
% of Average Managed Loans 6.48% 6.27% 6.28% 6.59% 6.15% 6.03% 6.14% 6.34% 6.11%
Adjusted Operating Expenses as % of Average Managed Loans 3.82% 3.71% 3.55% 3.73% 3.62% 3.47% 3.30% 3.69% 3.46%
End of Period Managed Receivables $ 69.8 $ 70.7 $ 71.0 $ 74.7 $ 73.7 $ 79.5 $ 83.7 18%
Total EOP Open Accounts (in millions) 41.8 41.4 41.0 41.1 41.3 42.7 43.9 7%
Total Sales $ 37.0 $ 40.9 $ 41.2 $ 44.2 $ 42.5 $ 48.7 $ 48.0 17% $ 119.1 $ 139.2 17%
End of Period Loans:
On Balance Sheet $ 19.7 $ 20.1 $ 19.5 $ 23.2 $ 23.4 $ 29.0 $ 32.2 65%
Securitized 46.7 47.4 48.5 49.0 48.0 44.8 45.8 (6%)
Held for Sale 2.9 2.8 2.5 2.0 2.0 5.0 5.0 100%
Total $ 69.3 $ 70.3 $ 70.5 $ 74.2 $ 73.4 $ 78.8 $ 83.0 18%
Average Loans:
On Balance Sheet $ 20.5 $ 20.0 $ 19.7 $ 19.9 $ 22.5 $ 26.8 $ 32.1 63% $ 20.1 $ 27.2 35%
Securitized 44.3 46.7 47.9 48.6 48.2 45.8 44.1 (8%) 46.3 46.0 (1%)
Held for Sale 2.9 2.8 2.5 2.0 2.0 3.0 5.0 100% 2.7 3.3 22%
Total $ 67.7 $ 69.5 $ 70.1 $ 70.5 $ 72.7 $ 75.6 $ 81.2 16% $ 69.1 $ 76.5 11%
Net Credit Losses (in millions of dollars):
On Balance Sheet $ 199 $ 236 $ 225 $ 229 $ 268 $ 276 $ 287 28% $ 660 $ 831 26%
Securitized 556 541 525 537 499 441 386 (26%) 1,622 1,326 (18%)
Held for Sale 32 29 27 22 20 28 41 52% 88 89 1%
Total $ 787 $ 806 $ 777 $ 788 $ 787 $ 745 $ 714 (8%) $ 2,370 $ 2,246 (5%)
Coincident Net Credit Loss Ratio 4.71% 4.65% 4.40% 4.43% 4.35% 3.96% 3.50%
12 Month Lagged Net Credit Loss Ratio (5) 5.32% 5.11% 4.76% 4.61% 4.36% 4.20% 3.98%
Loans 90+ Days Past Due:
In millions of dollars $ 1,011 $ 958 $ 1,000 $ 1,066 $ 1,063 $ 929 $ 1,022 2%
% 1.46% 1.36% 1.42% 1.44% 1.45% 1.18% 1.23%
(1) Includes U.S. Bankcards, North America Diners Club, and Canada Bankcards.
(2) On a managed basis.
(3) Includes delinquency and other risk-based charges.
(4) Risk Adjusted Revenue is adjusted revenues less net credit losses.
(5) Adjusted for acquisitions.
Reclassified to conform to the current period's presentation.
Page 6
8. GLOBAL CONSUMER - Banking/Lending
CITIFINANCIAL
(In millions of dollars)
3Q 2000 vs. YTD YTD YTD 3Q 2000 vs.
1Q 2Q 3Q 4Q 1Q 2Q 3Q 3Q 1999 Increase/ 3Q 3Q YTD 3Q 1999 Increase/
1999 1999 1999 1999 2000 2000 2000 (Decrease) 1999 2000 (Decrease)
Total Revenues, Net of Interest Expense* $ 361 $ 396 $ 421 $ 441 $ 462 $ 474 $ 491 17% $ 1,178 $ 1,427 21%
Adjusted Operating Expenses 144 154 133 186 188 187 186 40% 431 $ 561 30%
Provision for Benefits, Claims, and Credit Losses 104 117 77 87 97 102 110 43% 298 $ 309 4%
Core Income Before Taxes 113 125 211 168 177 185 195 (8%) 449 557 24%
Income Taxes 42 47 76 60 65 68 71 (7%) 165 204 24%
Core Income $ 71 $ 78 $ 135 $ 108 $ 112 $ 117 $ 124 (8%) $ 284 $ 353 24%
Average Assets (in billions of dollars) $ 14 $ 15 $ 16 $ 18 $ 18 $ 19 $ 20 25% $ 15 $ 19 27%
Return on Assets 2.06% 2.09% 3.35% 2.38% 2.50% 2.48% 2.47% 2.53% 2.48%
Net receivables:
Real estate-secured loans (1) $ 7,179.5 $ 7,699.2 $ 8,439.6 $ 9,031.6 $ 9,354.6 $ 9,806.0 $ 10,236.7 21%
Personal loans (2) 4,647.2 4,886.2 5,102.5 5,319.7 5,408.3 5,626.6 5,828.4 14%
Sales finance and other 1,033.8 1,032.1 1,069.7 1,152.0 1,232.5 1,264.0 1,317.3 23%
Consumer finance receivables,
net of unearned finance charges 12,860.5 13,617.5 14,611.8 15,503.3 15,995.4 16,696.6 17,382.4 19%
Accrued interest receivable 99.3 106.5 121.7 133.2 126.5 134.7 145.1 19%
Allowance for credit losses (388.7) (436.4) (424.1) (407.8) (423.4) (423.4) (423.2) -
Consumer finance receivables, net $ 12,571.1 $ 13,287.6 $ 14,309.4 $ 15,228.7 $ 15,698.5 $ 16,407.9 $ 17,104.3 20%
Number of offices 1,143 1,177 1,173 1,174 1,182 1,212 1,240 6%
Average yield (3) 14.38% 14.48% 14.58% 14.35% 14.09% 14.05% 14.00% 14.48% 14.05%
Average net interest margin (3) 8.84% 8.99% 9.01% 8.66% 8.37% 8.16% 8.01% 8.95% 8.17%
Net credit loss ratio (3) 2.38% 2.14% 2.00% 2.19% 1.92% 1.93% 1.91% 2.17% 1.92%
Reserves as % of net receivables 3.02% 3.20% 2.90% 2.63% 2.65% 2.54% 2.43%
Loans 90+ Days Past Due:
In millions of dollars (3) 183 172 186 203 216 229 239 28%
% 1.42% 1.26% 1.27% 1.31% 1.33% 1.32% 1.29%
(1) Includes fully secured $.M.A.R.T. receivables,
as follows: $ 2,817.6 $ 3,117.4 $ 3,415.7 $ 3,766.0 $ 4,106.1 $ 4,415.7 $ 4,695.7 37%
(2) Includes $.A.F.E. and partially secured $.M.A.R.T.
receivables, as follows: $ 337.9 $ 334.2 $ 331.2 $ 329.6 $ 319.1 $ 315.7 $ 311.6 (6%)
(3) Includes loans held for sale
* Excludes realized gains on investments
Page 7
9. GLOBAL CONSUMER - Insurance
TRAVELERS LIFE AND ANNUITY
(In millions of dollars)
3Q 2000 vs. YTD YTD YTD 3Q 2000 vs.
1Q 2Q 3Q 4Q 1Q 2Q 3Q 3Q 1999 Increase/ 3Q 3Q YTD 3Q 1999 Increase/
1999 1999 1999 1999 2000 2000 2000 (Decrease) 1999 2000 (Decrease)
REVENUES, NET OF INTEREST EXPENSE * $ 771 $ 867 $ 869 $ 887 $ 1,010 $ 983 $ 899 3% $ 2,507 $ 2,892 15%
CORE INCOME $ 147 $ 173 $ 168 $ 135 $ 187 $ 202 $ 179 7% $ 488 $ 568 16%
Pre-tax contribution by source:
Individual annuities $ 88.4 $ 105.5 $ 93.0 $ 86.1 $ 107.8 $ 117.9 $ 117.8 27% $ 286.9 $ 343.5 20%
Group annuities 59.9 77.3 77.1 65.2 92.1 114.6 90.7 18% 214.3 297.4 39%
Life and long term care insurance 39.8 50.5 43.9 39.8 59.4 55.9 40.3 (8%) 134.2 155.6 16%
Other (includes run-off and return on excess capital) 33.0 28.8 39.3 17.4 20.3 13.0 17.4 (56%) 101.1 50.7 (50%)
Total $ 221.1 $ 262.1 $ 253.3 $ 208.5 $ 279.6 $ 301.4 $ 266.2 5% $ 736.5 $ 847.2 15%
Individual annuities:
Net written premiums & deposits:
Fixed $ 194.2 $ 249.7 $ 271.0 $ 292.6 $ 293.5 $ 302.6 $ 320.3 18% $ 714.9 $ 916.4 28%
Variable 975.7 1,048.3 1,089.8 1,151.3 1,245.0 1,258.5 1,273.6 17% 3,113.8 3,777.1 21%
Individual Payout 20.6 15.9 20.9 21.4 20.5 21.7 20.6 (1%) 57.4 62.8 9%
Total $ 1,190.5 $ 1,313.9 $ 1,381.7 $ 1,465.3 $ 1,559.0 $ 1,582.8 $ 1,614.5 17% $ 3,886.1 $ 4,756.3 22%
Policyholder account balances & benefit reserves: (1)
Fixed $ 7,839.3 $ 7,874.2 $ 7,958.5 $ 7,993.6 $ 7,911.3 $ 7,904.0 $ 7,939.8 -
Variable 14,172.9 15,770.8 15,897.0 19,310.6 21,072.7 21,013.2 21,678.1 36%
Individual Payout 599.6 604.4 611.8 617.3 619.6 626.2 630.0 3%
Total $ 22,611.8 $ 24,249.4 $ 24,467.3 $ 27,921.5 $ 29,603.6 $ 29,543.4 $ 30,247.9 24%
Group annuities:
Net written premiums & deposits (2) $ 1,859.6 $ 1,609.2 $ 1,212.3 $ 937.5 $ 1,456.9 $ 1,439.1 $ 1,481.8 22% $ 4,681.1 $ 4,377.8 (6%)
Policyholder account balances & benefit reserves: (1)
GICs and other investment contracts $ 9,766.4 $ 10,982.9 $ 10,917.7 $ 10,753.8 $ 11,087.0 $ 11,204.2 $ 11,966.9 10%
Payout group annuities 4,175.1 4,236.9 4,284.9 4,362.7 4,514.9 4,624.0 4,713.8 10%
Total $ 13,941.5 $ 15,219.8 $ 15,202.6 $ 15,116.5 $ 15,601.9 $ 15,828.2 $ 16,680.7 10%
Individual life insurance:
Net written premiums and deposits:
Direct periodic premiums and deposits $ 84.5 $ 86.7 $ 88.3 $ 149.2 $ 116.7 $ 113.4 $ 135.8 54% $ 259.5 $ 365.9 41%
Single premium deposits 16.2 20.8 17.2 30.0 18.3 21.0 22.3 30% 54.2 61.6 14%
Reinsurance (16.8) (17.8) (17.9) (18.5) (19.1) (20.3) (21.4) 20% (52.5) (60.8) 16%
Total $ 83.9 $ 89.7 $ 87.6 $ 160.7 $ 115.9 $ 114.1 $ 136.7 56% $ 261.2 $ 366.7 40%
Policyholder account balances & benefit reserves $ 2,468.3 $ 2,511.0 $ 2,535.3 $ 2,682.0 $ 2,755.3 $ 2,801.9 $ 2,911.0 15%
Life insurance in force (in billions, face amt.) $ 56.6 $ 57.7 $ 58.4 $ 60.6 $ 61.7 $ 63.2 $ 65.2 12%
Life insurance issued (in billions, face amt.) $ 2.5 $ 2.4 $ 2.0 $ 3.8 $ 2.7 $ 3.0 $ 3.1 55% $ 6.9 $ 8.8 28%
All businesses:
Net investment income (pretax) $ 525.4 $ 578.8 $ 593.2 $ 579.1 $ 594.9 $ 639.1 $ 609.1 3% $ 1,697.4 $ 1,843.1 9%
Interest credited to contractholders $ 225.7 $ 230.9 $ 239.0 $ 241.4 $ 244.7 $ 248.7 $ 266.7 12% $ 695.6 $ 760.1 9%
Statutory data:
Travelers Insurance Company
Statutory capital and surplus $ 4,955.9 $ 4,976.9 $ 5,010.2 $ 5,027.3 $ 5,011.2 $ 4,977.4 $ 5,355.1 7%
Surplus to liabilities ratio 19.8% 19.5% 20.2% 21.2% 20.5% 20.3% 21.3%
(1) Includes general account, separate accounts and managed funds.
(2) Excludes deposits of $24.0 and $45.0 in the first and second quarters of 2000 and $23.2, $416.0, $70.0 and $71.0 in the 1999 first, second, third and fourth quarters,
related to Travelers plans previously managed externally.
* Excludes realized gains on investments
Page 8
10. GLOBAL CONSUMER - Insurance
PRIMERICA FINANCIAL SERVICES
(In millions of dollars)
3Q 2000 vs. YTD YTD YTD 3Q 2000 vs.
1Q 2Q 3Q 4Q 1Q 2Q 3Q 3Q 1999 Increase/ 3Q 3Q YTD 3Q 1999 Increase/
1999 1999 1999 1999 2000 2000 2000 (Decrease) 1999 2000 (Decrease)
REVENUES, NET OF INTEREST EXPENSE * $ 432 $ 443 $ 444 $ 456 $ 472 $ 479 $ 474 7% $ 1,319 $ 1,425 8%
CORE INCOME
Life insurance $ 86 $ 89 $ 88 $ 84 $ 87 $ 93 $ 93 6% $ 263 $ 273 4%
Other financial products 24 24 26 31 32 32 31 19% 74 95 28%
Total core income $ 110 $ 113 $ 114 $ 115 $ 119 $ 125 $ 124 9% $ 337 $ 368 9%
Life Insurance
Face value (in billions) of:
Life insurance issued $ 13.6 $ 15.5 $ 12.4 $ 14.7 $ 15.0 $ 18.5 $ 16.8 35% $ 41.5 $ 50.3 21%
Life insurance in force $ 386.3 $ 391.7 $ 392.8 $ 394.9 $ 397.8 $ 403.6 $ 408.4 4% $ 392.8 $ 408.4 4%
Annualized issued premiums $ 42.4 $ 48.4 $ 39.3 $ 43.4 $ 44.1 $ 54.1 $ 49.5 26% $ 130.1 $ 147.7 14%
Direct premiums $ 315.2 $ 321.0 $ 320.5 $ 322.9 $ 324.5 $ 330.9 $ 334.3 4% $ 956.7 $ 989.7 3%
Earned premiums $ 267.1 $ 268.6 $ 264.8 $ 270.8 $ 270.6 $ 277.4 $ 275.0 4% $ 800.5 $ 823.0 3%
Other Products
Mutual fund sales at NAV:
Proprietary $ 407.7 $ 453.1 $ 393.7 $ 389.3 $ 465.0 $ 468.7 $ 448.5 14% $ 1,254.5 $ 1,382.2 10%
Other funds 233.5 277.3 257.6 307.6 497.1 552.5 397.8 54% 768.4 1,447.4 88%
Total U.S. mutual fund sales 641.2 730.4 651.3 696.9 962.1 1,021.2 846.3 30% 2,022.9 2,829.6 40%
Mutual fund sales - Canada 143.2 76.2 86.2 98.2 228.8 128.1 117.4 36% 305.6 474.3 55%
Total mutual fund sales $ 784.4 $ 806.6 $ 737.5 $ 795.1 $ 1,190.9 $ 1,149.3 $ 963.7 31% $ 2,328.5 $ 3,303.9 42%
Cash advanced on $.M.A.R.T. and $.A.F.E. loans (1) $ 419.2 $ 492.7 $ 488.3 $ 519.8 $ 492.0 $ 475.6 $ 457.2 (6%) $ 1,400.2 $ 1,424.8 2%
Variable annuity net written premiums and deposits $ 223.4 $ 278.6 $ 247.6 $ 240.5 $ 249.9 $ 248.0 $ 270.6 9% $ 749.6 $ 768.5 3%
Agents licensed for:
Life insurance 79,738 79,251 77,259 79,809 79,818 82,288 85,183 10%
Mutual funds 27,129 27,053 26,873 24,566 25,570 25,968 27,300 2%
$.M.A.R.T. / $.A.F.E. loans 129,556 118,762 108,377 95,816 93,055 99,481 105,640 (3%)
Variable annuities 13,816 14,497 16,042 16,424 16,453 16,692 17,281 8%
Long term care - - 3,419 6,540 8,010 7,785 9,612 181%
Home & auto insurance 15,102 14,734 15,425 14,284 13,238 13,038 12,194 (21%)
Financial Needs Analyses submitted 142,451 122,958 111,136 113,748 110,900 109,451 108,838 (2%) 376,545 329,189 (13%)
(1) The $.M.A.R.T. and $.A.F.E. loan products are marketed by PFS; the receivables are reflected in the assets of CitiFinancial.
* Excludes realized gains on investments
Page 9
11. GLOBAL CONSUMER - Insurance
TRAVELERS PROPERTY CASUALTY - PERSONAL LINES
(In millions of dollars)
3Q 2000 vs. YTD YTD YTD 3Q 2000 vs.
1Q 2Q 3Q 4Q 1Q 2Q 3Q 3Q 1999 Increase/ 3Q 3Q YTD 3Q 1999 Increase/
1999 1999 1999 1999 2000 2000 2000 (Decrease) 1999 2000 (Decrease)
REVENUES, NET OF INTEREST EXPENSE * $ 983 $ 1,005 $ 1,018 $ 1,037 $ 1,027 $ 1,041 $ 1,048 3% 3,006 $ 3,116 4%
CORE INCOME (1) $ 83 $ 79 $ 23 $ 94 $ 75 $ 82 $ 68 196% 185 $ 225 22%
Net written premiums by product line: (2)
Auto $ 619.6 $ 597.0 $ 581.1 $ 571.0 $ 583.3 $ 607.7 $ 598.6 3% $ 1,797.7 $ 1,789.6 -
Homeowners and other 363.8 353.9 370.6 347.8 306.4 375.7 394.2 6% 1,088.3 1,076.3 (1%)
Total net written premiums (a) $ 983.4 $ 950.9 $ 951.7 $ 918.8 $ 889.7 $ 983.4 $ 992.8 4% $ 2,886.0 $ 2,865.9 (1%)
Net written premiums by distribution channel: (2)
Independent agents $ 791.6 $ 750.6 $ 743.0 $ 721.2 $ 710.2 $ 790.4 $ 798.3 7% $ 2,285.2 $ 2,298.9 1%
Affinity group marketing 83.0 84.5 92.1 93.7 97.3 101.6 107.5 17% 259.6 306.4 18%
SECURE 57.2 62.6 58.5 46.3 30.8 26.4 16.7 (71%) 178.3 73.9 (59%)
Joint marketing arrangements 51.6 53.2 58.1 57.6 51.4 65.0 70.3 21% 162.9 186.7 15%
Total net written premiums (a) $ 983.4 $ 950.9 $ 951.7 $ 918.8 $ 889.7 $ 983.4 $ 992.8 4% $ 2,886.0 $ 2,865.9 (1%)
Statutory ratio development:
Earned premiums (b) $ 892.1 $ 905.1 $ 915.5 $ 921.6 $ 910.3 $ 920.0 $ 928.6 1% $ 2,712.7 $ 2,758.9 2%
Losses and loss adjustment expenses (c) 594.3 627.1 702.7 619.8 656.4 668.1 711.8 1% 1,924.1 2,036.3 6%
Other underwriting expenses (d) 269.8 242.5 258.7 244.7 239.8 251.2 256.6 (1%) 771.0 747.6 (3%)
Total deductions 864.1 869.6 961.4 864.5 896.2 919.3 968.4 1% 2,695.1 2,783.9 3%
Statutory underwriting gain/(loss) $ 28.0 $ 35.5 $ (45.9) $ 57.1 $ 14.1 $ 0.7 $ (39.8) 13% $ 17.6 $ (25.0) NM
Statutory combined ratio: (2)
Loss and loss adjustment expense ratio (c / b) 66.6% 69.3% 76.8% 67.3% 72.1% 72.6% 76.7% 70.9% 73.8%
Other underwriting expense ratio (d / a) 27.4% 25.5% 27.2% 26.6% 27.0% 25.5% 25.8% 26.7% 26.1%
Combined ratio 94.0% 94.8% 104.0% 93.9% 99.1% 98.1% 102.5% 97.6% 99.9%
Net investment income (pre-tax) $ 90.4 $ 98.8 $ 102.0 $ 109.0 $ 112.6 $ 114.6 $ 112.4 10% $ 291.2 $ 339.6 17%
Effective tax rate on net investment income 27.2% 27.7% 28.4% 28.9% 29.3% 29.5% 29.4% 27.8% 29.4%
Catastrophe losses, net of reinsurance (after-tax) $ 8.1 $ 23.2 $ 48.2 $ - $ 30.4 $ 17.2 $ 1.9 (96%) $ 79.5 $ 49.5 (38%)
(1) During April 2000, Travelers Insurance Group Inc. completed a cash tender offer to purchase all the outstanding shares of Class A Common Stock of Travelers Property Casualty Corp. at a
price of $41.95 per share. Results for the periods prior to April 20, 2000 are net of minority interest.
(2) The 1999 first quarter and nine months net written premiums include an adjustment associated with a reinsurance transaction, which increased homeowners premiums written by independent agents by
$71.7 million. Excluding this transaction, the statutory loss and loss adjustment expense ratio, other underwriting expense ratio, and combined ratio for the 1999 first quarter were 66.6%, 26.6% and 93.2%,
respectively, and for the 1999 nine months were 70.9%, 26.4%, and 97.3%, respectively.
* Excludes realized gains on investments
NM - Not meaningful
Page 10
12. GLOBAL CONSUMER - International
EUROPE, MIDDLE EAST & AFRICA
(In millions of dollars)
3Q 2000 vs. YTD YTD YTD 3Q 2000 vs.
1Q 2Q 3Q 4Q 1Q 2Q 3Q 3Q 1999 Increase/ 3Q 3Q YTD 3Q 1999 Increase/
1999 1999 1999 1999 2000 2000 2000 (Decrease) 1999 2000 (Decrease)
Total Revenues, Net of Interest Expense $ 561 $ 563 $ 607 $ 597 $ 593 $ 576 $ 572 (6%) $ 1,731 $ 1,741 1%
Adjusted Operating Expenses 373 369 370 389 357 365 341 (8%) 1,112 1,063 (4%)
Provision for Benefits, Claims, and Credit Losses 80 77 79 76 74 67 67 (15%) 236 208 (12%)
Core Income Before Taxes 108 117 158 132 162 144 164 4% 383 470 23%
Income Taxes 40 44 60 50 60 53 61 2% 144 174 21%
Core Income $ 68 $ 73 $ 98 $ 82 $ 102 $ 91 $ 103 5% $ 239 $ 296 24%
Average Assets (in billions of dollars) $ 22 $ 22 $ 23 $ 22 $ 22 $ 21 $ 21 (9%) $ 22 $ 21 (5%)
Return on Assets 1.25% 1.33% 1.69% 1.48% 1.86% 1.74% 1.95% 1.45% 1.88%
Average Loans (in billions of dollars)
Personal $ 9.9 $ 9.9 $ 10.4 $ 10.2 $ 9.9 $ 9.8 $ 9.6 (8%) $ 10.1 $ 9.8 (3%)
Cards 2.1 2.1 2.2 2.2 2.1 2.1 2.1 (5%) 2.1 2.1 -
Mortgages 2.0 1.9 1.9 1.8 1.8 1.7 1.7 (11%) 1.9 1.7 (11%)
Auto 1.5 1.5 1.6 1.6 1.6 1.6 1.7 6% 1.5 1.6 7%
Other 1.2 1.0 1.2 1.4 1.4 1.3 1.3 8% 1.1 1.3 18%
Total $ 16.7 $ 16.4 $ 17.3 $ 17.2 $ 16.8 $ 16.5 $ 16.4 (5%) $ 16.7 $ 16.5 (1%)
Average Customer Deposits (in billions of dollars) $ 18.0 $ 17.3 $ 17.1 $ 16.6 $ 16.6 $ 16.2 $ 16.0 (6%) $ 17.5 $ 16.3 (7%)
EOP Accounts (in millions) 10.6 10.7 10.9 11.0 11.3 11.6 12.0 10%
EOP Card Accounts (in millions) 3.4 3.5 3.6 3.6 3.6 3.8 3.9 8%
Non-Interest Revenue as % of Total Revenues 35.6% 34.8% 36.2% 38.9% 36.7% 35.4% 36.9% 35.2% 36.1%
Net Credit Loss Ratio 1.81% 1.71% 1.60% 1.56% 1.70% 1.57% 1.54%
Loans 90+ Days Past Due:
In millions of dollars $ 893 $ 899 $ 953 $ 914 $ 875 $ 868 $ 800 (16%)
% 5.40% 5.46% 5.45% 5.33% 5.26% 5.09% 4.93%
Proprietary Mutual Funds / UIT $ 279 $ 771 $ 394 $ 443 $ 397 $ 391 $ 226 (43%) $ 1,444 $ 1,014 (30%)
Proprietary Money Market Funds 473 433 253 177 194 108 101 (60%) 1,159 403 (65%)
Total Proprietary Funds 752 1,204 647 620 591 499 327 (49%) 2,603 1,417 (46%)
Third Party Funds 227 133 203 307 508 487 779 284% 563 1,774 215%
Mutual Fund / UIT Sales at NAV (in millions of dollars) $ 979 $ 1,337 $ 850 $ 927 $ 1,099 $ 986 $ 1,106 30% $ 3,166 $ 3,191 1%
Branches 471 466 464 466 470 475 490 6%
ATM-only locations 74 78 78 76 79 83 89 14%
Proprietary ATMs 923 927 930 935 950 956 995 7%
Western Europe:
Adjusted Revenues $ 493 $ 489 $ 499 $ 510 $ 497 $ 474 $ 466 (7%) $ 1,481 $ 1,437 (3%)
Core Income $ 65 $ 67 $ 71 $ 72 $ 88 $ 75 $ 88 24% $ 203 $ 251 24%
Central & Eastern Europe, Middle East and Africa:
Adjusted Revenues $ 68 $ 74 $ 108 $ 87 $ 96 $ 102 $ 106 (2%) $ 250 $ 304 22%
Core Income $ 3 $ 6 $ 27 $ 10 $ 14 $ 16 $ 15 (44%) $ 36 $ 45 25%
Reclassified to conform to the current period's presentation.
Page 11