SlideShare ist ein Scribd-Unternehmen logo
1 von 39
Downloaden Sie, um offline zu lesen
CITIGROUP - QUARTERLY FINANCIAL DATA SUPPLEMENT                                1Q06

                                                                      Page Number

 Citigroup Consolidated
    Financial Summary                                                      1
    Segment Income:
       Product View                                                        2
       Regional View                                                       3
    Segment Net Revenues:
       Product View                                                        4
       Regional View                                                       5
    Consolidated Statement of Income                                       6
    Consolidated Balance Sheet                                             7


 Segment Detail

    Global Consumer:                                                       8
      U.S.
       U.S. Cards                                                       9 - 10
       U.S. Retail Distribution                                         11 - 12
       U.S. Consumer Lending                                            13 - 14
       U.S. Commercial Business                                           15
      International
        International Cards                                             16 - 17
        International Consumer Finance                                  18 - 19
        International Retail Banking                                    20 - 21


    Corporate and Investment Banking:                                     22
      Income Statement                                                    23
      Revenue Details                                                     24
      Capital Markets and Banking                                         25
      Transaction Services                                                26

    Global Wealth Management:                                             27
      Smith Barney                                                        28
      Private Bank                                                        29


    Alternative Investments                                               30


 Citigroup Supplemental Detail
    Average Balances - Yields                                             31
    Return on Capital                                                     32
    Consumer Loan Delinquency Amounts, Net Credit Losses and Ratios       33
    Allowance for Credit Losses:
        Total Citigroup                                                   34
        Consumer Loans                                                    35
        Corporate Loans                                                   36
    Components of Provision for Loan Losses                               37
    Non-Performing Assets                                                 38
CITIGROUP -- FINANCIAL SUMMARY
(In millions of dollars, except per share amounts)


                          Citigroup, the leading global financial services company, has some 200 million customer accounts and does business in more than 100 countries, providing consumers,
                                                               corporations, governments and institutions a complete range of financial products and services.

                                                                                                                                                                                                   1Q 2006 vs.
                                                                                          1Q                   2Q                   3Q                   4Q                 1Q                  1Q 2005 Increase/
                                                                                         2005                 2005                 2005                 2005               2006                    (Decrease)


   Income from Continuing Operations                                                 $        5,115       $      4,731         $      4,988         $      4,972       $      5,555                    9%
   Discontinued Operations, After-tax                                                           326                  342              2,155                2,009                       84
   Cumulative Effect of Accounting Change                                                        -                    -                    -                    (49)               -

   Net Income                                                                        $        5,441       $      5,073         $      7,143         $      6,932       $      5,639                    4%


   Diluted Earnings Per Share:
   Income from Continuing Operations                                                 $          0.98      $          0.91      $          0.97      $          0.98    $          1.11                13%

   Net Income                                                                        $          1.04      $          0.97      $          1.38      $          1.37    $          1.12                 8%


   Adjusted weighted average common shares
       applicable to Diluted EPS (in millions)                                              5,226.0             5,208.1              5,146.0              5,061.3            5,007.9

   Preferred Dividends - Diluted                                                     $               17   $               17   $               17   $           17     $               16


   Common Shares Outstanding, at period end (in millions)                                   5,202.2             5,170.1              5,059.0              4,980.2            4,971.2


   Tier 1 Capital Ratio                                                                       8.78%              8.71%                9.12%                8.79%                  8.5% *
   Total Capital Ratio                                                                       12.03%             11.87%               12.37%               12.02%              11.7% *
   Leverage Ratio                                                                             5.19%              5.19%                5.53%                5.35%                  5.2% *


   Total Assets, at period end (in billions)                                         $      1,489.9       $     1,547.8        $     1,472.8        $     1,494.0      $     1,586.2        *
   Stockholders' Equity, at period end (in billions)                                 $        110.5       $      113.0         $      111.8         $      112.5       $      114.4         *
   Equity and Trust Securities, at period end (in billions)                          $        116.9       $      119.5         $      118.2         $      118.8       $      120.6         *


   Book Value Per Share, at period end                                               $        21.03       $      21.65         $      21.88         $      22.37       $      22.82         *


   Return on Common Equity (Net Income)                                                       20.3%              18.4%                25.4%                25.0%              20.3%

   Return on Risk Capital (Income from Continuing Operations)                                   40%                  36%                  37%                  37%                41%


   * Preliminary


                                                                                                                                                                                                                    Page 1
CITIGROUP -- NET INCOME
PRODUCT VIEW
(In millions of dollars)


                                                                                                                                                                                                                      1Q 2006 vs.
                                                                                                            1Q                        2Q                     3Q                     4Q                 1Q           1Q 2005 Increase/
                                                                                                           2005                      2005                   2005                   2005               2006             (Decrease)
Global Consumer:

     U.S. Cards                                                                                   $                  778        $           735       $            797         $          444     $          926          19%
     U.S. Retail Distribution                                                                                        564                    478                    319                    391                515          (9%)
     U.S. Consumer Lending                                                                                           486                    507                    487                    458                437         (10%)
     U.S. Commercial Business                                                                                        252                    134                    222                    121                126         (50%)

       Total U.S. Consumer (1)                                                                                     2,080                  1,854                  1,825                1,414              2,004            (4%)


     International Cards                                                                                             302                    331                    383                    357                291          (4%)
     International Consumer Finance                                                                                  139                    177                    152                    174                168          21%
     International Retail Banking                                                                                    498                    593                    427                    565                677          36%

       Total International Consumer                                                                                  939                  1,101                    962                1,096              1,136            21%

     Other                                                                                                           (176)                   (58)                   (64)                   (76)              (67)         62%

       Total Global Consumer                                                                                       2,843                  2,897                  2,723                2,434              3,073             8%

Corporate and Investment Banking:

     Capital Markets and Banking                                                                                   1,439                  1,043                  1,424                1,421              1,618            12%
     Transaction Services                                                                                            245                    288                    327                  275                323            32%
     Other (2)                                                                                                            (5)                    41                     46                351                (12)          NM

        Total Corporate and Investment Banking                                                                     1,679                  1,372                  1,797                2,047              1,929            15%

Global Wealth Management:
     Smith Barney                                                                                                    197                    239                    227                    208                168         (15%)
     Private Bank                                                                                                    122                         83                     79                 89                119          (2%)

     Total Global Wealth Management                                                                                  319                    322                    306                    297                287         (10%)


Alternative Investments                                                                                              362                    385                    339                    351                353          (2%)

Corporate / Other                                                                                                     (88)                  (245)                  (177)                  (157)              (87)          1%


Income From Continuing Operations                                                                                  5,115                 4,731                  4,988                4,972              5,555              9%

Discontinued Operations (3)(4)                                                                                       326                    342                  2,155                2,009                   84

Cumulative Effect of Accounting Change (5)                                                                            -                      -                      -                      (49)              -

Net Income                                                                                        $                5,441        $        5,073        $         7,143          $     6,932        $     5,639              4%


(1) U.S. disclosure includes Canada and Puerto Rico.

(2) The 2005 fourth quarter includes a $375 million after-tax release of WorldCom Settlement and Litigation Reserves.

(3) Discontinued Operations includes the operations from the Company's January 31, 2005 announced agreement for the sale of Citigroup's Travelers Life & Annuity, and substantially all of Citigroup's
       international insurance business, to MetLife, Inc. The transaction closed during the 2005 third quarter and resulted in a $3.4 billion ($2.1 billion after-tax) gain.

(4) Discontinued Operations includes the operations from the Company's June 24, 2005 announced agreement for the sale of substantially all of Citigroup's Asset Management business to Legg Mason, Inc.
       The transaction closed during the 2005 fourth quarter and resulted in a $3.4 billion ($2.1 billion after-tax) gain.

(5) Cumulative Effect of Accounting Change represents the adoption of FIN 47, quot;Accounting for Conditional Asset Retirement Obligations, an interpretation of SFAS No. 143quot;.
     This pronouncement is applicable to real estate leasing agreements that required Citigroup to restore the leased space back to its original condition upon termination of
     the lease.


NM Not meaningful

                                                                                                                                                                                                                                        Page 2
Reclassified to conform to the current period's presentation.
CITIGROUP -- NET INCOME
REGIONAL VIEW
(In millions of dollars)


                                                                                                                                                                                             1Q 2006 vs.
                                                                                         1Q                    2Q                  3Q                 4Q                    1Q             1Q 2005 Increase/
                                                                                        2005                  2005                2005               2005                  2006               (Decrease)

   U.S. (1)
     Global Consumer                                                             $             1,904     $         1,796     $        1,761      $        1,338       $        1,937              2%
     Corporate and Investment Banking                                                            893                 462                637                 958                  515            (42%)
     Global Wealth Management                                                                    273                 315                288                 265                  228            (16%)

        Total U.S.                                                                             3,070               2,573              2,686               2,561                2,680            (13%)

   Mexico
     Global Consumer                                                                             277                 368                 511                276                   358            29%
     Corporate and Investment Banking                                                             83                  76                 177                114                    78            (6%)
     Global Wealth Management                                                                     13                  10                  12                  9                     8           (38%)

        Total Mexico                                                                             373                 454                 700                399                   444            19%
   Europe, Middle East and Africa (EMEA)
     Global Consumer                                                                             122                 124                 (154)              282                   185            52%
     Corporate and Investment Banking                                                            188                 336                  358               248                   635            NM
     Global Wealth Management                                                                     (1)                  3                    8                (2)                    3            NM
        Total EMEA                                                                               309                 463                 212                528                   823             NM

   Japan
     Global Consumer                                                                             175                 188                 169                174                   188             7%
     Corporate and Investment Banking                                                             48                  54                  58                338                     85           77%
     Global Wealth Management                                                                     (8)                (45)                (29)               -                     -              100%
        Total Japan                                                                              215                 197                 198                512                   273            27%

   Asia (excluding Japan)
     Global Consumer                                                                             311                 341                 375                323                   347            12%
     Corporate and Investment Banking                                                            322                 249                 382                295                   414            29%
     Global Wealth Management                                                                     35                  31                  26                 24                    45            29%

        Total Asia                                                                               668                 621                 783                642                   806            21%

   Latin America
     Global Consumer                                                                              54                  80                  61                 41                    58             7%
     Corporate and Investment Banking                                                            145                 195                 185                 94                   202            39%
     Global Wealth Management                                                                      7                   8                   1                  1                     3           (57%)

        Total Latin America                                                                      206                 283                 247                136                   263            28%


   Alternative Investments                                                                       362                 385                 339                351                   353            (2%)

   Corporate / Other                                                                             (88)                (245)               (177)              (157)                 (87)            1%


Income From Continuing Operations                                                              5,115              4,731               4,988              4,972                 5,555              9%

   Discontinued Operations                                                                       326                 342              2,155               2,009                    84

   Cumulative Effect of Accounting Change                                                        -                    -                   -                  (49)                 -


Net Income                                                                       $             5,441     $        5,073      $        7,143      $       6,932        $        5,639              4%


Total International                                                              $             1,771     $         2,018     $        2,140      $        2,217       $        2,609             47%


(1) Excludes Alternative Investments and Corporate / Other which are predominantly related to the U.S. The U.S. regional disclosure includes Canada and Puerto Rico. Global Consumer for
     the U.S includes Other Consumer.

NM Not meaningful
                                                                                                                                                                                                               Page 3
Reclassified to conform to the current period's presentation.
CITIGROUP -- NET REVENUES
PRODUCT VIEW
(In millions of dollars)


                                                                                                                                                                 1Q 2006 vs.
                                                                     1Q                 2Q                 3Q                 4Q                 1Q            1Q 2005 Increase/
                                                                    2005               2005               2005               2005               2006              (Decrease)
Global Consumer:


      U.S. Cards                                                $      3,455       $      3,263       $      3,381       $      2,725       $      3,234             (6%)
      U.S. Retail Distribution                                         2,457              2,360              2,339              2,359              2,296             (7%)
      U.S. Consumer Lending                                            1,373              1,376              1,332              1,388              1,260             (8%)
      U.S. Commercial Business                                             678                491                649                481                470          (31%)

       Total U.S. Consumer (1)                                         7,963              7,490              7,701              6,953              7,260             (9%)


      International Cards                                              1,105              1,176              1,209              1,360              1,280             16%
      International Consumer Finance                                       948                963                950                958                962            1%
      International Retail Banking                                     2,305              2,396              2,474              2,552              2,467              7%

       Total International Consumer                                    4,358              4,535              4,633              4,870              4,709              8%


      Other                                                                (203)               (18)               (13)               (24)               (14)         93%
       Total Global Consumer                                          12,118             12,007             12,321             11,799             11,955             (1%)

Corporate and Investment Banking:

      Capital Markets and Banking                                      4,899              3,965              5,187              4,919              5,896             20%
      Transaction Services                                             1,137              1,191              1,246              1,317              1,382             22%
      Other                                                                1                  -                  1                  -                  1               -

        Total Corporate and Investment Banking                         6,037              5,156              6,434              6,236              7,279             21%


Global Wealth Management:

      Smith Barney                                                     1,669              1,647              1,728              1,781              1,987             19%
      Private Bank                                                         504                453                446                456                496           (2%)

       Total Global Wealth Management                                  2,173              2,100              2,174              2,237              2,483             14%


Alternative Investments                                                    866            1,112                  720                732                675          (22%)

Corporate / Other                                                             2               (206)              (151)              (225)              (209)         NM


Total Net Revenues                                              $     21,196       $     20,169       $     21,498       $     20,779       $     22,183             5%


(1)      U.S. disclosure includes Canada and Puerto Rico.


NM Not meaningful

Reclassified to conform to the current period's presentation.
                                                                                                                                                                                   Page 4
CITIGROUP -- NET REVENUES
REGIONAL VIEW
(In millions of dollars)


                                                                                                                                                                                              1Q 2006 vs.
                                                                                         1Q                  2Q                  3Q                  4Q                    1Q              1Q 2005 Increase/
                                                                                        2005                2005                2005                2005                  2006                (Decrease)

   U.S. (1)
      Global Consumer                                                              $         7,760     $         7,472     $         7,688     $         6,929       $         7,246             (7%)
      Corporate and Investment Banking                                                       2,779               1,948               2,810               2,364                 2,923              5%
      Global Wealth Management                                                               1,872               1,852               1,923               1,981                 2,154             15%

         Total U.S.                                                                         12,411             11,272              12,421              11,274                12,323              (1%)

   Mexico
     Global Consumer                                                                           960               1,055               1,139               1,219                 1,149             20%
     Corporate and Investment Banking                                                          159                 170                 236                 212                   186             17%
     Global Wealth Management                                                                   31                  31                  30                  32                    31               -

         Total Mexico                                                                        1,150               1,256               1,405               1,463                 1,366             19%

   Europe, Middle East and Africa (EMEA)
     Global Consumer                                                                         1,248               1,256               1,271               1,426                 1,270             2%
     Corporate and Investment Banking                                                        1,694               1,708               1,801               1,646                 2,296             36%
     Global Wealth Management                                                                   71                  71                  79                  74                    75             6%

         Total EMEA                                                                          3,013               3,035               3,151               3,146                 3,641             21%

   Japan
     Global Consumer                                                                           821                 827                 803                 800                   775             (6%)
     Corporate and Investment Banking                                                          180                 187                 211                 646                   296              64%
     Global Wealth Management                                                                   22                 (15)                (13)                -                     -              (100%)
         Total Japan                                                                         1,023                 999               1,001               1,446                 1,071              5%

   Asia (excluding Japan)
     Global Consumer                                                                         1,072               1,116               1,141               1,132                 1,189             11%
     Corporate and Investment Banking                                                          915                 761               1,004               1,017                 1,132             24%
     Global Wealth Management                                                                  119                 111                 107                 103                   180             51%
         Total Asia                                                                          2,106               1,988               2,252               2,252                 2,501             19%

   Latin America
      Global Consumer                                                                          257                 281                 279                 293                   326              27%
      Corporate and Investment Banking                                                         310                 382                 372                 351                   446              44%
      Global Wealth Management                                                                  58                  50                  48                  47                    43             (26%)
         Total Latin America                                                                   625                 713                 699                 691                   815             30%


   Alternative Investments                                                                     866               1,112                 720                 732                   675             (22%)

   Corporate / Other                                                                             2                 (206)               (151)               (225)                 (209)            NM


Total Net Revenues                                                                 $       21,196      $       20,169      $       21,498      $      20,779         $      22,183                5%


Total International                                                                $         7,917     $         7,991     $         8,508     $         8,998       $         9,394             19%


(1) Excludes Alternative Investments and Corporate / Other which are predominantly related to the U.S. The U.S. regional disclosure includes Canada and Puerto Rico. Global Consumer for
    the U.S includes Other Consumer.

NM Not meaningful


Reclassified to conform to the current period's presentation.                                                                                                                                                  Page 5
CITIGROUP CONSOLIDATED STATEMENT OF INCOME
(In millions of dollars)


                                                                                                                                                                                               1Q 2006 vs.
                                                                                        1Q                   2Q                  3Q                   4Q                    1Q              1Q 2005 Increase/
                                                                                       2005                 2005                2005                 2005                  2006                (Decrease)
Revenues
   Loan interest, including fees                                                  $        11,273      $        11,486     $        12,066     $        12,363        $       12,809                14%
   Other interest and dividends                                                             6,262                6,981               7,309               8,281                 9,055                45%
   Insurance premiums                                                                         735                  793                 743                 861                   770                 5%
   Commissions and fees                                                                     4,209                3,978               4,825               4,131                 5,188                23%
   Principal transactions                                                                   2,215                  844               1,950               1,434                 2,117                (4%)
   Asset management and administration fees                                                 1,508                1,488               1,522               1,601                 1,705                13%
   Realized gains (losses) from sales of investments                                          243                  455                 284                 980                   379                56%
   Other revenue                                                                            2,175                2,812               2,448               2,063                 2,267                 4%
      Total revenues                                                                       28,620               28,837              31,147              31,714                34,290                20%
      Interest expense                                                                      7,424                8,668               9,649              10,935                12,107                63%
        Total revenues, net of interest expense                                            21,196               20,169              21,498              20,779                22,183                 5%

Provisions for Credit Losses and for Benefits and Claims
   Policyholder benefits and claims                                                           217                  212                 215                  223                  227                 5%
   Provision for loan losses                                                                1,813                1,720               2,525                1,871                1,396               (23%)
   Provision for unfunded lending commitments                                                   -                  100                 100                   50                   50                  -
        Total provisions for credit losses and for benefits and claims                      2,030                2,032               2,840                2,144                1,673               (18%)

Operating Expenses
   Compensation and benefits                                                                6,486                6,033               6,792               6,461                 8,263                27%
   Net occupancy expense                                                                    1,241                1,271               1,270               1,359                 1,382                11%
   Technology / communication expense                                                         866                  884                 892                 882                   886                 2%
   Advertising and marketing expense                                                          641                  620                 587                 685                   603                (6%)
   Other operating                                                                          2,170                2,164               1,872               1,987                 2,224                 2%
      Total operating expenses                                                             11,404               10,972              11,413              11,374                13,358                17%


Income from Continuing Operations before Income
      Taxes and Minority Interest and
      Cumulative Effect of Accounting Change                                                7,762                7,165               7,245                7,261                7,152                (8%)

Provision (benefit) for income taxes                                                        2,484                2,179               2,164                2,251                1,537               (38%)
Minority interest, net of income taxes                                                        163                  255                  93                   38                   60               (63%)

Income from Continuing Operations before
    Cumulative Effect of Accounting Change                                                  5,115                4,731               4,988                4,972                5,555                 9%

Discontinued Operations (1) (2)
    Income from Discontinued Operations                                                       483                  493                  49                 (117)                     1
    Gain on Sale                                                                                -                    -               3,386                3,404                     21
    Provision for income taxes and minority interest, net of taxes                            157                  151               1,280                1,278                    (62)
Income from Discontinued Operations, net                                                      326                  342               2,155                2,009                     84

Cumulative Effect of Accounting Change (3)                                                       -                    -                   -                 (49)                     -

Net Income                                                                        $         5,441      $         5,073     $         7,143     $          6,932       $        5,639                 4%

(1)     Discontinued Operations includes the operations from the Company's January 31, 2005 announced agreement for the sale of Citigroup's Travelers Life & Annuity, and substantially all of Citigroup's
         international insurance business, to MetLife, Inc. The transaction closed during the 2005 third quarter and resulted in a $3.4 billion ($2.1 billion after-tax) gain.

(2)     Discontinued Operations includes the operations from the Company's June 24, 2005 announced agreement for the sale of substantially all of Citigroup's Asset Management business to Legg Mason, Inc.
         The transaction closed during the 2005 fourth quarter and resulted in a $3.4 billion ($2.1 billion after-tax) gain.

(3)     Cumulative Effect of Accounting Change represents the adoption of FIN 47, quot;Accounting for Conditional Asset Retirement Obligations, an interpretation of SFAS No. 143quot;.
        This pronouncement is applicable to real estate leasing agreements that required Citigroup to restore the leased space back to its original condition upon termination o
        the lease.


Reclassified to conform to the current period's presentation.
                                                                                                                                                                                                                Page 6
CITIGROUP CONSOLIDATED BALANCE SHEET
(In millions of dollars)


                                                                                                                                                                                                                                                                                     March 31, 2006
                                                                                                                                                                                                                                                                                            vs.
                                                                                                                                                March 31,                     June 30,                September 30,                  December 31,                March 31,          December 31, 2005
                                                                                                                                                  2005                          2005                      2005                           2005                     2006 (1)              Inc (Decr)
Assets
Cash and due from banks (including segregated cash and other deposits)                                                                  $                  25,620       $            28,942       $                 28,438       $           28,373          $            26,355          (7%)
Deposits at interest with banks                                                                                                                            28,568                    31,322                         30,604                   26,904                       28,276           5%
Federal funds sold and securities borrowed or purchased under agreements to resell                                                                        202,099                   232,369                        236,105                  217,464                      239,552          10%
Brokerage receivables                                                                                                                                      40,747                    42,977                         42,006                   42,823                       42,569          (1%)
Trading account assets                                                                                                                                    272,841                   281,035                        293,416                  295,820                      328,135          11%
Investments                                                                                                                                               167,589                   165,587                        165,905                  180,597                      193,970           7%
Loans, net of unearned income
  Consumer                                                                                                                                                430,008                   433,057                        440,145                  454,620                      462,068           2%
  Corporate                                                                                                                                               117,651                   123,880                        126,276                  128,883                      143,239          11%
Loans, net of unearned income                                                                                                                             547,659                   556,937                        566,421                  583,503                      605,307           4%
Allowance for credit losses                                                                                                                               (10,894)                  (10,418)                       (10,015)                  (9,782)                      (9,505)          3%
  Total loans, net                                                                                                                                        536,765                   546,519                        556,406                  573,721                      595,802           4%
Goodwill                                                                                                                                                   32,076                    32,235                         32,240                   33,130                       32,933          (1%)
Intangible assets                                                                                                                                          15,572                    13,894                         14,376                   14,749                       15,092           2%
Other assets                                                                                                                                               72,936                    78,485                         72,117                   80,456                       83,517           4%
Assets of discontinued operations held for sale                                                                                                            95,078                    94,424                          1,180                      -                            -              -

Total assets                                                                                                                            $               1,489,891       $         1,547,789       $             1,472,793        $        1,494,037          $       1,586,201             6%


Liabilities
   Non-interest-bearing deposits in U.S. offices                                                                                        $                  39,092       $            38,312       $                 38,673       $           37,405          $            38,684           3%
   Interest-bearing deposits in U.S. offices                                                                                                              159,889                   159,825                        162,310                  169,277                      176,032           4%
   Non-interest-bearing deposits in offices outside the U.S.                                                                                               29,930                    31,281                         32,374                   32,614                       34,323           5%
   Interest-bearing deposits in offices outside the U.S.                                                                                                  339,963                   343,156                        347,756                  353,299                      379,118           7%

Total deposits                                                                                                                                            568,874                   572,574                        581,113                  592,595                      628,157           6%
Federal funds purchased and securities loaned or sold under agreements to repurchase                                                                      217,599                   252,774                        243,819                  242,392                      279,540          15%
Brokerage payables                                                                                                                                         52,088                    53,600                         57,330                   70,994                       70,214          (1%)
Trading account liabilities                                                                                                                               120,511                   133,807                        140,723                  121,108                      144,888          20%
Short-term borrowings                                                                                                                                      62,704                    62,984                         58,224                   66,930                       58,130          (13%)
Long-term debt                                                                                                                                            207,935                   211,346                        213,894                  217,499                      227,165            4%
Other liabilities (2)                                                                                                                                      63,271                    63,455                         65,488                   69,982                       63,689           (9%)
Liabilities of discontinued operations held for sale                                                                                                       86,373                    84,212                            365                        -                          -               -
Total liabilities                                                                                                                                       1,379,355                 1,434,752                     1,360,956                 1,381,500                  1,471,783             7%

Stockholders' equity
Preferred Stock                                                                                                                                             1,125                     1,125                          1,125                    1,125                        1,000          (11%)
Common Stock                                                                                                                                                   55                        55                             55                       55                           55            -
Additional paid-in capital                                                                                                                                 16,243                    17,160                         17,636                   17,483                       17,119          (2%)
Retained earnings                                                                                                                                         105,269                   108,026                        112,868                  117,555                      120,703           3%
Treasury stock                                                                                                                                            (10,475)                  (12,299)                       (17,290)                 (21,149)                     (21,753)         (3%)
Accumulated other changes in equity from nonowner sources                                                                                                  (1,681)                   (1,030)                        (2,557)                  (2,532)                      (2,706)         (7%)
Total stockholders' equity                                                                                                                                110,536                   113,037                        111,837                  112,537                      114,418           2%

Total liabilities and stockholders' equity                                                                                              $               1,489,891       $         1,547,789       $             1,472,793        $        1,494,037          $       1,586,201             6%


(1)     Preliminary.
(2)     Includes allowance for credit losses for letters of credit and unfunded lending commitments of $600 million, $700 million, $800 million and $850 million for the first, second, third and fourth quarters of 2005, respectively, and $900 million in the first
        quarter of 2006.


Reclassified to conform to the current period's presentation.


                                                                                                                                                                                                                                                                                                        Page 7
GLOBAL CONSUMER
(In millions of dollars)


                                                                                                                                                                 1Q 2006 vs.
                                                                     1Q                 2Q                3Q                 4Q                 1Q            1Q 2005 Increase/
                                                                    2005               2005              2005               2005               2006              (Decrease)

Global Consumer:

Total Revenues, Net of Interest Expense                         $     12,118       $     12,007      $     12,321       $     11,799       $     11,955             (1%)
Total Operating Expenses                                               5,846              5,753             5,657              6,062              6,357              9%
Provisions for Loan Losses and for Benefits and Claims                 2,102              2,047             2,770              2,144              1,668             (21%)
Income Before Taxes and Minority Interest                              4,170              4,207             3,894              3,593              3,930             (6%)
Income Taxes                                                           1,314              1,295             1,153              1,142                  847           (36%)
Minority Interest, Net of Tax                                             13                 15                18                 17                   10           (23%)

Net Income                                                      $      2,843       $      2,897      $      2,723       $      2,434       $      3,073              8%


U.S.:

Total Revenues, Net of Interest Expense                         $      7,963       $      7,490      $      7,701       $      6,953       $      7,260             (9%)
Total Operating Expenses                                               3,337              3,358             3,290              3,464              3,569              7%
Provisions for Loan Losses and for Benefits and Claims                 1,429              1,317             1,573              1,281                  901           (37%)
Income Before Taxes and Minority Interest                              3,197              2,815             2,838              2,208              2,790             (13%)

Income Taxes                                                           1,104                  945               996                778                777           (30%)
Minority Interest, Net of Tax                                               13                 16                17                 16                   9          (31%)

Net Income                                                      $      2,080       $      1,854      $      1,825       $      1,414       $      2,004             (4%)


International:

Total Revenues, Net of Interest Expense                         $      4,358       $      4,535      $      4,633       $      4,870       $      4,709              8%
Total Operating Expenses                                               2,422              2,320             2,280              2,498              2,621              8%
Provisions for Loan Losses and for Benefits and Claims                     673                730           1,197                  863                767           14%
Income Before Taxes and Minority Interest                              1,263              1,485             1,156              1,509              1,321              5%

Income Taxes                                                               324                385               193                412                184           (43%)
Minority Interest, Net of Tax                                               -                  (1)                1                  1                  1             -
Net Income                                                      $          939     $      1,101      $          962     $      1,096       $      1,136             21%


Other Consumer:

Total Revenues, Net of Interest Expense                         $          (203)   $          (18)   $           (13)   $           (24)   $           (14)         93%
Total Operating Expenses                                                    87                 75                87                100                167           92%
Income Before Taxes                                                        (290)              (93)              (100)              (124)              (181)         38%
Income Taxes                                                               (114)              (35)               (36)               (48)              (114)           -
Net Income                                                      $          (176)   $          (58)   $           (64)   $           (76)   $           (67)         62%


Reclassified to conform to the current period's presentation.
                                                                                                                                                                                  Page 8
For your convenience, an excerpt from our 2006 first quarter earnings press release is set out below. The full text of the press release,
GLOBAL CONSUMER                                            and those from prior periods, are available on Citigroup's website at www.citigroup.com.
U.S.                                                       ** Net income increased 19%, partially reflecting sharply lower credit costs. Credit costs declined, as lower bankruptcy filings and a

CARDS - Page 1                                                  continued favorable credit environment combined to drive the managed net credit loss ratio down by 168 bps to 3.90%.
(In millions of dollars)                                   ** Revenues declined, reflecting lower average managed receivables and continued net interest margin compression. Receivables
                                                                growth in reward and private label cards was more than offset by declines in traditional card products. The benefit of 11% growth
                                                                in purchase sales was offset by increased payment rates.
                                                           ** 2006 first quarter results include the impact from SFAS 123(R) charges and tax benefits from the resolution of a federal tax audit.
                                                                See Schedule A on page 8 of the 1Q06 earnings press release.


                                                                                                                                                                                               1Q 2006 vs.
                                                                                       1Q                   2Q                   3Q                  4Q                   1Q                 1Q 2005 Increase/
                                                                                      2005                 2005                 2005                2005                 2006                   (Decrease)
Total Revenues, Net of Interest Expense (1)                                      $         3,455      $         3,263      $        3,381      $         2,725      $         3,234                    (6%)

Total Operating Expenses                                                                   1,500                1,503               1,458                1,541                1,532                    2%

      Net Credit Losses                                                                      756                  640                  649                 692                  446                  (41%)

      Credit Reserve Build / (Release)                                                         -                    -                   30                 (200)                 (72)                   -

      Provision for Benefits & Claims                                                          -                    -                    -                   -                   21                     -

Provision for Loan Losses and for Benefits and Claims                                        756                  640                  679                 492                  395                  (48%)

Income Before Taxes and Minority Interest                                                  1,199                1,120               1,244                  692                1,307                    9%
Income Taxes and Minority Interest                                                           421                  385                 447                  248                  381                  (10%)

Net Income                                                                       $           778      $           735      $           797     $           444      $           926                    19%

Average Assets (in billions of dollars)                                          $            71      $            65      $            63     $            63      $            63                  (11%)
Return on Assets                                                                           4.44%                4.54%               5.02%                2.80%                5.96%

Net Credit Loss Ratio                                                                      5.77%                5.47%               5.76%                6.38%                4.27%

Average Risk Capital                                                             $         5,638      $         5,855      $        5,848      $         5,756      $         5,563                    (1%)

Return on Risk Capital                                                                       56%                  50%                  54%                 31%                  68%
Return on Invested Capital                                                                   23%                  21%                  22%                 13%                  28%


KEY INDICATORS - Managed Basis (2) (in billions of dollars)

Return on Managed Assets                                                                   2.12%                2.04%               2.20%                1.22%                2.59%

Average Managed Loans:
      Securitized                                                                $           86.4     $           87.7     $           89.8    $           92.8     $           94.7                   10%
      Held for Sale                                                                           0.2                  0.6                  -                   0.7                  0.3                   50%
      On Balance Sheet                                                                       53.1                 47.0                 44.7                43.0                 42.3                 (20%)
      Total Managed                                                              $         139.7      $         135.3      $        134.5      $         136.5      $         137.3                    (2%)


      Bankcards                                                                  $         114.4      $         110.4      $        109.2      $         109.6      $         110.4                    (3%)
      Private Label                                                                         25.3                 24.9                25.3                 26.9                 26.9                     6%
      Total Managed                                                              $         139.7      $         135.3      $        134.5      $         136.5      $         137.3                    (2%)


End of Period Managed Loans:
    Bankcards                                                                    $         111.9      $         110.2      $        109.1      $         113.7      $         109.7                    (2%)
    Private Label                                                                           24.7                 25.2                25.6                 27.9                 26.2                     6%
      Total                                                                      $         136.6      $         135.4      $        134.7      $         141.6      $         135.9                    (1%)


(1)   The 2005 first quarter, 2005 second quarter, 2005 third quarter, 2005 fourth quarter and 2006 first quarter include releases of $129 million, $102 million, $137 million, $186 million and $90 million, respectively,
      from the allowance for credit losses related to loan receivables that were securitized during the quarter.

(2)   Managed basis presentation includes results from both the on-balance sheet loans and off- balance sheet loans, and excludes the impact of card securitization activity.
      Managed disclosures assume that securitized loans have not been sold and present the results of the securitized loans in the same manner as the Company's owned loans.


                                                                                                                                                                                                                              Page 9
Reclassified to conform to the current period's presentation.
GLOBAL CONSUMER
      U.S.
      CARDS - Page 2
                                                                                                                                                                                                                      1Q 2006 vs.
      (In millions of dollars)
                                                                                                                      1Q                   2Q                   3Q                  4Q                1Q           1Q 2005 Increase/
                                                                                                                     2005                 2005                 2005                2005              2006             (Decrease)
SUPPLEMENTAL DISCLOSURE - Managed Basis (1):

      EOP Open Accounts (in millions)                                                                                     124.5                122.7                119.4             131.2             131.1             5%
      Purchase Sales (in billions of dollars) (2)                                                               $           61.7    $            69.8    $            70.9     $          75.8   $          68.4         11%

Managed Average Yield (3)                             Bankcards                                                          12.17%               12.42%               12.76%            12.43%            12.85%
                                                      Private Label                                                      19.99%               19.43%               19.24%            18.91%            19.55%
                                                      Total                                                              13.58%               13.71%               13.98%            13.71%            14.16%

Managed Net Interest Revenue                          Bankcards                                                 $         2,690     $          2,572     $          2,650      $      2,524      $      2,471            (8%)
(in millions of dollars) (4)                          Private Label                                                       1,111                1,048                1,088             1,124             1,076            (3%)
                                                      Total                                                     $         3,801     $          3,620     $          3,738      $      3,648      $      3,547            (7%)


Managed Net Interest Revenue as                       Bankcards                                                           9.54%                9.35%                9.64%             9.14%             9.09%
a % of Average Managed Loans                          Private Label                                                      17.81%               16.88%               17.06%            16.58%            16.22%
                                                      Total                                                              11.03%               10.74%               11.03%            10.60%            10.48%


Managed Net Credit Margin                             Bankcards                                                 $         1,888     $          1,798     $          1,881      $          823    $      2,146            14%
(in millions of dollars) (5)                          Private Label                                                         642                  635                  672                 652               617          (4%)
                                                      Total                                                     $         2,530     $          2,433     $          2,553      $      1,475      $      2,763             9%


Managed Net Credit Margin as                          Bankcards                                                           6.69%                6.54%                6.84%             2.98%             7.88%
a % of Average Managed Loans                          Private Label                                                      10.29%               10.23%               10.54%             9.62%             9.30%
                                                      Total                                                               7.34%                7.22%                7.54%             4.29%             8.16%


Managed Net Credit Losses                             Bankcards                                                 $         1,490     $          1,564     $          1,531      $      1,828      $          948          (36%)
(in millions of dollars)                              Private Label                                                         431                  392                  385                 470               373          (13%)
                                                      Total                                                     $         1,921     $          1,956     $          1,916      $      2,298      $      1,321            (31%)

Coincident Managed Net                                Bankcards                                                           5.28%                5.69%                5.57%             6.61%             3.49%
Credit Loss Ratio:                                    Private Label                                                       6.91%                6.31%                6.04%             6.93%             5.62%
                                                      Total                                                               5.58%                5.80%                5.66%             6.68%             3.90%
12 Month Lagged Managed
 Net Credit Loss Ratio                                                                                                    5.70%                5.84%                5.58%             6.50%             3.83%


Managed Loans 90+Days Past Due                        Bankcards                                                 $         1,716     $          1,580     $          1,579      $      1,553      $      1,536            (10%)
                                                      Private Label                                                         684                  672                  701               922               825             21%
                                                      Total                                                     $         2,400     $          2,252     $          2,280      $      2,475      $      2,361            (2%)

       % of EOP Managed Loans                         Bankcards                                                           1.53%                1.43%                1.45%             1.37%             1.40%
                                                      Private Label                                                       2.78%                2.67%                2.74%             3.30%             3.15%
                                                      Total                                                               1.76%                1.66%                1.69%             1.75%             1.74%

(1)   Managed basis presentation includes results from both the on-balance sheet loans and off- balance sheet loans, and excludes the impact of card securitization activity
      Managed disclosures assume that securitized loans have not been sold and present the results of the securitized loans in the same manner as the Company's owned loans

(2)   Purchase Sales represents customers' purchased sales plus cash advances.

(3)   Gross interest revenue earned divided by average managed loans.

(4)   Includes certain fees that are recorded as interest revenue.

(5)   Total Revenues, net of Interest Expense, less Net Credit Losses.                                         Reclassified to conform to the current period's presentation.


                                                                                                                                                                                                                                       Page 10
For your convenience, an excerpt from our 2006 first quarter earnings press release is set out below. The full text of the press release,
GLOBAL CONSUMER                                                 and those from prior periods, are available on Citigroup's website at www.citigroup.com.

U.S.                                                            **   Revenues and net income declined primarily due to the absence of a $114 million pre-tax gain in prior year quarter relating to the resolution
RETAIL DISTRIBUTION - Page 1                                         of litigation. Growth in deposits and loans, up 6% and 8%, respectively, and a 26% increase in investment product sales, were more than
(In millions of dollars)                                             offset by lower net interest margin. Lower net interest margin was driven in part by a shift in customer liabilities from demand deposits to
                                                                     certificates of deposit.
                                                                **   Expenses increased 13%, reflecting higher business volumes and investment in new branches, new product development and technology.
                                                                     During the quarter, 36 new branches were opened.
                                                                **   Credit costs declined 70 basis points to an NCL rate of 2.66%, reflecting lower bankruptcy filings.
                                                                **   2006 first quarter results include the impact from SFAS 123(R) charges and tax benefits from the resolution of a federal tax audit.
                                                                     See Schedule A on page 8 of the 1Q06 earnings press release.


                                                                                                                                                                                                                 1Q 2006 vs.
                                                                                                 1Q                  2Q                       3Q                    4Q                    1Q                   1Q 2005 Increase/
                                                                                                2005                2005                     2005                  2005                  2006                     (Decrease)

Total Revenues, Net of Interest Expense:

   Citibank Branches                                                                  $                 853    $            766        $             754      $             730    $            737                  (14%)
   Citifinancial Branches                                                                              1,053               1,054                   1,035                   1,048              1,008                  (4%)
   Primerica Financial Services                                                                         551                 540                      550                    581                 551                    -

   Total Revenues, Net of Interest Expense                                                             2,457               2,360                   2,339                   2,359              2,296                  (7%)
Total Operating Expenses                                                                               1,085               1,107                   1,099                   1,116              1,221                  13%

   Net Credit Losses                                                                                    326                 346                      314                    418                 279                  (14%)
   Credit Reserve Build / (Release)                                                                     (17)                 -                       275                     44                 (55)                  NM
   Provision for Benefits & Claims                                                                      182                 177                      170                    175                 163                  (10%)

Provision for Loan Losses and for Benefits and Claims                                                   491                 523                      759                    637                 387                  (21%)

Income Before Taxes                                                                                     881                 730                      481                    606                 688                  (22%)
Income Taxes                                                                                            317                 252                      162                    215                 173                  (45%)

Net Income                                                                            $                 564    $            478        $             319      $             391    $            515                  (9%)

Average Assets (in billions of dollars)                                               $                  63    $             64        $              65      $              65    $             66                   5%
Return on Assets                                                                                       3.63%               3.00%                   1.95%                   2.39%              3.16%

Average Risk Capital                                                                  $                2,940   $           2,983       $           3,003      $            2,982   $          3,459                  18%
Return on Risk Capital                                                                                  78%                 64%                      42%                    52%                 60%

Return on Invested Capital                                                                              20%                 18%                      13%                    15%                 23%


Net Income by Business:

   Citibank Branches                                                                  $                 185    $            114        $             111     $               96    $            100                  (46%)
   Citifinancial Branches                                                                               245                 228                       72                    151                 265                   8%
   Primerica Financial Services                                                                         134                 136                      136                    144                 150                  12%

       Total Net Income                                                               $                 564    $            478        $             319     $              391    $            515                  (9%)


NM Not meaningful

Reclassified to conform to the current period's presentation.

                                                                                                                                                                                                                                   Page 11
GLOBAL CONSUMER
U.S.
RETAIL DISTRIBUTION - Page 2
(In millions of dollars)
                                                                                                                                                                                         1Q 2006 vs.
                                                                                                 1Q                2Q                3Q                4Q                1Q           1Q 2005 Increase/
                                                                                                2005              2005              2005              2005              2006             (Decrease)

KEY INDICATORS:


Average Loans                                                Citibank Branches              $           8.2   $           8.5   $           8.8   $           9.1   $           9.4         15%
(in billions of dollars)                                     CitiFinancial Branches                    31.2              31.2              31.9              32.6              33.1          6%
                                                              Total                         $          39.4   $          39.7   $          40.7   $          41.7   $          42.5          8%


Average Loans by Product                                     Real estate secured loans      $          20.4   $          20.8   $          21.2   $          21.8   $          22.3          9%
(in billions of dollars)                                     Personal loans                            14.4              14.4              14.8              15.0              15.2          6%
                                                             Sales finance and other                    4.6               4.5               4.7               4.9               5.0          9%
                                                              Total                         $          39.4   $          39.7   $          40.7   $          41.7   $          42.5          8%


Net Interest Revenue                                         Citibank Branches              $          513    $          523    $          509    $          512    $          501          (2%)
(in millions of dollars)                                     CitiFinancial Branches                    918               918               919               903               891          (3%)
                                                             Primerica Financial Services               58                55                60                69                59           2%
                                                              Total                         $      1,489      $      1,496      $      1,488      $      1,484      $      1,451            (3%)


Net Credit Loss Ratio                                                                              3.36%             3.50%             3.06%             3.98%             2.66%

Loans 90+ Days Past Due (in millions of dollars)                                            $          782    $          723    $          787    $          818    $          740          (5%)
   % of EOP Loans                                                                                  1.98%             1.79%             1.91%             1.94%             1.73%


Number of Branches:                                          Citibank                                  883               885               884               896               906           3%
                                                             CitiFinancial                         2,273             2,273             2,274             2,277             2,299             1%
                                                              Total                                3,156             3,158             3,158             3,173             3,205             2%


Total EOP Accounts (in millions)                             Citibank Branches                         10.3              10.4              10.5              10.5              10.7          4%
                                                             CitiFinancial Branches                     5.3               5.3               5.4               5.5               5.3           -
                                                             Primerica Financial Services               4.8               4.8               4.9               4.8               4.9          2%
                                                              Total                                    20.4              20.5              20.8              20.8              20.9          2%


Citibank Branches - Average Balances ( in billions of dollars)
   Checking, Savings & Money Market Deposits                                                $          65.6   $          66.4   $          65.1   $          63.6   $          64.1         (2%)
   Time Deposits, CDs and Other                                                                        10.9              12.6              13.2              14.5              16.2         49%
    Total Branch Deposits                                                                              76.5              79.0              78.3              78.1              80.3          5%
   Smith Barney Bank Deposit Program                                                                   42.3              41.4              41.3              42.2              45.3          7%

     Total Deposits                                                                         $      118.8      $      120.4      $      119.6      $      120.3      $      125.6             6%

   Checking Accounts (in millions )                                                                     3.5               3.5               3.5               3.5               3.6          3%

   EOP Investment AUMs (in billions of dollars)                                             $          39.8   $          40.7   $          41.6   $          42.5   $          43.8         10%

   Total Investment Product Sales (in billions of dollars)                                  $           3.1   $           3.0   $           3.2   $           3.0   $           3.9         26%

Primerica Financial Services:
   Life Insurance in Force (in billions of dollars)                                         $      553.1      $      562.7      $       572.4     $       581.3     $       583.9            6%
   Loan Volumes (in millions of dollars)                                                    $      972.8      $      963.6      $     1,099.9     $     1,381.4     $     1,087.0           12%
   Mutual Fund Sales at NAV (in millions of dollars)                                        $        903      $        865      $         798     $         791     $         971            8%
   Variable Annuity Net Written Premiums & Deposits (in millions of dollars)                $        328      $        271      $         283     $         302     $         388           18%
   Investment AUMs (EOP) (in billions of dollars)                                           $       27.5      $       28.0      $        29.3     $        30.1     $        31.2           13%


Reclassified to conform to the current period's presentation.
                                                                                                                                                                                                          Page 12
For your convenience, an excerpt from our 2006 first quarter earnings press release is set out below. The full text of the press release,
GLOBAL CONSUMER                                                 and those from prior periods, are available on Citigroup's website at www.citigroup.com.

U.S.                                                            **   Revenues declined as 18% growth in average loans was offset by net interest margin compression across all loan portfolios. The revenue
CONSUMER LENDING - Page 1                                            decrease also reflected lower net mortgage servicing revenues and lower gains on the sale of real estate loans.
(In millions of dollars)                                        **   Expenses increased 10% due to increased business volumes. Credit conditions remained favorable, leading to a decline in net credit loss ratios.
                                                                **   2006 first quarter results include the impact from SFAS 123(R) charges and tax benefits from the resolution of a federal tax audit.
                                                                     See Schedule A on page 8 of the 1Q06 earnings press release.

                                                                                                                                                                                                               1Q 2006 vs.
                                                                                                1Q                     2Q                    3Q                  4Q                      1Q                 1Q 2005 Increase/
                                                                                               2005                   2005                  2005                2005                    2006                   (Decrease)

Total Revenues, Net of Interest Expense:
    Real Estate Lending                                                                  $            924       $             888     $            836     $           910        $            843                 (9%)
    Student Loans                                                                                     132                     176                  173                 171                     117                (11%)
    Auto                                                                                              317                     312                  323                 307                     300                 (5%)

  Total Revenues, Net of Interest Expense                                                           1,373                   1,376                1,332               1,388                   1,260                (8%)

Total Operating Expenses                                                                              411                     413                  425                 451                     453                10%

     Net Credit Losses                                                                                181                     146                  168                 178                     176                (3%)
     Credit Reserve Build / (Release)                                                                  (1)                      1                  (56)                 (8)                    (31)                NM
     Provision for Benefits & Claims                                                                    2                       1                    2                  -                       (2)                NM

Provision for Loan Losses and for Benefits and Claims                                                 182                     148                  114                 170                     143                (21%)

Income Before Taxes and Minority Interest                                                             780                     815                  793                 767                     664                (15%)

Income Taxes                                                                                          281                     292                  289                 293                     218                (22%)
Minority Interest, Net of Tax                                                                          13                      16                   17                  16                       9                (31%)

Net Income                                                                               $            486        $            507     $            487     $           458        $            437                (10%)


Average Assets (in billions of dollars)                                                  $            178        $            186     $            192     $           201        $            209                17%
Return on Assets                                                                                    1.11%                   1.09%                1.01%               0.90%                   0.85%

Average Risk Capital                                                                     $          3,291        $          3,341     $          3,218     $         3,270        $          3,732                13%
Return on Risk Capital                                                                                60%                     61%                  60%                 56%                     47%

Return on Invested Capital                                                                            38%                     32%                  31%                 29%                     27%


Net Income by Business:

     Real Estate Lending                                                                 $            363       $             356     $            318     $           341        $            328                (10%)
     Student Loans                                                                                      52                     62                   62                   58                     38                (27%)
     Auto                                                                                               71                     89                  107                   59                     71                  -

         Total Net Income                                                                $            486       $             507     $            487     $           458        $            437                (10%)


NM Not meaningful

Reclassified to conform to the current period's presentation.

                                                                                                                                                                                                                                Page 13
citigroup April 17, 2006 - First Quarter Financial Supplement

Weitere ähnliche Inhalte

Was ist angesagt?

citi group January 21, 2003 - Fourth Quarter Press Release
citi group January 21, 2003 - Fourth Quarter Press Releaseciti group January 21, 2003 - Fourth Quarter Press Release
citi group January 21, 2003 - Fourth Quarter Press ReleaseQuarterlyEarningsReports
 
citigroup October 16, 2008 - Third Quarter Press Release
citigroup October 16, 2008 - Third Quarter Press Releasecitigroup October 16, 2008 - Third Quarter Press Release
citigroup October 16, 2008 - Third Quarter Press ReleaseQuarterlyEarningsReports
 
citigroup April 16, 2007 - First Quarter Press Release
citigroup April 16, 2007 - First Quarter Press Releasecitigroup April 16, 2007 - First Quarter Press Release
citigroup April 16, 2007 - First Quarter Press ReleaseQuarterlyEarningsReports
 
citigroup July 14, 2003 - Second Quarter Financial Supplement
citigroup July 14, 2003 - Second Quarter Financial Supplementcitigroup July 14, 2003 - Second Quarter Financial Supplement
citigroup July 14, 2003 - Second Quarter Financial SupplementQuarterlyEarningsReports
 
citi July 16, 2001 - Second Quarter Financial Supplement
citi July 16, 2001 - Second Quarter Financial Supplementciti July 16, 2001 - Second Quarter Financial Supplement
citi July 16, 2001 - Second Quarter Financial SupplementQuarterlyEarningsReports
 
Paccar 03 AR
Paccar 03 ARPaccar 03 AR
Paccar 03 ARfinance17
 
citigroup July 18, 2005 - Second Quarter Press Release
citigroup July 18, 2005 - Second Quarter Press Releasecitigroup July 18, 2005 - Second Quarter Press Release
citigroup July 18, 2005 - Second Quarter Press ReleaseQuarterlyEarningsReports
 
Albemarle Corporation Earnings Q4 2008 presentation
 Albemarle Corporation Earnings Q4 2008 presentation Albemarle Corporation Earnings Q4 2008 presentation
Albemarle Corporation Earnings Q4 2008 presentationearningsreport
 
unum group _10/17/05
unum group _10/17/05unum group _10/17/05
unum group _10/17/05finance26
 
PACCAR 02 paccarannual report
PACCAR 02 paccarannual reportPACCAR 02 paccarannual report
PACCAR 02 paccarannual reportfinance17
 
lincoln national lncstat1q08_rev
lincoln national lncstat1q08_revlincoln national lncstat1q08_rev
lincoln national lncstat1q08_revfinance25
 
Citigrioup 3 q 2011
Citigrioup 3 q 2011Citigrioup 3 q 2011
Citigrioup 3 q 2011Frank Ragol
 

Was ist angesagt? (17)

citigroup Financial Supplement
citigroup Financial Supplementcitigroup Financial Supplement
citigroup Financial Supplement
 
citigroup Qer084s
citigroup Qer084scitigroup Qer084s
citigroup Qer084s
 
citi group January 21, 2003 - Fourth Quarter Press Release
citi group January 21, 2003 - Fourth Quarter Press Releaseciti group January 21, 2003 - Fourth Quarter Press Release
citi group January 21, 2003 - Fourth Quarter Press Release
 
citigroup October 16, 2008 - Third Quarter Press Release
citigroup October 16, 2008 - Third Quarter Press Releasecitigroup October 16, 2008 - Third Quarter Press Release
citigroup October 16, 2008 - Third Quarter Press Release
 
citigroup April 16, 2007 - First Quarter Press Release
citigroup April 16, 2007 - First Quarter Press Releasecitigroup April 16, 2007 - First Quarter Press Release
citigroup April 16, 2007 - First Quarter Press Release
 
citigroup July 14, 2003 - Second Quarter Financial Supplement
citigroup July 14, 2003 - Second Quarter Financial Supplementcitigroup July 14, 2003 - Second Quarter Financial Supplement
citigroup July 14, 2003 - Second Quarter Financial Supplement
 
citigroup Qer084s
citigroup Qer084scitigroup Qer084s
citigroup Qer084s
 
citigroup Financial Supplement
citigroup Financial Supplementcitigroup Financial Supplement
citigroup Financial Supplement
 
citi July 16, 2001 - Second Quarter Financial Supplement
citi July 16, 2001 - Second Quarter Financial Supplementciti July 16, 2001 - Second Quarter Financial Supplement
citi July 16, 2001 - Second Quarter Financial Supplement
 
citigroup April 18, 2008 - First Quarter
citigroup April 18, 2008 - First Quartercitigroup April 18, 2008 - First Quarter
citigroup April 18, 2008 - First Quarter
 
Paccar 03 AR
Paccar 03 ARPaccar 03 AR
Paccar 03 AR
 
citigroup July 18, 2005 - Second Quarter Press Release
citigroup July 18, 2005 - Second Quarter Press Releasecitigroup July 18, 2005 - Second Quarter Press Release
citigroup July 18, 2005 - Second Quarter Press Release
 
Albemarle Corporation Earnings Q4 2008 presentation
 Albemarle Corporation Earnings Q4 2008 presentation Albemarle Corporation Earnings Q4 2008 presentation
Albemarle Corporation Earnings Q4 2008 presentation
 
unum group _10/17/05
unum group _10/17/05unum group _10/17/05
unum group _10/17/05
 
PACCAR 02 paccarannual report
PACCAR 02 paccarannual reportPACCAR 02 paccarannual report
PACCAR 02 paccarannual report
 
lincoln national lncstat1q08_rev
lincoln national lncstat1q08_revlincoln national lncstat1q08_rev
lincoln national lncstat1q08_rev
 
Citigrioup 3 q 2011
Citigrioup 3 q 2011Citigrioup 3 q 2011
Citigrioup 3 q 2011
 

Andere mochten auch

Andere mochten auch (6)

2006 Q4 Google Earnings Slides
2006 Q4 Google Earnings Slides2006 Q4 Google Earnings Slides
2006 Q4 Google Earnings Slides
 
citigroup January 20, 2006 - Fourth Quarter Financial Supplement
citigroup January 20, 2006 - Fourth Quarter Financial Supplementcitigroup January 20, 2006 - Fourth Quarter Financial Supplement
citigroup January 20, 2006 - Fourth Quarter Financial Supplement
 
citigroup October 15, 2007 - Third Quarter Press Release
citigroup  October 15, 2007 - Third Quarter Press Releasecitigroup  October 15, 2007 - Third Quarter Press Release
citigroup October 15, 2007 - Third Quarter Press Release
 
20050630 Google 10 Q
20050630 Google 10 Q20050630 Google 10 Q
20050630 Google 10 Q
 
E Bay Earnings Release Q22007 Final
E Bay Earnings Release Q22007 FinalE Bay Earnings Release Q22007 Final
E Bay Earnings Release Q22007 Final
 
Q3 06 Earnings Release Final
Q3 06 Earnings Release FinalQ3 06 Earnings Release Final
Q3 06 Earnings Release Final
 

Ähnlich wie citigroup April 17, 2006 - First Quarter Financial Supplement

citigroup October 20, 2003 - Third Quarter Financial Supplement
citigroup October 20, 2003 - Third Quarter Financial Supplementcitigroup October 20, 2003 - Third Quarter Financial Supplement
citigroup October 20, 2003 - Third Quarter Financial SupplementQuarterlyEarningsReports
 
citigroup January 20, 2004 - Fourth Quarter Financial Supplement
citigroup January 20, 2004 - Fourth Quarter Financial Supplementcitigroup January 20, 2004 - Fourth Quarter Financial Supplement
citigroup January 20, 2004 - Fourth Quarter Financial SupplementQuarterlyEarningsReports
 
citigroup Financial Supplement July 18, 2008 - Second Quarter
citigroup Financial Supplement July 18, 2008 - Second Quartercitigroup Financial Supplement July 18, 2008 - Second Quarter
citigroup Financial Supplement July 18, 2008 - Second QuarterQuarterlyEarningsReports
 
citigroup April 17, 2006 - First Quarter Press Release
citigroup April 17, 2006 - First Quarter Press Releasecitigroup April 17, 2006 - First Quarter Press Release
citigroup April 17, 2006 - First Quarter Press ReleaseQuarterlyEarningsReports
 
unum group _10/17/05
unum group _10/17/05unum group _10/17/05
unum group _10/17/05finance26
 
citigroup April 17, 2000 - First Quarter Financial Supplement
citigroup April 17, 2000 - First Quarter Financial Supplementcitigroup April 17, 2000 - First Quarter Financial Supplement
citigroup April 17, 2000 - First Quarter Financial SupplementQuarterlyEarningsReports
 
citigroup April 16, 2001 - First Quarter Financial Supplement
citigroup April 16, 2001 - First Quarter  Financial Supplementcitigroup April 16, 2001 - First Quarter  Financial Supplement
citigroup April 16, 2001 - First Quarter Financial SupplementQuarterlyEarningsReports
 
citigroup July 19, 2000 - Second Quarter Financial Supplement
citigroup July 19, 2000 - Second Quarter Financial Supplementcitigroup July 19, 2000 - Second Quarter Financial Supplement
citigroup July 19, 2000 - Second Quarter Financial SupplementQuarterlyEarningsReports
 
citigroup April 15, 2005 - First Quarter Press Release
citigroup April 15, 2005 - First Quarter Press Releasecitigroup April 15, 2005 - First Quarter Press Release
citigroup April 15, 2005 - First Quarter Press ReleaseQuarterlyEarningsReports
 
ciitigroup January 20, 2004 - Fourth Quarter
ciitigroup January 20, 2004 - Fourth Quarterciitigroup January 20, 2004 - Fourth Quarter
ciitigroup January 20, 2004 - Fourth QuarterQuarterlyEarningsReports
 
unum group 4Q 08_Statistical_Supplement
unum group   4Q 08_Statistical_Supplementunum group   4Q 08_Statistical_Supplement
unum group 4Q 08_Statistical_Supplementfinance26
 
citigroup January 17, 2002 - Fourth Quarter Financial Supplement
citigroup January 17, 2002 - Fourth Quarter  Financial Supplementcitigroup January 17, 2002 - Fourth Quarter  Financial Supplement
citigroup January 17, 2002 - Fourth Quarter Financial SupplementQuarterlyEarningsReports
 
unum group 2Q 06_Statistical_Supplement
unum group  2Q 06_Statistical_Supplementunum group  2Q 06_Statistical_Supplement
unum group 2Q 06_Statistical_Supplementfinance26
 
unum group Q1 06
unum group  Q1 06unum group  Q1 06
unum group Q1 06finance26
 
citigroup January 16, 2001 - Fourth Quarter Financial Supplement
citigroup January 16, 2001 - Fourth Quarter Financial Supplementcitigroup January 16, 2001 - Fourth Quarter Financial Supplement
citigroup January 16, 2001 - Fourth Quarter Financial SupplementQuarterlyEarningsReports
 

Ähnlich wie citigroup April 17, 2006 - First Quarter Financial Supplement (20)

citigroup July 20, 2007 - Second Quarter
citigroup July 20, 2007 - Second Quartercitigroup July 20, 2007 - Second Quarter
citigroup July 20, 2007 - Second Quarter
 
citigroup October 20, 2003 - Third Quarter Financial Supplement
citigroup October 20, 2003 - Third Quarter Financial Supplementcitigroup October 20, 2003 - Third Quarter Financial Supplement
citigroup October 20, 2003 - Third Quarter Financial Supplement
 
citigroup January 20, 2004 - Fourth Quarter Financial Supplement
citigroup January 20, 2004 - Fourth Quarter Financial Supplementcitigroup January 20, 2004 - Fourth Quarter Financial Supplement
citigroup January 20, 2004 - Fourth Quarter Financial Supplement
 
citigroup Financial Supplement July 18, 2008 - Second Quarter
citigroup Financial Supplement July 18, 2008 - Second Quartercitigroup Financial Supplement July 18, 2008 - Second Quarter
citigroup Financial Supplement July 18, 2008 - Second Quarter
 
citigroup April 17, 2006 - First Quarter Press Release
citigroup April 17, 2006 - First Quarter Press Releasecitigroup April 17, 2006 - First Quarter Press Release
citigroup April 17, 2006 - First Quarter Press Release
 
citigroup Financial Supplement
citigroup Financial Supplementcitigroup Financial Supplement
citigroup Financial Supplement
 
unum group _10/17/05
unum group _10/17/05unum group _10/17/05
unum group _10/17/05
 
citigroup April 17, 2000 - First Quarter Financial Supplement
citigroup April 17, 2000 - First Quarter Financial Supplementcitigroup April 17, 2000 - First Quarter Financial Supplement
citigroup April 17, 2000 - First Quarter Financial Supplement
 
citigroup April 16, 2001 - First Quarter Financial Supplement
citigroup April 16, 2001 - First Quarter  Financial Supplementcitigroup April 16, 2001 - First Quarter  Financial Supplement
citigroup April 16, 2001 - First Quarter Financial Supplement
 
citigroup July 19, 2000 - Second Quarter Financial Supplement
citigroup July 19, 2000 - Second Quarter Financial Supplementcitigroup July 19, 2000 - Second Quarter Financial Supplement
citigroup July 19, 2000 - Second Quarter Financial Supplement
 
citigroup Financial Supplement
citigroup Financial Supplementcitigroup Financial Supplement
citigroup Financial Supplement
 
First Quarter 2005 Earnings Presentation
	First Quarter 2005 Earnings Presentation	First Quarter 2005 Earnings Presentation
First Quarter 2005 Earnings Presentation
 
citigroup April 15, 2005 - First Quarter Press Release
citigroup April 15, 2005 - First Quarter Press Releasecitigroup April 15, 2005 - First Quarter Press Release
citigroup April 15, 2005 - First Quarter Press Release
 
ciitigroup January 20, 2004 - Fourth Quarter
ciitigroup January 20, 2004 - Fourth Quarterciitigroup January 20, 2004 - Fourth Quarter
ciitigroup January 20, 2004 - Fourth Quarter
 
unum group 4Q 08_Statistical_Supplement
unum group   4Q 08_Statistical_Supplementunum group   4Q 08_Statistical_Supplement
unum group 4Q 08_Statistical_Supplement
 
standardchartered Final Results 2004
standardchartered  	Final Results 2004standardchartered  	Final Results 2004
standardchartered Final Results 2004
 
citigroup January 17, 2002 - Fourth Quarter Financial Supplement
citigroup January 17, 2002 - Fourth Quarter  Financial Supplementcitigroup January 17, 2002 - Fourth Quarter  Financial Supplement
citigroup January 17, 2002 - Fourth Quarter Financial Supplement
 
unum group 2Q 06_Statistical_Supplement
unum group  2Q 06_Statistical_Supplementunum group  2Q 06_Statistical_Supplement
unum group 2Q 06_Statistical_Supplement
 
unum group Q1 06
unum group  Q1 06unum group  Q1 06
unum group Q1 06
 
citigroup January 16, 2001 - Fourth Quarter Financial Supplement
citigroup January 16, 2001 - Fourth Quarter Financial Supplementcitigroup January 16, 2001 - Fourth Quarter Financial Supplement
citigroup January 16, 2001 - Fourth Quarter Financial Supplement
 

Mehr von QuarterlyEarningsReports

citigroup April 17, 2000 - First Quarter Press Release
citigroup April 17, 2000 - First Quarter Press Releasecitigroup April 17, 2000 - First Quarter Press Release
citigroup April 17, 2000 - First Quarter Press ReleaseQuarterlyEarningsReports
 
citigroup July 19, 2000 - Second Quarter Press Release
citigroup  July 19, 2000 - Second Quarter Press Releasecitigroup  July 19, 2000 - Second Quarter Press Release
citigroup July 19, 2000 - Second Quarter Press ReleaseQuarterlyEarningsReports
 
citigroup October 17, 2000 - Third Quarter Press Release
citigroup October 17, 2000 - Third Quarter Press Releasecitigroup October 17, 2000 - Third Quarter Press Release
citigroup October 17, 2000 - Third Quarter Press ReleaseQuarterlyEarningsReports
 
citigroup January 16, 2001 - Fourth Quarter Press Release
citigroup January 16, 2001 - Fourth Quarter Press Releasecitigroup January 16, 2001 - Fourth Quarter Press Release
citigroup January 16, 2001 - Fourth Quarter Press ReleaseQuarterlyEarningsReports
 
citigroup April 16, 2001 - First Quarter Press Release
citigroup April 16, 2001 - First Quarter Press Releasecitigroup April 16, 2001 - First Quarter Press Release
citigroup April 16, 2001 - First Quarter Press ReleaseQuarterlyEarningsReports
 
citigroup July 16, 2001 - Second Quarter Press Release
citigroup July 16, 2001 - Second Quarter Press Releasecitigroup July 16, 2001 - Second Quarter Press Release
citigroup July 16, 2001 - Second Quarter Press ReleaseQuarterlyEarningsReports
 
citigroup October 17, 2001 - Third Quarter Financial Supplement
citigroup October 17, 2001 - Third Quarter  Financial Supplementcitigroup October 17, 2001 - Third Quarter  Financial Supplement
citigroup October 17, 2001 - Third Quarter Financial SupplementQuarterlyEarningsReports
 
citigroup October 17, 2001 - Third Quarter Press Release
citigroup October 17, 2001 - Third Quarter Press Releasecitigroup October 17, 2001 - Third Quarter Press Release
citigroup October 17, 2001 - Third Quarter Press ReleaseQuarterlyEarningsReports
 
citigroup April 15, 2002 - First Quarter Press Release
citigroup April 15, 2002 - First Quarter Press Releasecitigroup April 15, 2002 - First Quarter Press Release
citigroup April 15, 2002 - First Quarter Press ReleaseQuarterlyEarningsReports
 
citigroup Financial Supplement July 2, 2008
citigroup Financial Supplement July 2, 2008citigroup Financial Supplement July 2, 2008
citigroup Financial Supplement July 2, 2008QuarterlyEarningsReports
 
citigroup October 15, 2002 - Third Quarter Press Release
citigroup October 15, 2002 - Third Quarter Press Releasecitigroup October 15, 2002 - Third Quarter Press Release
citigroup October 15, 2002 - Third Quarter Press ReleaseQuarterlyEarningsReports
 
citigroup Financial Supplement April 18, 2008 - First Quarter
citigroup  Financial Supplement April 18, 2008 - First Quartercitigroup  Financial Supplement April 18, 2008 - First Quarter
citigroup Financial Supplement April 18, 2008 - First QuarterQuarterlyEarningsReports
 
citigroup April 14, 2003 - First Quarter Financial Supplement
citigroup April 14, 2003 - First Quarter Financial Supplementcitigroup April 14, 2003 - First Quarter Financial Supplement
citigroup April 14, 2003 - First Quarter Financial SupplementQuarterlyEarningsReports
 

Mehr von QuarterlyEarningsReports (16)

citigroup April 17, 2000 - First Quarter Press Release
citigroup April 17, 2000 - First Quarter Press Releasecitigroup April 17, 2000 - First Quarter Press Release
citigroup April 17, 2000 - First Quarter Press Release
 
citigroup July 19, 2000 - Second Quarter Press Release
citigroup  July 19, 2000 - Second Quarter Press Releasecitigroup  July 19, 2000 - Second Quarter Press Release
citigroup July 19, 2000 - Second Quarter Press Release
 
citigroup Financial Supplement
citigroup Financial Supplementcitigroup Financial Supplement
citigroup Financial Supplement
 
citigroup Financial Supplement
citigroup Financial Supplementcitigroup Financial Supplement
citigroup Financial Supplement
 
citigroup October 17, 2000 - Third Quarter Press Release
citigroup October 17, 2000 - Third Quarter Press Releasecitigroup October 17, 2000 - Third Quarter Press Release
citigroup October 17, 2000 - Third Quarter Press Release
 
citigroup January 16, 2001 - Fourth Quarter Press Release
citigroup January 16, 2001 - Fourth Quarter Press Releasecitigroup January 16, 2001 - Fourth Quarter Press Release
citigroup January 16, 2001 - Fourth Quarter Press Release
 
citigroup April 16, 2001 - First Quarter Press Release
citigroup April 16, 2001 - First Quarter Press Releasecitigroup April 16, 2001 - First Quarter Press Release
citigroup April 16, 2001 - First Quarter Press Release
 
citigroup July 16, 2001 - Second Quarter Press Release
citigroup July 16, 2001 - Second Quarter Press Releasecitigroup July 16, 2001 - Second Quarter Press Release
citigroup July 16, 2001 - Second Quarter Press Release
 
citigroupFinancial Supplement
citigroupFinancial SupplementcitigroupFinancial Supplement
citigroupFinancial Supplement
 
citigroup October 17, 2001 - Third Quarter Financial Supplement
citigroup October 17, 2001 - Third Quarter  Financial Supplementcitigroup October 17, 2001 - Third Quarter  Financial Supplement
citigroup October 17, 2001 - Third Quarter Financial Supplement
 
citigroup October 17, 2001 - Third Quarter Press Release
citigroup October 17, 2001 - Third Quarter Press Releasecitigroup October 17, 2001 - Third Quarter Press Release
citigroup October 17, 2001 - Third Quarter Press Release
 
citigroup April 15, 2002 - First Quarter Press Release
citigroup April 15, 2002 - First Quarter Press Releasecitigroup April 15, 2002 - First Quarter Press Release
citigroup April 15, 2002 - First Quarter Press Release
 
citigroup Financial Supplement July 2, 2008
citigroup Financial Supplement July 2, 2008citigroup Financial Supplement July 2, 2008
citigroup Financial Supplement July 2, 2008
 
citigroup October 15, 2002 - Third Quarter Press Release
citigroup October 15, 2002 - Third Quarter Press Releasecitigroup October 15, 2002 - Third Quarter Press Release
citigroup October 15, 2002 - Third Quarter Press Release
 
citigroup Financial Supplement April 18, 2008 - First Quarter
citigroup  Financial Supplement April 18, 2008 - First Quartercitigroup  Financial Supplement April 18, 2008 - First Quarter
citigroup Financial Supplement April 18, 2008 - First Quarter
 
citigroup April 14, 2003 - First Quarter Financial Supplement
citigroup April 14, 2003 - First Quarter Financial Supplementcitigroup April 14, 2003 - First Quarter Financial Supplement
citigroup April 14, 2003 - First Quarter Financial Supplement
 

Kürzlich hochgeladen

The Economic History of the U.S. Lecture 23.pdf
The Economic History of the U.S. Lecture 23.pdfThe Economic History of the U.S. Lecture 23.pdf
The Economic History of the U.S. Lecture 23.pdfGale Pooley
 
Solution Manual for Principles of Corporate Finance 14th Edition by Richard B...
Solution Manual for Principles of Corporate Finance 14th Edition by Richard B...Solution Manual for Principles of Corporate Finance 14th Edition by Richard B...
Solution Manual for Principles of Corporate Finance 14th Edition by Richard B...ssifa0344
 
CALL ON ➥8923113531 🔝Call Girls Gomti Nagar Lucknow best sexual service
CALL ON ➥8923113531 🔝Call Girls Gomti Nagar Lucknow best sexual serviceCALL ON ➥8923113531 🔝Call Girls Gomti Nagar Lucknow best sexual service
CALL ON ➥8923113531 🔝Call Girls Gomti Nagar Lucknow best sexual serviceanilsa9823
 
Booking open Available Pune Call Girls Shivane 6297143586 Call Hot Indian Gi...
Booking open Available Pune Call Girls Shivane  6297143586 Call Hot Indian Gi...Booking open Available Pune Call Girls Shivane  6297143586 Call Hot Indian Gi...
Booking open Available Pune Call Girls Shivane 6297143586 Call Hot Indian Gi...Call Girls in Nagpur High Profile
 
Booking open Available Pune Call Girls Talegaon Dabhade 6297143586 Call Hot ...
Booking open Available Pune Call Girls Talegaon Dabhade  6297143586 Call Hot ...Booking open Available Pune Call Girls Talegaon Dabhade  6297143586 Call Hot ...
Booking open Available Pune Call Girls Talegaon Dabhade 6297143586 Call Hot ...Call Girls in Nagpur High Profile
 
Best VIP Call Girls Noida Sector 18 Call Me: 8448380779
Best VIP Call Girls Noida Sector 18 Call Me: 8448380779Best VIP Call Girls Noida Sector 18 Call Me: 8448380779
Best VIP Call Girls Noida Sector 18 Call Me: 8448380779Delhi Call girls
 
The Economic History of the U.S. Lecture 30.pdf
The Economic History of the U.S. Lecture 30.pdfThe Economic History of the U.S. Lecture 30.pdf
The Economic History of the U.S. Lecture 30.pdfGale Pooley
 
The Economic History of the U.S. Lecture 17.pdf
The Economic History of the U.S. Lecture 17.pdfThe Economic History of the U.S. Lecture 17.pdf
The Economic History of the U.S. Lecture 17.pdfGale Pooley
 
WhatsApp 📞 Call : 9892124323 ✅Call Girls In Chembur ( Mumbai ) secure service
WhatsApp 📞 Call : 9892124323  ✅Call Girls In Chembur ( Mumbai ) secure serviceWhatsApp 📞 Call : 9892124323  ✅Call Girls In Chembur ( Mumbai ) secure service
WhatsApp 📞 Call : 9892124323 ✅Call Girls In Chembur ( Mumbai ) secure servicePooja Nehwal
 
The Economic History of the U.S. Lecture 22.pdf
The Economic History of the U.S. Lecture 22.pdfThe Economic History of the U.S. Lecture 22.pdf
The Economic History of the U.S. Lecture 22.pdfGale Pooley
 
Call Girls Koregaon Park Call Me 7737669865 Budget Friendly No Advance Booking
Call Girls Koregaon Park Call Me 7737669865 Budget Friendly No Advance BookingCall Girls Koregaon Park Call Me 7737669865 Budget Friendly No Advance Booking
Call Girls Koregaon Park Call Me 7737669865 Budget Friendly No Advance Bookingroncy bisnoi
 
03_Emmanuel Ndiaye_Degroof Petercam.pptx
03_Emmanuel Ndiaye_Degroof Petercam.pptx03_Emmanuel Ndiaye_Degroof Petercam.pptx
03_Emmanuel Ndiaye_Degroof Petercam.pptxFinTech Belgium
 
The Economic History of the U.S. Lecture 20.pdf
The Economic History of the U.S. Lecture 20.pdfThe Economic History of the U.S. Lecture 20.pdf
The Economic History of the U.S. Lecture 20.pdfGale Pooley
 
High Class Call Girls Nagpur Grishma Call 7001035870 Meet With Nagpur Escorts
High Class Call Girls Nagpur Grishma Call 7001035870 Meet With Nagpur EscortsHigh Class Call Girls Nagpur Grishma Call 7001035870 Meet With Nagpur Escorts
High Class Call Girls Nagpur Grishma Call 7001035870 Meet With Nagpur Escortsranjana rawat
 
Log your LOA pain with Pension Lab's brilliant campaign
Log your LOA pain with Pension Lab's brilliant campaignLog your LOA pain with Pension Lab's brilliant campaign
Log your LOA pain with Pension Lab's brilliant campaignHenry Tapper
 
Indore Real Estate Market Trends Report.pdf
Indore Real Estate Market Trends Report.pdfIndore Real Estate Market Trends Report.pdf
Indore Real Estate Market Trends Report.pdfSaviRakhecha1
 
Basic concepts related to Financial modelling
Basic concepts related to Financial modellingBasic concepts related to Financial modelling
Basic concepts related to Financial modellingbaijup5
 

Kürzlich hochgeladen (20)

The Economic History of the U.S. Lecture 23.pdf
The Economic History of the U.S. Lecture 23.pdfThe Economic History of the U.S. Lecture 23.pdf
The Economic History of the U.S. Lecture 23.pdf
 
Solution Manual for Principles of Corporate Finance 14th Edition by Richard B...
Solution Manual for Principles of Corporate Finance 14th Edition by Richard B...Solution Manual for Principles of Corporate Finance 14th Edition by Richard B...
Solution Manual for Principles of Corporate Finance 14th Edition by Richard B...
 
CALL ON ➥8923113531 🔝Call Girls Gomti Nagar Lucknow best sexual service
CALL ON ➥8923113531 🔝Call Girls Gomti Nagar Lucknow best sexual serviceCALL ON ➥8923113531 🔝Call Girls Gomti Nagar Lucknow best sexual service
CALL ON ➥8923113531 🔝Call Girls Gomti Nagar Lucknow best sexual service
 
Booking open Available Pune Call Girls Shivane 6297143586 Call Hot Indian Gi...
Booking open Available Pune Call Girls Shivane  6297143586 Call Hot Indian Gi...Booking open Available Pune Call Girls Shivane  6297143586 Call Hot Indian Gi...
Booking open Available Pune Call Girls Shivane 6297143586 Call Hot Indian Gi...
 
VIP Call Girl in Mira Road 💧 9920725232 ( Call Me ) Get A New Crush Everyday ...
VIP Call Girl in Mira Road 💧 9920725232 ( Call Me ) Get A New Crush Everyday ...VIP Call Girl in Mira Road 💧 9920725232 ( Call Me ) Get A New Crush Everyday ...
VIP Call Girl in Mira Road 💧 9920725232 ( Call Me ) Get A New Crush Everyday ...
 
Booking open Available Pune Call Girls Talegaon Dabhade 6297143586 Call Hot ...
Booking open Available Pune Call Girls Talegaon Dabhade  6297143586 Call Hot ...Booking open Available Pune Call Girls Talegaon Dabhade  6297143586 Call Hot ...
Booking open Available Pune Call Girls Talegaon Dabhade 6297143586 Call Hot ...
 
Best VIP Call Girls Noida Sector 18 Call Me: 8448380779
Best VIP Call Girls Noida Sector 18 Call Me: 8448380779Best VIP Call Girls Noida Sector 18 Call Me: 8448380779
Best VIP Call Girls Noida Sector 18 Call Me: 8448380779
 
VIP Call Girl Service Andheri West ⚡ 9920725232 What It Takes To Be The Best ...
VIP Call Girl Service Andheri West ⚡ 9920725232 What It Takes To Be The Best ...VIP Call Girl Service Andheri West ⚡ 9920725232 What It Takes To Be The Best ...
VIP Call Girl Service Andheri West ⚡ 9920725232 What It Takes To Be The Best ...
 
The Economic History of the U.S. Lecture 30.pdf
The Economic History of the U.S. Lecture 30.pdfThe Economic History of the U.S. Lecture 30.pdf
The Economic History of the U.S. Lecture 30.pdf
 
The Economic History of the U.S. Lecture 17.pdf
The Economic History of the U.S. Lecture 17.pdfThe Economic History of the U.S. Lecture 17.pdf
The Economic History of the U.S. Lecture 17.pdf
 
WhatsApp 📞 Call : 9892124323 ✅Call Girls In Chembur ( Mumbai ) secure service
WhatsApp 📞 Call : 9892124323  ✅Call Girls In Chembur ( Mumbai ) secure serviceWhatsApp 📞 Call : 9892124323  ✅Call Girls In Chembur ( Mumbai ) secure service
WhatsApp 📞 Call : 9892124323 ✅Call Girls In Chembur ( Mumbai ) secure service
 
The Economic History of the U.S. Lecture 22.pdf
The Economic History of the U.S. Lecture 22.pdfThe Economic History of the U.S. Lecture 22.pdf
The Economic History of the U.S. Lecture 22.pdf
 
Call Girls Koregaon Park Call Me 7737669865 Budget Friendly No Advance Booking
Call Girls Koregaon Park Call Me 7737669865 Budget Friendly No Advance BookingCall Girls Koregaon Park Call Me 7737669865 Budget Friendly No Advance Booking
Call Girls Koregaon Park Call Me 7737669865 Budget Friendly No Advance Booking
 
03_Emmanuel Ndiaye_Degroof Petercam.pptx
03_Emmanuel Ndiaye_Degroof Petercam.pptx03_Emmanuel Ndiaye_Degroof Petercam.pptx
03_Emmanuel Ndiaye_Degroof Petercam.pptx
 
The Economic History of the U.S. Lecture 20.pdf
The Economic History of the U.S. Lecture 20.pdfThe Economic History of the U.S. Lecture 20.pdf
The Economic History of the U.S. Lecture 20.pdf
 
High Class Call Girls Nagpur Grishma Call 7001035870 Meet With Nagpur Escorts
High Class Call Girls Nagpur Grishma Call 7001035870 Meet With Nagpur EscortsHigh Class Call Girls Nagpur Grishma Call 7001035870 Meet With Nagpur Escorts
High Class Call Girls Nagpur Grishma Call 7001035870 Meet With Nagpur Escorts
 
Log your LOA pain with Pension Lab's brilliant campaign
Log your LOA pain with Pension Lab's brilliant campaignLog your LOA pain with Pension Lab's brilliant campaign
Log your LOA pain with Pension Lab's brilliant campaign
 
Indore Real Estate Market Trends Report.pdf
Indore Real Estate Market Trends Report.pdfIndore Real Estate Market Trends Report.pdf
Indore Real Estate Market Trends Report.pdf
 
Basic concepts related to Financial modelling
Basic concepts related to Financial modellingBasic concepts related to Financial modelling
Basic concepts related to Financial modelling
 
(Vedika) Low Rate Call Girls in Pune Call Now 8250077686 Pune Escorts 24x7
(Vedika) Low Rate Call Girls in Pune Call Now 8250077686 Pune Escorts 24x7(Vedika) Low Rate Call Girls in Pune Call Now 8250077686 Pune Escorts 24x7
(Vedika) Low Rate Call Girls in Pune Call Now 8250077686 Pune Escorts 24x7
 

citigroup April 17, 2006 - First Quarter Financial Supplement

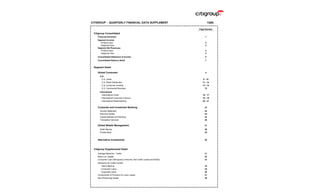
  • 1. CITIGROUP - QUARTERLY FINANCIAL DATA SUPPLEMENT 1Q06 Page Number Citigroup Consolidated Financial Summary 1 Segment Income: Product View 2 Regional View 3 Segment Net Revenues: Product View 4 Regional View 5 Consolidated Statement of Income 6 Consolidated Balance Sheet 7 Segment Detail Global Consumer: 8 U.S. U.S. Cards 9 - 10 U.S. Retail Distribution 11 - 12 U.S. Consumer Lending 13 - 14 U.S. Commercial Business 15 International International Cards 16 - 17 International Consumer Finance 18 - 19 International Retail Banking 20 - 21 Corporate and Investment Banking: 22 Income Statement 23 Revenue Details 24 Capital Markets and Banking 25 Transaction Services 26 Global Wealth Management: 27 Smith Barney 28 Private Bank 29 Alternative Investments 30 Citigroup Supplemental Detail Average Balances - Yields 31 Return on Capital 32 Consumer Loan Delinquency Amounts, Net Credit Losses and Ratios 33 Allowance for Credit Losses: Total Citigroup 34 Consumer Loans 35 Corporate Loans 36 Components of Provision for Loan Losses 37 Non-Performing Assets 38
  • 2. CITIGROUP -- FINANCIAL SUMMARY (In millions of dollars, except per share amounts) Citigroup, the leading global financial services company, has some 200 million customer accounts and does business in more than 100 countries, providing consumers, corporations, governments and institutions a complete range of financial products and services. 1Q 2006 vs. 1Q 2Q 3Q 4Q 1Q 1Q 2005 Increase/ 2005 2005 2005 2005 2006 (Decrease) Income from Continuing Operations $ 5,115 $ 4,731 $ 4,988 $ 4,972 $ 5,555 9% Discontinued Operations, After-tax 326 342 2,155 2,009 84 Cumulative Effect of Accounting Change - - - (49) - Net Income $ 5,441 $ 5,073 $ 7,143 $ 6,932 $ 5,639 4% Diluted Earnings Per Share: Income from Continuing Operations $ 0.98 $ 0.91 $ 0.97 $ 0.98 $ 1.11 13% Net Income $ 1.04 $ 0.97 $ 1.38 $ 1.37 $ 1.12 8% Adjusted weighted average common shares applicable to Diluted EPS (in millions) 5,226.0 5,208.1 5,146.0 5,061.3 5,007.9 Preferred Dividends - Diluted $ 17 $ 17 $ 17 $ 17 $ 16 Common Shares Outstanding, at period end (in millions) 5,202.2 5,170.1 5,059.0 4,980.2 4,971.2 Tier 1 Capital Ratio 8.78% 8.71% 9.12% 8.79% 8.5% * Total Capital Ratio 12.03% 11.87% 12.37% 12.02% 11.7% * Leverage Ratio 5.19% 5.19% 5.53% 5.35% 5.2% * Total Assets, at period end (in billions) $ 1,489.9 $ 1,547.8 $ 1,472.8 $ 1,494.0 $ 1,586.2 * Stockholders' Equity, at period end (in billions) $ 110.5 $ 113.0 $ 111.8 $ 112.5 $ 114.4 * Equity and Trust Securities, at period end (in billions) $ 116.9 $ 119.5 $ 118.2 $ 118.8 $ 120.6 * Book Value Per Share, at period end $ 21.03 $ 21.65 $ 21.88 $ 22.37 $ 22.82 * Return on Common Equity (Net Income) 20.3% 18.4% 25.4% 25.0% 20.3% Return on Risk Capital (Income from Continuing Operations) 40% 36% 37% 37% 41% * Preliminary Page 1
  • 3. CITIGROUP -- NET INCOME PRODUCT VIEW (In millions of dollars) 1Q 2006 vs. 1Q 2Q 3Q 4Q 1Q 1Q 2005 Increase/ 2005 2005 2005 2005 2006 (Decrease) Global Consumer: U.S. Cards $ 778 $ 735 $ 797 $ 444 $ 926 19% U.S. Retail Distribution 564 478 319 391 515 (9%) U.S. Consumer Lending 486 507 487 458 437 (10%) U.S. Commercial Business 252 134 222 121 126 (50%) Total U.S. Consumer (1) 2,080 1,854 1,825 1,414 2,004 (4%) International Cards 302 331 383 357 291 (4%) International Consumer Finance 139 177 152 174 168 21% International Retail Banking 498 593 427 565 677 36% Total International Consumer 939 1,101 962 1,096 1,136 21% Other (176) (58) (64) (76) (67) 62% Total Global Consumer 2,843 2,897 2,723 2,434 3,073 8% Corporate and Investment Banking: Capital Markets and Banking 1,439 1,043 1,424 1,421 1,618 12% Transaction Services 245 288 327 275 323 32% Other (2) (5) 41 46 351 (12) NM Total Corporate and Investment Banking 1,679 1,372 1,797 2,047 1,929 15% Global Wealth Management: Smith Barney 197 239 227 208 168 (15%) Private Bank 122 83 79 89 119 (2%) Total Global Wealth Management 319 322 306 297 287 (10%) Alternative Investments 362 385 339 351 353 (2%) Corporate / Other (88) (245) (177) (157) (87) 1% Income From Continuing Operations 5,115 4,731 4,988 4,972 5,555 9% Discontinued Operations (3)(4) 326 342 2,155 2,009 84 Cumulative Effect of Accounting Change (5) - - - (49) - Net Income $ 5,441 $ 5,073 $ 7,143 $ 6,932 $ 5,639 4% (1) U.S. disclosure includes Canada and Puerto Rico. (2) The 2005 fourth quarter includes a $375 million after-tax release of WorldCom Settlement and Litigation Reserves. (3) Discontinued Operations includes the operations from the Company's January 31, 2005 announced agreement for the sale of Citigroup's Travelers Life & Annuity, and substantially all of Citigroup's international insurance business, to MetLife, Inc. The transaction closed during the 2005 third quarter and resulted in a $3.4 billion ($2.1 billion after-tax) gain. (4) Discontinued Operations includes the operations from the Company's June 24, 2005 announced agreement for the sale of substantially all of Citigroup's Asset Management business to Legg Mason, Inc. The transaction closed during the 2005 fourth quarter and resulted in a $3.4 billion ($2.1 billion after-tax) gain. (5) Cumulative Effect of Accounting Change represents the adoption of FIN 47, quot;Accounting for Conditional Asset Retirement Obligations, an interpretation of SFAS No. 143quot;. This pronouncement is applicable to real estate leasing agreements that required Citigroup to restore the leased space back to its original condition upon termination of the lease. NM Not meaningful Page 2 Reclassified to conform to the current period's presentation.
  • 4. CITIGROUP -- NET INCOME REGIONAL VIEW (In millions of dollars) 1Q 2006 vs. 1Q 2Q 3Q 4Q 1Q 1Q 2005 Increase/ 2005 2005 2005 2005 2006 (Decrease) U.S. (1) Global Consumer $ 1,904 $ 1,796 $ 1,761 $ 1,338 $ 1,937 2% Corporate and Investment Banking 893 462 637 958 515 (42%) Global Wealth Management 273 315 288 265 228 (16%) Total U.S. 3,070 2,573 2,686 2,561 2,680 (13%) Mexico Global Consumer 277 368 511 276 358 29% Corporate and Investment Banking 83 76 177 114 78 (6%) Global Wealth Management 13 10 12 9 8 (38%) Total Mexico 373 454 700 399 444 19% Europe, Middle East and Africa (EMEA) Global Consumer 122 124 (154) 282 185 52% Corporate and Investment Banking 188 336 358 248 635 NM Global Wealth Management (1) 3 8 (2) 3 NM Total EMEA 309 463 212 528 823 NM Japan Global Consumer 175 188 169 174 188 7% Corporate and Investment Banking 48 54 58 338 85 77% Global Wealth Management (8) (45) (29) - - 100% Total Japan 215 197 198 512 273 27% Asia (excluding Japan) Global Consumer 311 341 375 323 347 12% Corporate and Investment Banking 322 249 382 295 414 29% Global Wealth Management 35 31 26 24 45 29% Total Asia 668 621 783 642 806 21% Latin America Global Consumer 54 80 61 41 58 7% Corporate and Investment Banking 145 195 185 94 202 39% Global Wealth Management 7 8 1 1 3 (57%) Total Latin America 206 283 247 136 263 28% Alternative Investments 362 385 339 351 353 (2%) Corporate / Other (88) (245) (177) (157) (87) 1% Income From Continuing Operations 5,115 4,731 4,988 4,972 5,555 9% Discontinued Operations 326 342 2,155 2,009 84 Cumulative Effect of Accounting Change - - - (49) - Net Income $ 5,441 $ 5,073 $ 7,143 $ 6,932 $ 5,639 4% Total International $ 1,771 $ 2,018 $ 2,140 $ 2,217 $ 2,609 47% (1) Excludes Alternative Investments and Corporate / Other which are predominantly related to the U.S. The U.S. regional disclosure includes Canada and Puerto Rico. Global Consumer for the U.S includes Other Consumer. NM Not meaningful Page 3 Reclassified to conform to the current period's presentation.
  • 5. CITIGROUP -- NET REVENUES PRODUCT VIEW (In millions of dollars) 1Q 2006 vs. 1Q 2Q 3Q 4Q 1Q 1Q 2005 Increase/ 2005 2005 2005 2005 2006 (Decrease) Global Consumer: U.S. Cards $ 3,455 $ 3,263 $ 3,381 $ 2,725 $ 3,234 (6%) U.S. Retail Distribution 2,457 2,360 2,339 2,359 2,296 (7%) U.S. Consumer Lending 1,373 1,376 1,332 1,388 1,260 (8%) U.S. Commercial Business 678 491 649 481 470 (31%) Total U.S. Consumer (1) 7,963 7,490 7,701 6,953 7,260 (9%) International Cards 1,105 1,176 1,209 1,360 1,280 16% International Consumer Finance 948 963 950 958 962 1% International Retail Banking 2,305 2,396 2,474 2,552 2,467 7% Total International Consumer 4,358 4,535 4,633 4,870 4,709 8% Other (203) (18) (13) (24) (14) 93% Total Global Consumer 12,118 12,007 12,321 11,799 11,955 (1%) Corporate and Investment Banking: Capital Markets and Banking 4,899 3,965 5,187 4,919 5,896 20% Transaction Services 1,137 1,191 1,246 1,317 1,382 22% Other 1 - 1 - 1 - Total Corporate and Investment Banking 6,037 5,156 6,434 6,236 7,279 21% Global Wealth Management: Smith Barney 1,669 1,647 1,728 1,781 1,987 19% Private Bank 504 453 446 456 496 (2%) Total Global Wealth Management 2,173 2,100 2,174 2,237 2,483 14% Alternative Investments 866 1,112 720 732 675 (22%) Corporate / Other 2 (206) (151) (225) (209) NM Total Net Revenues $ 21,196 $ 20,169 $ 21,498 $ 20,779 $ 22,183 5% (1) U.S. disclosure includes Canada and Puerto Rico. NM Not meaningful Reclassified to conform to the current period's presentation. Page 4
  • 6. CITIGROUP -- NET REVENUES REGIONAL VIEW (In millions of dollars) 1Q 2006 vs. 1Q 2Q 3Q 4Q 1Q 1Q 2005 Increase/ 2005 2005 2005 2005 2006 (Decrease) U.S. (1) Global Consumer $ 7,760 $ 7,472 $ 7,688 $ 6,929 $ 7,246 (7%) Corporate and Investment Banking 2,779 1,948 2,810 2,364 2,923 5% Global Wealth Management 1,872 1,852 1,923 1,981 2,154 15% Total U.S. 12,411 11,272 12,421 11,274 12,323 (1%) Mexico Global Consumer 960 1,055 1,139 1,219 1,149 20% Corporate and Investment Banking 159 170 236 212 186 17% Global Wealth Management 31 31 30 32 31 - Total Mexico 1,150 1,256 1,405 1,463 1,366 19% Europe, Middle East and Africa (EMEA) Global Consumer 1,248 1,256 1,271 1,426 1,270 2% Corporate and Investment Banking 1,694 1,708 1,801 1,646 2,296 36% Global Wealth Management 71 71 79 74 75 6% Total EMEA 3,013 3,035 3,151 3,146 3,641 21% Japan Global Consumer 821 827 803 800 775 (6%) Corporate and Investment Banking 180 187 211 646 296 64% Global Wealth Management 22 (15) (13) - - (100%) Total Japan 1,023 999 1,001 1,446 1,071 5% Asia (excluding Japan) Global Consumer 1,072 1,116 1,141 1,132 1,189 11% Corporate and Investment Banking 915 761 1,004 1,017 1,132 24% Global Wealth Management 119 111 107 103 180 51% Total Asia 2,106 1,988 2,252 2,252 2,501 19% Latin America Global Consumer 257 281 279 293 326 27% Corporate and Investment Banking 310 382 372 351 446 44% Global Wealth Management 58 50 48 47 43 (26%) Total Latin America 625 713 699 691 815 30% Alternative Investments 866 1,112 720 732 675 (22%) Corporate / Other 2 (206) (151) (225) (209) NM Total Net Revenues $ 21,196 $ 20,169 $ 21,498 $ 20,779 $ 22,183 5% Total International $ 7,917 $ 7,991 $ 8,508 $ 8,998 $ 9,394 19% (1) Excludes Alternative Investments and Corporate / Other which are predominantly related to the U.S. The U.S. regional disclosure includes Canada and Puerto Rico. Global Consumer for the U.S includes Other Consumer. NM Not meaningful Reclassified to conform to the current period's presentation. Page 5
  • 7. CITIGROUP CONSOLIDATED STATEMENT OF INCOME (In millions of dollars) 1Q 2006 vs. 1Q 2Q 3Q 4Q 1Q 1Q 2005 Increase/ 2005 2005 2005 2005 2006 (Decrease) Revenues Loan interest, including fees $ 11,273 $ 11,486 $ 12,066 $ 12,363 $ 12,809 14% Other interest and dividends 6,262 6,981 7,309 8,281 9,055 45% Insurance premiums 735 793 743 861 770 5% Commissions and fees 4,209 3,978 4,825 4,131 5,188 23% Principal transactions 2,215 844 1,950 1,434 2,117 (4%) Asset management and administration fees 1,508 1,488 1,522 1,601 1,705 13% Realized gains (losses) from sales of investments 243 455 284 980 379 56% Other revenue 2,175 2,812 2,448 2,063 2,267 4% Total revenues 28,620 28,837 31,147 31,714 34,290 20% Interest expense 7,424 8,668 9,649 10,935 12,107 63% Total revenues, net of interest expense 21,196 20,169 21,498 20,779 22,183 5% Provisions for Credit Losses and for Benefits and Claims Policyholder benefits and claims 217 212 215 223 227 5% Provision for loan losses 1,813 1,720 2,525 1,871 1,396 (23%) Provision for unfunded lending commitments - 100 100 50 50 - Total provisions for credit losses and for benefits and claims 2,030 2,032 2,840 2,144 1,673 (18%) Operating Expenses Compensation and benefits 6,486 6,033 6,792 6,461 8,263 27% Net occupancy expense 1,241 1,271 1,270 1,359 1,382 11% Technology / communication expense 866 884 892 882 886 2% Advertising and marketing expense 641 620 587 685 603 (6%) Other operating 2,170 2,164 1,872 1,987 2,224 2% Total operating expenses 11,404 10,972 11,413 11,374 13,358 17% Income from Continuing Operations before Income Taxes and Minority Interest and Cumulative Effect of Accounting Change 7,762 7,165 7,245 7,261 7,152 (8%) Provision (benefit) for income taxes 2,484 2,179 2,164 2,251 1,537 (38%) Minority interest, net of income taxes 163 255 93 38 60 (63%) Income from Continuing Operations before Cumulative Effect of Accounting Change 5,115 4,731 4,988 4,972 5,555 9% Discontinued Operations (1) (2) Income from Discontinued Operations 483 493 49 (117) 1 Gain on Sale - - 3,386 3,404 21 Provision for income taxes and minority interest, net of taxes 157 151 1,280 1,278 (62) Income from Discontinued Operations, net 326 342 2,155 2,009 84 Cumulative Effect of Accounting Change (3) - - - (49) - Net Income $ 5,441 $ 5,073 $ 7,143 $ 6,932 $ 5,639 4% (1) Discontinued Operations includes the operations from the Company's January 31, 2005 announced agreement for the sale of Citigroup's Travelers Life & Annuity, and substantially all of Citigroup's international insurance business, to MetLife, Inc. The transaction closed during the 2005 third quarter and resulted in a $3.4 billion ($2.1 billion after-tax) gain. (2) Discontinued Operations includes the operations from the Company's June 24, 2005 announced agreement for the sale of substantially all of Citigroup's Asset Management business to Legg Mason, Inc. The transaction closed during the 2005 fourth quarter and resulted in a $3.4 billion ($2.1 billion after-tax) gain. (3) Cumulative Effect of Accounting Change represents the adoption of FIN 47, quot;Accounting for Conditional Asset Retirement Obligations, an interpretation of SFAS No. 143quot;. This pronouncement is applicable to real estate leasing agreements that required Citigroup to restore the leased space back to its original condition upon termination o the lease. Reclassified to conform to the current period's presentation. Page 6
  • 8. CITIGROUP CONSOLIDATED BALANCE SHEET (In millions of dollars) March 31, 2006 vs. March 31, June 30, September 30, December 31, March 31, December 31, 2005 2005 2005 2005 2005 2006 (1) Inc (Decr) Assets Cash and due from banks (including segregated cash and other deposits) $ 25,620 $ 28,942 $ 28,438 $ 28,373 $ 26,355 (7%) Deposits at interest with banks 28,568 31,322 30,604 26,904 28,276 5% Federal funds sold and securities borrowed or purchased under agreements to resell 202,099 232,369 236,105 217,464 239,552 10% Brokerage receivables 40,747 42,977 42,006 42,823 42,569 (1%) Trading account assets 272,841 281,035 293,416 295,820 328,135 11% Investments 167,589 165,587 165,905 180,597 193,970 7% Loans, net of unearned income Consumer 430,008 433,057 440,145 454,620 462,068 2% Corporate 117,651 123,880 126,276 128,883 143,239 11% Loans, net of unearned income 547,659 556,937 566,421 583,503 605,307 4% Allowance for credit losses (10,894) (10,418) (10,015) (9,782) (9,505) 3% Total loans, net 536,765 546,519 556,406 573,721 595,802 4% Goodwill 32,076 32,235 32,240 33,130 32,933 (1%) Intangible assets 15,572 13,894 14,376 14,749 15,092 2% Other assets 72,936 78,485 72,117 80,456 83,517 4% Assets of discontinued operations held for sale 95,078 94,424 1,180 - - - Total assets $ 1,489,891 $ 1,547,789 $ 1,472,793 $ 1,494,037 $ 1,586,201 6% Liabilities Non-interest-bearing deposits in U.S. offices $ 39,092 $ 38,312 $ 38,673 $ 37,405 $ 38,684 3% Interest-bearing deposits in U.S. offices 159,889 159,825 162,310 169,277 176,032 4% Non-interest-bearing deposits in offices outside the U.S. 29,930 31,281 32,374 32,614 34,323 5% Interest-bearing deposits in offices outside the U.S. 339,963 343,156 347,756 353,299 379,118 7% Total deposits 568,874 572,574 581,113 592,595 628,157 6% Federal funds purchased and securities loaned or sold under agreements to repurchase 217,599 252,774 243,819 242,392 279,540 15% Brokerage payables 52,088 53,600 57,330 70,994 70,214 (1%) Trading account liabilities 120,511 133,807 140,723 121,108 144,888 20% Short-term borrowings 62,704 62,984 58,224 66,930 58,130 (13%) Long-term debt 207,935 211,346 213,894 217,499 227,165 4% Other liabilities (2) 63,271 63,455 65,488 69,982 63,689 (9%) Liabilities of discontinued operations held for sale 86,373 84,212 365 - - - Total liabilities 1,379,355 1,434,752 1,360,956 1,381,500 1,471,783 7% Stockholders' equity Preferred Stock 1,125 1,125 1,125 1,125 1,000 (11%) Common Stock 55 55 55 55 55 - Additional paid-in capital 16,243 17,160 17,636 17,483 17,119 (2%) Retained earnings 105,269 108,026 112,868 117,555 120,703 3% Treasury stock (10,475) (12,299) (17,290) (21,149) (21,753) (3%) Accumulated other changes in equity from nonowner sources (1,681) (1,030) (2,557) (2,532) (2,706) (7%) Total stockholders' equity 110,536 113,037 111,837 112,537 114,418 2% Total liabilities and stockholders' equity $ 1,489,891 $ 1,547,789 $ 1,472,793 $ 1,494,037 $ 1,586,201 6% (1) Preliminary. (2) Includes allowance for credit losses for letters of credit and unfunded lending commitments of $600 million, $700 million, $800 million and $850 million for the first, second, third and fourth quarters of 2005, respectively, and $900 million in the first quarter of 2006. Reclassified to conform to the current period's presentation. Page 7
  • 9. GLOBAL CONSUMER (In millions of dollars) 1Q 2006 vs. 1Q 2Q 3Q 4Q 1Q 1Q 2005 Increase/ 2005 2005 2005 2005 2006 (Decrease) Global Consumer: Total Revenues, Net of Interest Expense $ 12,118 $ 12,007 $ 12,321 $ 11,799 $ 11,955 (1%) Total Operating Expenses 5,846 5,753 5,657 6,062 6,357 9% Provisions for Loan Losses and for Benefits and Claims 2,102 2,047 2,770 2,144 1,668 (21%) Income Before Taxes and Minority Interest 4,170 4,207 3,894 3,593 3,930 (6%) Income Taxes 1,314 1,295 1,153 1,142 847 (36%) Minority Interest, Net of Tax 13 15 18 17 10 (23%) Net Income $ 2,843 $ 2,897 $ 2,723 $ 2,434 $ 3,073 8% U.S.: Total Revenues, Net of Interest Expense $ 7,963 $ 7,490 $ 7,701 $ 6,953 $ 7,260 (9%) Total Operating Expenses 3,337 3,358 3,290 3,464 3,569 7% Provisions for Loan Losses and for Benefits and Claims 1,429 1,317 1,573 1,281 901 (37%) Income Before Taxes and Minority Interest 3,197 2,815 2,838 2,208 2,790 (13%) Income Taxes 1,104 945 996 778 777 (30%) Minority Interest, Net of Tax 13 16 17 16 9 (31%) Net Income $ 2,080 $ 1,854 $ 1,825 $ 1,414 $ 2,004 (4%) International: Total Revenues, Net of Interest Expense $ 4,358 $ 4,535 $ 4,633 $ 4,870 $ 4,709 8% Total Operating Expenses 2,422 2,320 2,280 2,498 2,621 8% Provisions for Loan Losses and for Benefits and Claims 673 730 1,197 863 767 14% Income Before Taxes and Minority Interest 1,263 1,485 1,156 1,509 1,321 5% Income Taxes 324 385 193 412 184 (43%) Minority Interest, Net of Tax - (1) 1 1 1 - Net Income $ 939 $ 1,101 $ 962 $ 1,096 $ 1,136 21% Other Consumer: Total Revenues, Net of Interest Expense $ (203) $ (18) $ (13) $ (24) $ (14) 93% Total Operating Expenses 87 75 87 100 167 92% Income Before Taxes (290) (93) (100) (124) (181) 38% Income Taxes (114) (35) (36) (48) (114) - Net Income $ (176) $ (58) $ (64) $ (76) $ (67) 62% Reclassified to conform to the current period's presentation. Page 8
  • 10. For your convenience, an excerpt from our 2006 first quarter earnings press release is set out below. The full text of the press release, GLOBAL CONSUMER and those from prior periods, are available on Citigroup's website at www.citigroup.com. U.S. ** Net income increased 19%, partially reflecting sharply lower credit costs. Credit costs declined, as lower bankruptcy filings and a CARDS - Page 1 continued favorable credit environment combined to drive the managed net credit loss ratio down by 168 bps to 3.90%. (In millions of dollars) ** Revenues declined, reflecting lower average managed receivables and continued net interest margin compression. Receivables growth in reward and private label cards was more than offset by declines in traditional card products. The benefit of 11% growth in purchase sales was offset by increased payment rates. ** 2006 first quarter results include the impact from SFAS 123(R) charges and tax benefits from the resolution of a federal tax audit. See Schedule A on page 8 of the 1Q06 earnings press release. 1Q 2006 vs. 1Q 2Q 3Q 4Q 1Q 1Q 2005 Increase/ 2005 2005 2005 2005 2006 (Decrease) Total Revenues, Net of Interest Expense (1) $ 3,455 $ 3,263 $ 3,381 $ 2,725 $ 3,234 (6%) Total Operating Expenses 1,500 1,503 1,458 1,541 1,532 2% Net Credit Losses 756 640 649 692 446 (41%) Credit Reserve Build / (Release) - - 30 (200) (72) - Provision for Benefits & Claims - - - - 21 - Provision for Loan Losses and for Benefits and Claims 756 640 679 492 395 (48%) Income Before Taxes and Minority Interest 1,199 1,120 1,244 692 1,307 9% Income Taxes and Minority Interest 421 385 447 248 381 (10%) Net Income $ 778 $ 735 $ 797 $ 444 $ 926 19% Average Assets (in billions of dollars) $ 71 $ 65 $ 63 $ 63 $ 63 (11%) Return on Assets 4.44% 4.54% 5.02% 2.80% 5.96% Net Credit Loss Ratio 5.77% 5.47% 5.76% 6.38% 4.27% Average Risk Capital $ 5,638 $ 5,855 $ 5,848 $ 5,756 $ 5,563 (1%) Return on Risk Capital 56% 50% 54% 31% 68% Return on Invested Capital 23% 21% 22% 13% 28% KEY INDICATORS - Managed Basis (2) (in billions of dollars) Return on Managed Assets 2.12% 2.04% 2.20% 1.22% 2.59% Average Managed Loans: Securitized $ 86.4 $ 87.7 $ 89.8 $ 92.8 $ 94.7 10% Held for Sale 0.2 0.6 - 0.7 0.3 50% On Balance Sheet 53.1 47.0 44.7 43.0 42.3 (20%) Total Managed $ 139.7 $ 135.3 $ 134.5 $ 136.5 $ 137.3 (2%) Bankcards $ 114.4 $ 110.4 $ 109.2 $ 109.6 $ 110.4 (3%) Private Label 25.3 24.9 25.3 26.9 26.9 6% Total Managed $ 139.7 $ 135.3 $ 134.5 $ 136.5 $ 137.3 (2%) End of Period Managed Loans: Bankcards $ 111.9 $ 110.2 $ 109.1 $ 113.7 $ 109.7 (2%) Private Label 24.7 25.2 25.6 27.9 26.2 6% Total $ 136.6 $ 135.4 $ 134.7 $ 141.6 $ 135.9 (1%) (1) The 2005 first quarter, 2005 second quarter, 2005 third quarter, 2005 fourth quarter and 2006 first quarter include releases of $129 million, $102 million, $137 million, $186 million and $90 million, respectively, from the allowance for credit losses related to loan receivables that were securitized during the quarter. (2) Managed basis presentation includes results from both the on-balance sheet loans and off- balance sheet loans, and excludes the impact of card securitization activity. Managed disclosures assume that securitized loans have not been sold and present the results of the securitized loans in the same manner as the Company's owned loans. Page 9 Reclassified to conform to the current period's presentation.
  • 11. GLOBAL CONSUMER U.S. CARDS - Page 2 1Q 2006 vs. (In millions of dollars) 1Q 2Q 3Q 4Q 1Q 1Q 2005 Increase/ 2005 2005 2005 2005 2006 (Decrease) SUPPLEMENTAL DISCLOSURE - Managed Basis (1): EOP Open Accounts (in millions) 124.5 122.7 119.4 131.2 131.1 5% Purchase Sales (in billions of dollars) (2) $ 61.7 $ 69.8 $ 70.9 $ 75.8 $ 68.4 11% Managed Average Yield (3) Bankcards 12.17% 12.42% 12.76% 12.43% 12.85% Private Label 19.99% 19.43% 19.24% 18.91% 19.55% Total 13.58% 13.71% 13.98% 13.71% 14.16% Managed Net Interest Revenue Bankcards $ 2,690 $ 2,572 $ 2,650 $ 2,524 $ 2,471 (8%) (in millions of dollars) (4) Private Label 1,111 1,048 1,088 1,124 1,076 (3%) Total $ 3,801 $ 3,620 $ 3,738 $ 3,648 $ 3,547 (7%) Managed Net Interest Revenue as Bankcards 9.54% 9.35% 9.64% 9.14% 9.09% a % of Average Managed Loans Private Label 17.81% 16.88% 17.06% 16.58% 16.22% Total 11.03% 10.74% 11.03% 10.60% 10.48% Managed Net Credit Margin Bankcards $ 1,888 $ 1,798 $ 1,881 $ 823 $ 2,146 14% (in millions of dollars) (5) Private Label 642 635 672 652 617 (4%) Total $ 2,530 $ 2,433 $ 2,553 $ 1,475 $ 2,763 9% Managed Net Credit Margin as Bankcards 6.69% 6.54% 6.84% 2.98% 7.88% a % of Average Managed Loans Private Label 10.29% 10.23% 10.54% 9.62% 9.30% Total 7.34% 7.22% 7.54% 4.29% 8.16% Managed Net Credit Losses Bankcards $ 1,490 $ 1,564 $ 1,531 $ 1,828 $ 948 (36%) (in millions of dollars) Private Label 431 392 385 470 373 (13%) Total $ 1,921 $ 1,956 $ 1,916 $ 2,298 $ 1,321 (31%) Coincident Managed Net Bankcards 5.28% 5.69% 5.57% 6.61% 3.49% Credit Loss Ratio: Private Label 6.91% 6.31% 6.04% 6.93% 5.62% Total 5.58% 5.80% 5.66% 6.68% 3.90% 12 Month Lagged Managed Net Credit Loss Ratio 5.70% 5.84% 5.58% 6.50% 3.83% Managed Loans 90+Days Past Due Bankcards $ 1,716 $ 1,580 $ 1,579 $ 1,553 $ 1,536 (10%) Private Label 684 672 701 922 825 21% Total $ 2,400 $ 2,252 $ 2,280 $ 2,475 $ 2,361 (2%) % of EOP Managed Loans Bankcards 1.53% 1.43% 1.45% 1.37% 1.40% Private Label 2.78% 2.67% 2.74% 3.30% 3.15% Total 1.76% 1.66% 1.69% 1.75% 1.74% (1) Managed basis presentation includes results from both the on-balance sheet loans and off- balance sheet loans, and excludes the impact of card securitization activity Managed disclosures assume that securitized loans have not been sold and present the results of the securitized loans in the same manner as the Company's owned loans (2) Purchase Sales represents customers' purchased sales plus cash advances. (3) Gross interest revenue earned divided by average managed loans. (4) Includes certain fees that are recorded as interest revenue. (5) Total Revenues, net of Interest Expense, less Net Credit Losses. Reclassified to conform to the current period's presentation. Page 10
  • 12. For your convenience, an excerpt from our 2006 first quarter earnings press release is set out below. The full text of the press release, GLOBAL CONSUMER and those from prior periods, are available on Citigroup's website at www.citigroup.com. U.S. ** Revenues and net income declined primarily due to the absence of a $114 million pre-tax gain in prior year quarter relating to the resolution RETAIL DISTRIBUTION - Page 1 of litigation. Growth in deposits and loans, up 6% and 8%, respectively, and a 26% increase in investment product sales, were more than (In millions of dollars) offset by lower net interest margin. Lower net interest margin was driven in part by a shift in customer liabilities from demand deposits to certificates of deposit. ** Expenses increased 13%, reflecting higher business volumes and investment in new branches, new product development and technology. During the quarter, 36 new branches were opened. ** Credit costs declined 70 basis points to an NCL rate of 2.66%, reflecting lower bankruptcy filings. ** 2006 first quarter results include the impact from SFAS 123(R) charges and tax benefits from the resolution of a federal tax audit. See Schedule A on page 8 of the 1Q06 earnings press release. 1Q 2006 vs. 1Q 2Q 3Q 4Q 1Q 1Q 2005 Increase/ 2005 2005 2005 2005 2006 (Decrease) Total Revenues, Net of Interest Expense: Citibank Branches $ 853 $ 766 $ 754 $ 730 $ 737 (14%) Citifinancial Branches 1,053 1,054 1,035 1,048 1,008 (4%) Primerica Financial Services 551 540 550 581 551 - Total Revenues, Net of Interest Expense 2,457 2,360 2,339 2,359 2,296 (7%) Total Operating Expenses 1,085 1,107 1,099 1,116 1,221 13% Net Credit Losses 326 346 314 418 279 (14%) Credit Reserve Build / (Release) (17) - 275 44 (55) NM Provision for Benefits & Claims 182 177 170 175 163 (10%) Provision for Loan Losses and for Benefits and Claims 491 523 759 637 387 (21%) Income Before Taxes 881 730 481 606 688 (22%) Income Taxes 317 252 162 215 173 (45%) Net Income $ 564 $ 478 $ 319 $ 391 $ 515 (9%) Average Assets (in billions of dollars) $ 63 $ 64 $ 65 $ 65 $ 66 5% Return on Assets 3.63% 3.00% 1.95% 2.39% 3.16% Average Risk Capital $ 2,940 $ 2,983 $ 3,003 $ 2,982 $ 3,459 18% Return on Risk Capital 78% 64% 42% 52% 60% Return on Invested Capital 20% 18% 13% 15% 23% Net Income by Business: Citibank Branches $ 185 $ 114 $ 111 $ 96 $ 100 (46%) Citifinancial Branches 245 228 72 151 265 8% Primerica Financial Services 134 136 136 144 150 12% Total Net Income $ 564 $ 478 $ 319 $ 391 $ 515 (9%) NM Not meaningful Reclassified to conform to the current period's presentation. Page 11
  • 13. GLOBAL CONSUMER U.S. RETAIL DISTRIBUTION - Page 2 (In millions of dollars) 1Q 2006 vs. 1Q 2Q 3Q 4Q 1Q 1Q 2005 Increase/ 2005 2005 2005 2005 2006 (Decrease) KEY INDICATORS: Average Loans Citibank Branches $ 8.2 $ 8.5 $ 8.8 $ 9.1 $ 9.4 15% (in billions of dollars) CitiFinancial Branches 31.2 31.2 31.9 32.6 33.1 6% Total $ 39.4 $ 39.7 $ 40.7 $ 41.7 $ 42.5 8% Average Loans by Product Real estate secured loans $ 20.4 $ 20.8 $ 21.2 $ 21.8 $ 22.3 9% (in billions of dollars) Personal loans 14.4 14.4 14.8 15.0 15.2 6% Sales finance and other 4.6 4.5 4.7 4.9 5.0 9% Total $ 39.4 $ 39.7 $ 40.7 $ 41.7 $ 42.5 8% Net Interest Revenue Citibank Branches $ 513 $ 523 $ 509 $ 512 $ 501 (2%) (in millions of dollars) CitiFinancial Branches 918 918 919 903 891 (3%) Primerica Financial Services 58 55 60 69 59 2% Total $ 1,489 $ 1,496 $ 1,488 $ 1,484 $ 1,451 (3%) Net Credit Loss Ratio 3.36% 3.50% 3.06% 3.98% 2.66% Loans 90+ Days Past Due (in millions of dollars) $ 782 $ 723 $ 787 $ 818 $ 740 (5%) % of EOP Loans 1.98% 1.79% 1.91% 1.94% 1.73% Number of Branches: Citibank 883 885 884 896 906 3% CitiFinancial 2,273 2,273 2,274 2,277 2,299 1% Total 3,156 3,158 3,158 3,173 3,205 2% Total EOP Accounts (in millions) Citibank Branches 10.3 10.4 10.5 10.5 10.7 4% CitiFinancial Branches 5.3 5.3 5.4 5.5 5.3 - Primerica Financial Services 4.8 4.8 4.9 4.8 4.9 2% Total 20.4 20.5 20.8 20.8 20.9 2% Citibank Branches - Average Balances ( in billions of dollars) Checking, Savings & Money Market Deposits $ 65.6 $ 66.4 $ 65.1 $ 63.6 $ 64.1 (2%) Time Deposits, CDs and Other 10.9 12.6 13.2 14.5 16.2 49% Total Branch Deposits 76.5 79.0 78.3 78.1 80.3 5% Smith Barney Bank Deposit Program 42.3 41.4 41.3 42.2 45.3 7% Total Deposits $ 118.8 $ 120.4 $ 119.6 $ 120.3 $ 125.6 6% Checking Accounts (in millions ) 3.5 3.5 3.5 3.5 3.6 3% EOP Investment AUMs (in billions of dollars) $ 39.8 $ 40.7 $ 41.6 $ 42.5 $ 43.8 10% Total Investment Product Sales (in billions of dollars) $ 3.1 $ 3.0 $ 3.2 $ 3.0 $ 3.9 26% Primerica Financial Services: Life Insurance in Force (in billions of dollars) $ 553.1 $ 562.7 $ 572.4 $ 581.3 $ 583.9 6% Loan Volumes (in millions of dollars) $ 972.8 $ 963.6 $ 1,099.9 $ 1,381.4 $ 1,087.0 12% Mutual Fund Sales at NAV (in millions of dollars) $ 903 $ 865 $ 798 $ 791 $ 971 8% Variable Annuity Net Written Premiums & Deposits (in millions of dollars) $ 328 $ 271 $ 283 $ 302 $ 388 18% Investment AUMs (EOP) (in billions of dollars) $ 27.5 $ 28.0 $ 29.3 $ 30.1 $ 31.2 13% Reclassified to conform to the current period's presentation. Page 12
  • 14. For your convenience, an excerpt from our 2006 first quarter earnings press release is set out below. The full text of the press release, GLOBAL CONSUMER and those from prior periods, are available on Citigroup's website at www.citigroup.com. U.S. ** Revenues declined as 18% growth in average loans was offset by net interest margin compression across all loan portfolios. The revenue CONSUMER LENDING - Page 1 decrease also reflected lower net mortgage servicing revenues and lower gains on the sale of real estate loans. (In millions of dollars) ** Expenses increased 10% due to increased business volumes. Credit conditions remained favorable, leading to a decline in net credit loss ratios. ** 2006 first quarter results include the impact from SFAS 123(R) charges and tax benefits from the resolution of a federal tax audit. See Schedule A on page 8 of the 1Q06 earnings press release. 1Q 2006 vs. 1Q 2Q 3Q 4Q 1Q 1Q 2005 Increase/ 2005 2005 2005 2005 2006 (Decrease) Total Revenues, Net of Interest Expense: Real Estate Lending $ 924 $ 888 $ 836 $ 910 $ 843 (9%) Student Loans 132 176 173 171 117 (11%) Auto 317 312 323 307 300 (5%) Total Revenues, Net of Interest Expense 1,373 1,376 1,332 1,388 1,260 (8%) Total Operating Expenses 411 413 425 451 453 10% Net Credit Losses 181 146 168 178 176 (3%) Credit Reserve Build / (Release) (1) 1 (56) (8) (31) NM Provision for Benefits & Claims 2 1 2 - (2) NM Provision for Loan Losses and for Benefits and Claims 182 148 114 170 143 (21%) Income Before Taxes and Minority Interest 780 815 793 767 664 (15%) Income Taxes 281 292 289 293 218 (22%) Minority Interest, Net of Tax 13 16 17 16 9 (31%) Net Income $ 486 $ 507 $ 487 $ 458 $ 437 (10%) Average Assets (in billions of dollars) $ 178 $ 186 $ 192 $ 201 $ 209 17% Return on Assets 1.11% 1.09% 1.01% 0.90% 0.85% Average Risk Capital $ 3,291 $ 3,341 $ 3,218 $ 3,270 $ 3,732 13% Return on Risk Capital 60% 61% 60% 56% 47% Return on Invested Capital 38% 32% 31% 29% 27% Net Income by Business: Real Estate Lending $ 363 $ 356 $ 318 $ 341 $ 328 (10%) Student Loans 52 62 62 58 38 (27%) Auto 71 89 107 59 71 - Total Net Income $ 486 $ 507 $ 487 $ 458 $ 437 (10%) NM Not meaningful Reclassified to conform to the current period's presentation. Page 13