VIP Call Girl Service Andheri West ⚡ 9920725232 What It Takes To Be The Best ...
Weekly Market Report
1. Page 1 of 5
Market Review and Outlook QE Index and Volume
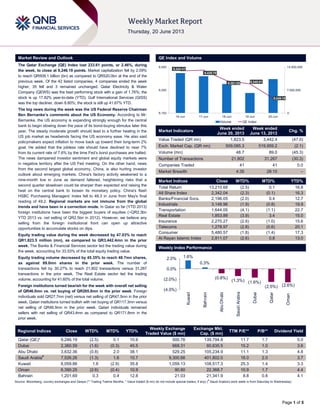
The Qatar Exchange (QE) Index lost 233.61 points, or 2.46%, during
the week, to close at 9,246.19 points. Market capitalization fell by 2.09%
to reach QR509.1 billion (bn) as compared to QR520.0bn at the end of the
previous week. Of the 42 listed companies, 4 companies ended the week
higher, 35 fell and 3 remained unchanged. Qatar Electricity & Water
Company (QEWS) was the best performing stock with a gain of 1.76%; the
stock is up 17.82% year-to-date (YTD). Gulf International Services (GISS)
was the top decliner, down 8.80%; the stock is still up 41.67% YTD.
The big news during the week was the US Federal Reserve Chairman
Ben Bernanke’s comments about the US Economy. According to Mr.
Bernanke, the US economy is expanding strongly enough for the central
bank to begin slowing down the pace of its bond-buying stimulus later this
year. The steady moderate growth should lead to a further healing in the
US job market as headwinds facing the US economy ease. He also said
policymakers expect inflation to move back up toward their long-term 2%
goal. He added that the jobless rate should have declined to near 7%
from its current rate of 7.6% by the time Fed‟s bond purchases are halted.
The news dampened investor sentiment and global equity markets were
in negative territory after the US Fed meeting. On the other hand, news
from the second largest global economy, China, is also hurting investor
outlook about emerging markets. China's factory activity weakened to a
nine-month low in June as demand faltered, heightening risks that a
second quarter slowdown could be sharper than expected and raising the
heat on the central bank to loosen its monetary policy. China's flash
HSBC Purchasing Managers' Index fell to 48.3 in June from May's final
reading of 49.2. Regional markets are not immune from the global
trends and have been in a correction mode. In Qatar so far (YTD 2013)
foreign institutions have been the biggest buyers of equities (~QR2.3bn
YTD 2013 vs. net selling of QR2.5bn in 2012). However, we believe any
selling from the foreign institutional front can open up attractive
opportunities to accumulate stocks on dips.
Equity trading value during the week decreased by 47.03% to reach
QR1,823.5 million (mn), as compared to QR3,442.4mn in the prior
week. The Banks & Financial Services sector led the trading value during
the week, accounting for 33.53% of the total equity trading value.
Equity trading volume decreased by 45.35% to reach 48.7mn shares,
as against 89.0mn shares in the prior week. The number of
transactions fell by 30.27% to reach 21,802 transactions versus 31,267
transactions in the prior week. The Real Estate sector led the trading
volume, accounting for 41.60% of the total volume.
Foreign institutions turned bearish for the week with overall net selling
of QR46.0mn vs. net buying of QR265.8mn in the prior week. Foreign
individuals sold QR27.7mn (net) versus net selling of QR47.5mn in the prior
week. Qatari institutions turned bullish with net buying of QR117.3mn versus
net selling of QR46.5mn in the prior week. Qatari individuals remained
sellers with net selling of QR43.4mn as compared to QR171.8mn in the
prior week.
Market Indicators
Week ended
June 20, 2013
Week ended
June 13, 2013
Chg. %
Value Traded (QR mn) 1,823.5 3,442.4 (47.0)
Exch. Market Cap. (QR mn) 509,085.3 519,959.2 (2.1)
Volume (mn) 48.7 89.0 (45.3)
Number of Transactions 21,802 31,267 (30.3)
Companies Traded 41 41 0.0
Market Breadth 4:35 28:10 –
Market Indices Close WTD% MTD% YTD%
Total Return 13,210.68 (2.5) 0.1 16.8
All Share Index 2,342.04 (2.3) (0.1) 16.3
Banks/Financial Svcs. 2,196.05 (2.0) 0.4 12.7
Industrials 3,148.96 (1.9) (0.8) 19.9
Transportation 1,644.05 (4.1) (1.1) 22.7
Real Estate 1,853.88 (3.9) 3.4 15.0
Insurance 2,270.27 (2.6) (1.0) 15.6
Telecoms 1,278.97 (2.8) (0.6) 20.1
Consumer 5,480.57 (1.8) (1.4) 17.3
Al Rayan Islamic Index 2,811.07 (2.6) 0.8 13.0
Market Indices
Weekly Index Performance
Regional Indices Close WTD% MTD% YTD%
Weekly Exchange
Traded Value ($ mn)
Exchange Mkt.
Cap. ($ mn)
TTM P/E** P/B** Dividend Yield
Qatar (QE)* 9,246.19 (2.5) 0.1 10.6 500.76 139,794.8 11.7 1.7 5.0
Dubai 2,360.59 (1.6) (0.3) 45.5 668.31 60,635.5 15.2 1.0 3.6
Abu Dhabi 3,632.36 (0.8) 2.0 38.1 529.25 105,234.9 11.1 1.3 4.8
Saudi Arabia#
7,526.26 (1.3) 1.6 10.7 9,300.66 401,802.0 16.0 2.0 3.7
Kuwait 8,059.86 1.6 (2.9) 35.8 1,059.13 108,517.3 25.3 1.4 3.3
Oman 6,390.25 (2.6) (0.4) 10.9 90.80 22,368.7 10.9 1.7 4.4
Bahrain 1,201.69 0.3 0.4 12.8 21.03 21,341.9 8.8 0.8 4.1
Source: Bloomberg, country exchanges and Zawya (** Trailing Twelve Months; * Value traded ($ mn) do not include special trades, if any) (
#
Saudi Arabia's work week is from Saturday to Wednesday)
9,424.41
9,429.70
9,361.05 9,340.01
9,246.19
0
7,000,000
14,000,000
9,150
9,300
9,450
16-Jun 17-Jun 18-Jun 19-Jun 20-Jun
Volume QE Index
1.6%
0.3%
(0.8%)
(1.3%) (1.6%)
(2.5%) (2.6%)
(4.0%)
(2.0%)
0.0%
2.0%
Kuwait
Bahrain
AbuDhabi
SaudiArabia
Dubai
Qatar
Oman
2. Page 2 of 5
News
Economic News
Qatar monthly banking update – Deposits declined by 2.4%
MoM (+11.5% YTD) due to a 7.4% MoM drop in public sector
deposits, while loans increased by 1.2% MoM (+5.5% YTD) in
May 2013. Hence, the sector loan-to-deposit ratio (LDR) rose to
105% in May 2013 versus 102% at the end of April 2013.
(QCB)
QCB sets cap for bank investments in securities – Qatar
Central Bank (QCB) has set the cap for bank investments in
equity and debt securities at 25% of lenders‟ capital and
reserves. Further, the QCB has set a limit for investing in
individual companies at 5% of lenders‟ capital and reserves,
whereas, the limit of total securities investment outside Qatar is
set at 15%. The QCB has set the limit of total unlisted securities
at 10% inside Qatar and 5% abroad. Meanwhile, QCB has
exempted debt instruments issued by the Qatari government,
central bank, licensed national banks from these limits.
Moreover, QCB has set limit on property investment for Islamic
banks at 10% of capital, reserves, and limits on investments in
associates is set at 35%, including investments, financing, all
risk exposure and limit on investment in single associate
company at 25%. (Bloomberg)
QE introduces QCB bonds for trading – The Qatar Exchange
(QE) has introduced government bonds issued by the Qatar
Central Bank (QCB) for trading on the exchange commencing
on June 20, 2013. Bond trading has been initiated to support
the development of the financial market in Qatar on the one
hand, and diversification of investment tools available for
institutions and investors on the other. The trading of
government bonds follows the trading of treasury-bills, which
was launched in December 2011. At the launch of the
government bond market, four bonds will be available for
trading and it is expected that future quarterly issues will also
be listed on the market. (QE)
QCB elects board of directors – Qatar‟s Emir HH Sheikh
Hamad bin Khalifa al Thani has issued an Emiri decision to
form the board of directors for the Qatar Central Bank (QCB).
The QCB Governor Sheikh Abdullah bin Saud bin Abdulaziz al
Thani has been appointed as the Chairman and Deputy
Governor Sheikh Fahd bin Faisal bin Thani al Thani as the
Deputy Chairman. Other board members appointed are: Khalaf
Ahmed al Mannai, the representative of the Ministry of
Economy & Finance, Sultan Rashid al Khater, the
representative of the Ministry of Business & Trade, Dr Ibrahim
Ibrahim, Dr Saleh Mohammed al Nabit, and Nasser Ahmed al
Shaibi. (Qatar Tribune)
Market & Corporate News
GISS releases 5-year business plan; 2013 net income
guidance below expectations, however – Gulf International
Services (GISS) said it will continue to focus on organic
opportunities, principally around increasing medical insurance
market share & acquiring additional helicopters, rigs and other
related drilling services under its five year plan for 2013-17. The
company expects its revenue and net profit to increase
significantly over the planning period. Strong performance is
expected due to new assets deployment, new operations and
market development. Growth is expected across all segments
of the company. In 2013, GISS expects its revenue to reach
QR1,950.3mn, up roughly 25% YoY. Net income is however
expected to decline ~2% YoY to QR455.6mn (23.4% NM) vs.
QR464.3mn in 2012. This is lower than the consensus forecast
(caveat: one estimate) of QR534mn and also below its
annualized 1Q2013 net income of QR543mn. The company
expects a 2013 EBITDA of QR556.9mn (28.6% EBITDA
margin). GISS stated that its insurance & reinsurance sector
revenue is expected to touch QR0.7bn in 2013 and grow
moderately thereafter driven by a strong performance of the
medical line. The aviation services sector is expected to report
QR537mn revenue in 2013; it is expected to grow at a steady
pace thereafter. However, salaries and wage inflation of
~QR50m in 2013 will crimp profitability this year. Longer-term,
this segment will benefit from the new higher rate aircraft with
net fleet to grow to 51 (2017) vs. 41 (2012). Meanwhile, the
drilling services segment is expected to reach QR821.1mn in
2013, with long-term growth mainly on the back of new offshore
rigs and jack-up barge. This segment‟s net profit for 2013 will
rise sharply vs. 2012, and increase steadily thereafter. GISS
said its catering services segment‟s revenue will grow to
QR750mn in 2013 and subsequently grow moderately
thereafter. The growth in this segment will be driven by Qatar
Petroleum‟s new investment program. (GISS Press Release,
QNBFS)
QNB Group named Best Bank in Qatar and Middle East –
QNB Group has been awarded the “Best Bank in Qatar” title by
the Banker Middle East for the third consecutive year.
Additionally, the group has been recognized on the regional
level with the “Best Bank in the Middle East” award.
(GulfBase.com)
Ooredoo withdraws bid for Vivendi stake in Maroc Telecom
– Ooredoo (formerly QTEL) has withdrawn its bid for Vivendi‟s
53% stake in Moroccan telecom operator, Maroc Telecom,
leaving Emirates Telecommunications Corporation as the only
remaining bidder. Meanwhile, Vivendi is reportedly in talks to
sell its stake in Maroc Telecom to Emirates
Telecommunications Corp (Etisalat) after Ooredoo withdrew its
offer. (Bloomberg, GulfBase.com)
S&P affirms Ooredoo’s ratings with Negative outlook –
Standard & Poor's has affirmed Ooredoo‟s (formerly QTEL)
long and short-term corporate credit ratings at A/A-1 and QTEL
International Finance‟s senior unsecure debt at A, with a
Negative outlook. At the same time, S&P said these ratings
were removed from CreditWatch, where they had been placed
with negative implications. (Bloomberg)
Ooredoo to spend QR1bn on nationwide fiber connection
by 2014 – Ooredoo‟s (formerly QTEL) COO Waleed al Sayed
said the company is planning to spend QR1bn to ensure that all
households in Qatar are connected to a nationwide fiber optic
network by the end of 2014. He also said that Ooredoo is set to
launch its “Business Fibre” by 3Q2013, which is an ultra-fast
fiber optic network targeting businesses in Qatar and SMEs in
particular. (Qatar Tribune, Gulf-Times.com)
CBQK to dissolve Gekko – The Board of Directors of The
Commercial Bank of Qatar has reviewed the operating
performance of and future potential for, Gekko LLC (“the
Company”) and has approved the dissolution of the Company.
The Company was formed as a joint venture in which
Commercial. Bank owns 50% of the shares to market
contactless payment cards. The impact on the financial
performance of Commercial Bank will be minimal. (Bloomberg)
3. Page 3 of 5
Qatar Exchange
Top 5 Gainers Top 5 Decliners
Source: Qatar Exchange (QE) Source: Qatar Exchange (QE)
Most Active Shares by Value (QR Million) Most Active Shares by Volume (Million)
Source: Qatar Exchange (QE) Source: Qatar Exchange (QE)
Investor Trading Percentage to Total Value Traded Net Traded Value by Nationality (QR Million)
Source: Qatar Exchange (QE) Source: Qatar Exchange (QE)
1.8%
1.3%
1.2% 1.1%
0.0%
1.0%
2.0%
3.0%
Qatar Electricity
and Water
Qatar German Co.
for Medical
Devices
Qatar Industrial
Manufacturing
Qatar National
Cement
-8.8%
-4.8% -4.7% -4.7% -4.6%
-9.0%
-6.0%
-3.0%
0.0%
Gulf
International
Services
Gulf
Warehousing
Doha
Insurance
Barwa Real
Estate
Mazaya Qatar
Real Estate
Development
329.1
259.1
135.3 121.9 121.8
0.0
200.0
400.0
600.0
United
Development
Industries
Qatar
Commercial
Bank of Qatar
Barwa Real
Estate
Masraf Al
Rayan
13.7
4.5 4.5
3.8
1.9
0.0
6.0
12.0
18.0
United
Development
Barwa Real
Estate
Masraf Al
Rayan
Qatar Gas
Transport
(Nakilat)
Mazaya Qatar
Real Estate
Development
0%
20%
40%
60%
80%
100%
Buy Sell
37.69% 40.07%
28.54% 22.11%
11.65% 13.17%
22.12% 24.64%
Qatari Individuals Qatari Institutions
Non-Qatari Individuals Non-Qatari Institutions
1,208
616
1,134
689
74
(74)
(200) - 200 400 600 800 1,000 1,200 1,400
Qatari
Non-Qatari
Net Investment Total Sold Total Bought
4. Page 4 of 5
TECHNICAL ANALYSIS OF THE QE INDEX
Source: Bloomberg
The QE Index finished lower at the end of the week, losing about 234 points (-2.46%) breaking its eight-week long continuous uptrend. This week‟s rally
was short-lived, with the buying coming to a standstill since June 16. This week‟s heavy selling has threatened to completely erase all the gains
accumulated during the earlier weeks. The QE Index witnessed sustained selling pressure for most of the week and showed no signs of recovery. The index
ended the week below both its support levels of 9,310.54 and the 21-day moving average (currently at 9,284.12), which signals further downward
movement. The immediate support is seen near the psychological level of 9,200.0. However, any sustained weakness below the 9,200.0 level would lead to
a breakdown and will likely result in testing the 9,100.0 and 9,050.0 levels, as there is little support until then. On the flip side, if the index can manage to
hold above the 9,200 level and witness a bounce back, short-term gains may continue toward 9,400.0. Meanwhile, both the momentum indicators have
shown a bearish divergence, indicating that underlying selling pressure is mounting and is likely to sustain. Traders are advised to watch out for the support
levels, for any signs of further declines.
DEFINITIONS OF KEY TERMS USED IN TECHNICAL ANALYSIS
RSI (Relative Strength Index) indicator – RSI is a momentum oscillator that measures the speed and change of price movements. The RSI oscillates
between 0 to 100. The index is deemed to be overbought once the RSI approaches the 70 level, indicating that a correction is likely. On the other hand, if
the RSI approaches 30, it is an indication that the index may be getting oversold and therefore likely to bounce back.
MACD (Moving Average Convergence Divergence) indicator – The indicator consists of the MACD line and a signal line. The divergence or the
convergence of the MACD line with the signal line indicates the strength in the momentum during the uptrend or downtrend, as the case may be. When the
MACD crosses the signal line from below and trades above it, it gives a positive indication. The reverse is the situation for a bearish trend.
Candlestick chart – A candlestick chart is a price chart that displays the high, low, open, and close for a security. The „body‟ of the chart is portion between
the open and close price, while the high and low intraday movements form the „shadow‟. The candlestick may represent any time frame. We use a one-day
candlestick chart (every candlestick represents one trading day) in our analysis.
Doji candlestick pattern – A Doji candlestick is formed when a security's open and close are practically equal. The pattern indicates indecisiveness, and
based on preceding price actions and future confirmation, may indicate a bullish or bearish trend reversal.
Shooting Star/Inverted Hammer candlestick patterns – These candlestick patterns have a small real body (open price and close price are near to each
other), and a long upper shadow (large intraday movement on the upside). The Shooting Star is a bearish reversal pattern that forms after a rally. The
Inverted Hammer looks exactly like a Shooting Star, but forms after a downtrend. Inverted Hammers represent a potential bullish trend reversal.
5. Contacts
Ahmed M. Shehada Keith Whitney Saugata Sarkar Sahbi Kasraoui
Head of Trading Head of Sales Head of Research Manager - HNWI
Tel: (+974) 4476 6535 Tel: (+974) 4476 6533 Tel: (+974) 4476 6534 Tel: (+974) 4476 6544
ahmed.shehada@qnbfs.com.qa keith.whitney@qnbfs.com.qa saugata.sarkar@qnbfs.com.qa sahbi.alkasraoui@qnbfs.com.qa
QNB Financial Services SPC
Contact Center: (+974) 4476 6666
PO Box 24025, Doha, Qatar
DISCLAIMER: This publication has been prepared by QNB Financial Services SPC (“QNBFS”) a wholly-owned subsidiary of Qatar National Bank (“QNB”). QNBFS is regulated by the Qatar
Financial Markets Authority and the Qatar Exchange; QNB is regulated by the Qatar Central Bank. This publication expresses the views and opinions of QNBFS at a given time only. It is not an
offer, promotion or recommendation to buy or sell securities or other investments, nor is it intended to constitute legal, tax, accounting, or financial advice. We therefore strongly advise potential
investors to seek independent professional advice before making any investment decision. Although the information in this report has been obtained from sources that QNBFS believes to be
reliable, we have not independently verified such information and it may not be accurate or complete. While this publication has been prepared with the utmost degree of care by our analysts,
QNBFS does not make any representations warranties as to the accuracy and completeness of the information it may contain, and declines any liability in that respect. QNBFS reserves the right
to amend the views and opinions expressed in this publication at any time. It may also express viewpoints or make investment decisions that differ significantly from, or even contradict, the views
and opinions included in this report.
COPYRIGHT: No part of this document may be reproduced without the explicit written permission of QNBFS.
Page 5 of 5
Source: Bloomberg
Company Name
Price
(June 20)
% Change 5-
Day
% Change
Monthly
Market Cap.
QR Million TTM P/E P/B Div. Yield
Qatar National Bank 151.00 (1.69) 1.07 105,659 12.5 2.3 4.0
Qatar Islamic Bank 69.30 (2.26) 0.58 16,375 14.4 1.5 5.4
Commercial Bank of Qatar 69.60 (3.33) (0.43) 17,222 8.4 1.2 8.6
Doha Bank 46.95 (2.19) (1.16) 12,131 8.0 1.1 8.8
Al Ahli Bank 56.00 (1.41) 0.18 7,116 13.7 2.2 5.4
Qatar International Islamic Bank 53.60 (1.29) (0.37) 8,113 11.8 1.7 6.5
Masraf Al Rayan 27.30 (1.97) 0.18 20,475 13.2 2.2 3.7
Al Khaliji Bank 16.75 (0.95) (1.47) 6,030 11.6 1.1 6.0
National Leasing 37.45 (3.23) 2.60 1,853 9.0 1.5 5.3
Dlala Holding 27.80 (3.14) 4.51 617 24.0 2.6 N/A
Qatar & Oman Investment 13.40 (2.33) 4.69 422 21.5 1.4 3.7
Islamic Holding Group 38.20 (1.80) (6.83) 153 24.6 3.7 2.7
Banking and Financial Services 196,167
Zad Holding 60.10 (0.33) 0.84 786 7.4 0.6 6.7
Qatar German Co. for Medical Devices 15.80 1.28 7.48 182 N/M 1.0 N/A
Salam International Investment 13.00 0.00 0.00 1,486 21.8 0.9 5.4
Medicare Group 41.50 (2.12) 1.10 1,168 25.3 1.5 4.3
Qatar Cinema & Film Distribution 57.00 0.00 (2.56) 325 28.5 2.5 3.5
Qatar Fuel 252.40 (2.21) (1.79) 16,398 14.2 3.1 4.0
Qatar Meat and Livestock 62.90 (1.26) (0.47) 1,132 15.0 3.9 6.4
Al Meera Consumer Goods 136.40 (1.16) (2.57) 2,728 17.7 2.3 5.9
Consumer Goods and Services 24,207
Qatar Industrial Manufacturing 52.80 1.15 2.92 2,091 10.6 1.7 5.7
Qatar National Cement 101.00 1.10 0.00 4,959 11.6 2.2 5.9
Industries Qatar 162.90 (2.16) (2.28) 98,555 10.9 3.5 4.7
Qatari Investors Group 26.60 (1.66) 5.98 3,307 19.3 1.7 2.8
Qatar Electricity and Water 156.00 1.76 7.59 15,600 11.6 3.2 4.7
Mannai Corp. 88.00 0.00 3.53 4,014 8.5 1.9 5.4
Aamal 14.31 (2.52) (1.31) 8,586 14.0 1.3 N/A
Gulf International Services 42.50 (8.80) (9.57) 6,319 12.4 2.5 3.5
Industrials 143,431
Qatar Insurance 62.10 (2.97) (2.97) 7,976 9.1 1.2 3.2
Doha Insurance 26.20 (4.73) 2.54 674 11.2 1.4 3.5
Qatar General Insurance & Reinsurance 48.25 (0.52) 0.52 2,781 15.3 1.1 1.8
Al Khaleej Takaful Insurance 43.20 (4.21) 6.67 738 9.9 1.3 1.9
Qatar Islamic Insurance 60.90 (2.40) 5.00 914 15.5 3.8 5.7
Insurance 13,083
United Development 23.35 (2.83) 8.60 7,874 9.8 0.8 4.3
Barwa Real Estate 26.50 (4.68) 0.00 10,312 12.6 0.8 5.7
Ezdan Real Estate 17.40 (1.14) 0.23 46,153 N/M 1.7 0.7
Mazaya Qatar Real Estate Development 11.21 (4.60) 1.36 1,121 20.5 1.0 5.4
Real Estate 65,460
Qatar Telecom 121.60 (2.72) (0.08) 38,951 12.3 1.6 4.1
Vodafone Qatar 9.01 (3.43) (3.84) 7,617 N/M 1.2 N/A
Telecoms 46,568
Qatar Navigation (Milaha) 71.80 (4.27) (1.64) 8,223 9.2 0.8 5.2
Gulf Warehousing 41.50 (4.82) (0.84) 1,974 22.6 2.7 N/A
Qatar Gas Transport (Nakilat) 17.81 (3.73) (0.78) 9,974 12.9 5.8 5.6
Transportation 20,170
Qatar Exchange 509,085