QNBFS Weekly Market Report September 12, 2019
•
0 gefällt mir•90 views

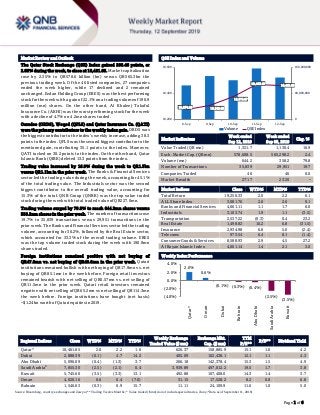
The Qatar Stock Exchange (QSE) Index gained 208.46 points, or 2.03% during the week, to close at 10,461.65

Empfohlen
Empfohlen
Weitere ähnliche Inhalte
Mehr von QNB Group
Mehr von QNB Group (20)
Kürzlich hochgeladen
Kürzlich hochgeladen (20)
QNBFS Weekly Market Report September 12, 2019
- 1. ` Page 1 of 6 Market Review and Outlook QSE Index and Volume The Qatar Stock Exchange (QSE) Index gained 208.46 points, or 2.03% during the week, to close at 10,461.65. Market capitalization rose by 2.35% to QR578.6 billion (bn) versus QR565.3bn the previous trading week. Of the 46 listed companies, 27 companies ended the week higher, while 17 declined and 2 remained unchanged. Ezdan Holding Group (ERES) was the best performing stockfortheweekwithagainof22.1%onatradingvolumeof190.9 million (mn) shares. On the other hand, Al Khaleej Takaful Insurance Co. (AKHI) was the worst performing stock for the week with a decline of 4.7% on 4.2mn shares traded. Ooredoo (ORDS), Woqod (QFLS) and Qatar Insurance Co. (QATI) were the primary contributors to the weekly index gain. ORDS was the biggest contributor to the index’s weekly increase, adding 38.3 points to the index. QFLS was the second biggest contributor to the mentioned gain, contributing 35.1 points to the index. Moreover, QATI tacked on 30.2 points to the index. On the other hand, Qatar Islamic Bank (QIBK) deleted 13.3 points from the index. Trading value increased by 16.9% during the week to QR1.3bn versus QR1.1bn in the prior week. The Banks & Financial Services sector led the trading value during the week, accounting for 45.1% of the total trading value. The Industrials sector was the second biggest contributor to the overall trading value, accounting for 15.3% of the total. QNB Group (QNBK) was the top value traded stock during the week with total traded value of QR227.0mn. Trading volume surged by 79.8% to reach 644.2mn shares versus 358.2mn shares in the prior week. The number of transactions rose 19.7% to 35,839 transactions versus 29,951 transactions in the prior week. The Banks and Financial Services sector led the trading volume, accounting for 36.2%, followed by the Real Estate sector, which accounted for 33.3% of the overall trading volume. ERES was the top volume traded stock during the week with 190.9mn shares traded. Foreign institutions remained positive with net buying of QR47.9mn vs. net buying of QR40.6mn in the prior week. Qatari institutions remained bullish with net buying of QR17.9mn vs. net buying of QR85.1mn in the week before. Foreign retail investors remained bearish with net selling of QR0.57mn vs. net selling of QR11.5mn in the prior week. Qatari retail investors remained negative with net selling of QR65.2mn vs net selling of QR114.3mn the week before. Foreign institutions have bought (net basis) ~$1.24bn worth of Qatari equities in 2019. Market Indicators Week ended Sep 12, 2019 Week ended Sep 05, 2019 Chg. % Value Traded (QR mn) 1,321.7 1,130.4 16.9 Exch. Market Cap. (QR mn) 578,608.5 565,298.2 2.4 Volume (mn) 644.2 358.2 79.8 Number of Transactions 35,839 29,951 19.7 Companies Traded 46 46 0.0 Market Breadth 27:17 23:20 – Market Indices Close WTD% MTD% YTD% Total Return 19,250.33 2.0 2.2 6.1 ALL Share Index 3,081.76 2.6 2.6 0.1 Banks and Financial Services 4,061.11 1.1 1.7 6.0 Industrials 3,103.74 1.9 1.1 (3.5) Transportation 2,537.22 (0.3) 0.4 23.2 Real Estate 1,498.82 10.2 6.8 (31.5) Insurance 2,934.98 6.8 5.0 (2.4) Telecoms 973.54 6.4 8.1 (1.4) Consumer Goods & Services 8,588.93 2.9 4.5 27.2 Al Rayan Islamic Index 4,001.14 1.4 2.1 3.0 Market Indices Weekly Index Performance Regional Indices Close WTD% MTD% YTD% Weekly Exchange Traded Value ($ mn) Exchange Mkt. Cap. ($ mn) TTM P/E** P/B** Dividend Yield Qatar* 10,461.65 2.0 2.2 1.6 626.37 158,885.9 15.1 1.6 4.2 Dubai 2,888.39 (0.1) 4.7 14.2 405.09 102,438.1 12.1 1.1 4.3 Abu Dhabi 5,096.09 (0.4) (1.3) 3.7 266.18 142,378.4 15.3 1.5 4.9 Saudi Arabia# 7,855.30 (2.5) (2.1) 0.4 3,939.89 497,012.2 19.5 1.7 3.8 Kuwait 5,745.60 (3.5) (3.3) 13.1 492.88 107,408.0 14.3 1.4 3.7 Oman 4,020.16 0.6 0.4 (7.0) 31.15 17,528.2 8.2 0.8 6.8 Bahrain 1,546.63 (0.3) 0.9 15.7 11.11 24,109.9 11.6 1.0 5.0 Source: Bloomberg, country exchanges and Zawya (** Trailing Twelve Months; * Value traded ($ mn) do not include special trades, if any; #Data as of September 11, 2019) 10,274.85 10,309.03 10,375.67 10,466.49 10,461.65 0 80,000,000 160,000,000 10,200 10,400 10,600 8-Sep 9-Sep 10-Sep 11-Sep 12-Sep Volume QSE Index 2.0% 0.6% (0.1%) (0.3%) (0.4%) (2.5%) (3.5%) (4.0%) (2.0%) 0.0% 2.0% 4.0% Qatar* Oman Dubai Bahrain AbuDhabi SaudiArabia Kuwait
- 2. Page 2 of 6 News Economic & Market News QSE CEO: Baladna may IPO this month or in October – Qatari food producer Baladna may list shares this month or in October, according to Qatar Stock Exchange’s (QSE) CEO, Rashid bin Ali Al-Mansoori. He added that the exchange will sees more IPO activity next year. The bourse aims to attract education, healthcare, industrial sector companies for new listings. New financial instruments, such as market making, were introduced to draw foreign investors. (Bloomberg) Methodology change to all QSE indices, effective from October 1 – Qatar Stock Exchange (QSE) hereby informs of a methodology change to all QSE indices effective October 1, 2019, as approved by QSE Index Committee and QFMA. The rule amendment relates to the Index Free Float definition as applied for index components calculation. The Index Free Float definition reads as follows: Index Free Float for a stock is defined as the total outstanding shares less – (i) Shares directly owned by the Government and affiliated entities, (ii) Shares held by founders and board members of the company, and (iii) Shareholdings which are 10% or greater of the total outstanding shares except those held by pension funds in Qatar. (QSE) CEO: The Commercial Bank to issue bonds worth up to $700mn – The Commercial Bank is set to issue bonds worth up to $700mn (about QR2.55bn) to fund some domestic as well as overseas projects and other activities, according to the Group CEO, Joseph Abraham. The bank, in December last year, had announced that it could raise up to $1bn (QR3.64bn) in debt in 2019 to further diversify its funding sources. Abraham said, “We are looking forward to issue bonds worth between $600mn and $700mn. But we do not know the exact date, and waiting for the right time and the interest rates. Since the interests rates are going down, so we will see when we can issue it.” Commenting on the bank’s activities and future outlook of the nature of its services, he noted that services at the bank’s branches are going to witness major transformation. The number of physical transactions at branches is fast changing. More and more people are doing online transactions. However, the CEO of the bank also noted that people still want branches and they are visiting them. “We expect the nature of services at bank’s branches is transforming from being transactional to be more advisory. As the number of people with surplus wealth and savings is growing fast, they want to go beyond deposits. They want different types of products such as wealth management, insurance, stocks and other types of products that ensure better returns,” he added. (Peninsula Qatar) Qatar’s banks eased property loan repayments, Doha Bank CEO says – Qatar’s banks eased repayment terms on real-estate loans, according to Doha Bank’s CEO, Raghavan Seetharaman, after the Saudi Arabia-led standoff hurt property prices. “Cash flows have been redefined, debt has been restructured to see that debt-servicing capacity is not in danger in the coming days for real estate owners. Banks are also cautious in terms of overall lending for real estate,” Seetharaman said. Home prices are going through a minor correction, but retail real estate prices have held up well, he added. (Bloomberg) Al-Kaabi: Qatar shortlists partners for North Field expansion, but says it may go it alone – Qatar has shortlisted international oil firms for a stake in its expanded North Field megaproject, Qatar Petroleum’s CEO, said, but may still choose to go it alone unless majors offer it significant value. The expansion of tiny but gas-rich Qatar’s liquefied natural gas (LNG) facilities, already the world’s largest, is one of the energy sector’s most lucrative projects, and the world’s top oil and gas majors have been racing to secure a stake. Invitations to bid were sent out last month and the result is due to be announced in the first quarter of 2020, Saad Al-Kaabi, who is also Minister of state for energy, said - if Qatar decides to go with partners at all. “We like the partnership model for many benefits. But because we don’t need the partners, what’s going out is basically a set of criteria that we have, to demonstrate to us what added value we get for Qatar if you come in,” Al- Kaabi said. “Maybe they can give us something outside,” he said, referring to LNG assets outside its domestic market. Al-Kaabi said that with the remaining contracts for its completion set to be awarded by the end of 2019, it was now asking a shortlist of majors to bid for a stake in the completed project. (Gulf-Times.com) Qatar Electricity & Water Company (QEWS) gets QR1.6bn loan from eight foreign banks – QEWS gets QR1.6bn loan from eight foreign banks. The loan will be used to finance the expansion of Umm Al Hol plant. (Bloomberg) BRES’ Al Baraha warehouses and workshops to be leased mid- September – Barwa Real Estate Company (BRES) will lease 561 warehouses and 118 workshops it has completed as part of the Barwa Al Baraha project from mid-September onwards. The total land area of the project is 684,134 square meters and is located within the Barwa Al Baraha behind the Labor City in Industrial Area (number 91). The total construction area of the project is around 193,000 square meters and includes 561 warehouses with an area of 300 square meters each and 118 workshops with an area of 144 square meter each. In addition, the project features necessary amenities such as CCTV rooms, two electrical substations, internal roads and networks for potable water, fire-fighting and sewage. The project is part of BRES’ efforts to provide a regular industrial environment for light industries with work and storage spaces in line with the requirements of its employees. The project will have a vital and positive role in the urban development of the region by attracting commercial and industrial activities concentrated in one place to be an innovative solution with a new integrated vision in terms of providing all necessary services and support. (Qatar Tribune)
- 3. Page 3 of 6 Qatar Stock Exchange Top Gainers Top Decliners Source: Qatar Stock Exchange (QSE) Source: Qatar Stock Exchange (QSE) Most Active Shares by Value (QR Million) Most Active Shares by Volume (Million) Source: Qatar Stock Exchange (QSE) Source: Qatar Stock Exchange (QSE) Investor Trading Percentage to Total Value Traded Net Traded Value by Nationality (QR Million) Source: Qatar Stock Exchange (QSE) Source: Qatar Stock Exchange (QSE) 22.1% 15.2% 9.1% 8.2% 7.8% 0.0% 8.0% 16.0% 24.0% Ezdan Holding Group Qatar First Bank Ooredoo Qatar Insurance Company Qatar Aluminium Manufacturing Company -4.7% -3.5% -3.5% -2.4% -2.4% -6.0% -4.0% -2.0% 0.0% Al KhaleejTakaful Insurance Co. Medicare Group Zad Holding Company IslamicHolding Group QatarNavigation 227.0 124.7 98.8 88.8 82.5 0.0 90.0 180.0 270.0 QNB Group Ezdan Holding Group Qatar International Islamic Bank Ooredoo The Commercial Bank 190.9 156.0 40.7 32.3 23.7 0.0 70.0 140.0 210.0 Ezdan Holding Group Qatar First Bank Aamal Company Qatar Aluminium Manufacturing Company Qatar Gas Transport Co. Ltd. 0% 20% 40% 60% 80% 100% Buy Sell 28.29% 33.23% 26.66% 25.30% 11.55% 11.59% 33.51% 29.88% Qatari Individuals Qatari Institutions Non-Qatari Individuals Non-Qatari Institutions 726 595 774 548 (47) 47 (200) - 200 400 600 800 1,000 Qatari Non-Qatari Net Investment Total Sold Total Bought
- 4. Page 4 of 6 TECHNICAL ANALYSIS OF THE QSE INDEX Source: Bloomberg The QE Index closed up by 2.03 from the week before, and closed at 10,461.65 points. The Index kept moving inside the corrective channel and bounced off the strong support just at the 9,700 level. We keep our expected weekly-resistance level at 10,800 points and the 9,700 level as our weekly support. DEFINITIONS OF KEY TERMS USED IN TECHNICAL ANALYSIS RSI (Relative Strength Index) indicator – RSI is a momentum oscillator that measures the speedand change of price movements. The RSI oscillates between 0 to 100. The index is deemed to be overbought once the RSI approaches the 70 level, indicating that a correction is likely. On the other hand, if the RSI approaches 30, it is an indication that the index may be getting oversold and therefore likely to bounce back. MACD (Moving Average Convergence Divergence) indicator – The indicator consists of the MACD line and a signal line. The divergence or the convergence of the MACD line with the signal line indicates the strength in the momentum during the uptrend or downtrend, as the case may be. When the MACD crosses the signal line from below and trades above it, it gives a positive indication. The reverse is the situation for a bearish trend. Candlestick chart – A candlestick chart is a price chart that displays the high, low, open, and close for a security. The ‘body’ of the chart is portion between the open and close price, while the high and low intraday movements form the ‘shadow’. The candlestick may represent any time frame. We use a one-day candlestick chart (every candlestick represents one trading day) in our analysis. Doji candlestick pattern – A Doji candlestick is formed when a security's open and close are practically equal. The pattern indicates indecisiveness, and based on preceding price actions and future confirmation, may indicate a bullish or bearish trend reversal. ShootingStar/Inverted Hammer candlestick patterns – These candlestick patterns have a small real body (open price and close price are near to each other), and a long upper shadow (large intraday movement on the upside). The Shooting Star is a bearish reversal pattern that forms after a rally. The Inverted Hammer looks exactly like a Shooting Star, but forms after a downtrend. Inverted Hammers represent a potential bullish trend reversal.
- 5. Page 5 of 6 Source: Bloomberg Company Name Price September 12 % Change WTD % Change YTD Market Cap. QR Million TTM P/E P/B Div. Yield Qatar National Bank 19.45 0.93 (0.26) 179,649 14.0 2.7 3.1 Qatar Islamic Bank 16.10 (1.11) 5.92 38,043 14.4 2.4 3.1 Commercial Bank of Qatar 4.56 3.87 15.77 18,455 12.4 1.1 3.3 Doha Bank 2.68 (2.19) 20.72 8,309 12.5 0.9 3.7 Al Ahli Bank 3.45 3.92 35.54 7,983 11.8 1.4 2.6 Qatar International Islamic Bank 8.96 4.80 35.51 13,563 15.9 2.4 4.5 Masraf Al Rayan 3.61 2.27 (13.39) 27,075 12.6 2.1 5.5 Al Khaliji Bank 1.18 0.85 2.25 4,248 7.4 0.7 6.4 Qatar First Bank 0.33 15.25 (20.34) 650 N/A 0.9 N/A National Leasing 0.69 5.67 (21.50) 341 47.0 0.5 7.2 Dlala Holding 0.69 (1.00) (31.00) 196 N/A 0.9 N/A Qatar & Oman Investment 0.51 1.19 (4.49) 161 50.8 0.5 5.9 Islamic Holding Group 2.00 (2.44) (8.47) 113 312.1 0.8 N/A Banking and Financial Services 298,787 Zad Holding 13.41 (3.46) 28.94 1,930 14.9 2.2 6.3 Qatar German Co. for Medical Devices 0.63 2.44 11.31 73 N/A 2.1 N/A Salam International Investment 0.42 (0.72) (4.16) 474 N/A 0.4 N/A Medicare Group 7.53 (3.46) 19.33 2,119 27.0 2.2 23.9 Qatar Cinema & Film Distribution 2.16 (1.82) 13.56 136 17.3 1.0 6.8 Qatar Fuel 23.11 5.28 39.23 22,977 19.1 2.9 3.5 Qatar Meat and Livestock 6.29 2.28 (10.14) 1,132 10.2 3.5 7.2 Mannai Corp. 3.43 (0.87) (37.58) 1,565 4.8 0.6 5.8 Al Meera Consumer Goods 15.40 (0.19) 4.05 3,080 16.7 2.3 5.5 Consumer Goods and Services 33,486 Qatar Industrial Manufacturing 3.21 (0.93) (24.82) 1,525 10.6 1.0 7.8 Qatar National Cement 5.79 2.48 (2.69) 3,784 14.3 1.3 8.6 Industries Qatar 11.10 2.30 (16.92) 67,155 16.9 2.0 5.4 Qatari Investors Group 1.94 4.30 (30.24) 2,412 17.4 0.9 3.9 Qatar Electricity and Water 15.33 3.58 (17.14) 16,863 12.6 1.8 5.1 Aamal 0.73 (0.68) (17.08) 4,618 11.7 0.6 8.2 Gulf International Services 1.64 2.50 (3.53) 3,048 N/A 0.9 N/A Mesaieed Petrochemical Holding 2.80 0.00 86.29 35,177 34.2 2.4 2.9 Invesment Holding Group 0.52 3.59 6.34 432 7.5 0.5 4.8 Qatar Aluminum Manufacturing 0.82 7.78 (38.80) 4,559 N/A N/A 2.4 Industrials 139,572 Qatar Insurance 3.31 8.17 (7.80) 10,811 18.6 1.3 4.5 Doha Insurance 1.05 0.00 (19.79) 525 8.7 0.5 7.6 Qatar General Insurance & Reinsurance 3.92 (1.75) (12.66) 3,430 16.2 0.5 2.6 Al Khaleej Takaful Insurance 1.83 (4.69) 113.04 467 15.0 0.9 2.7 Qatar Islamic Insurance 6.08 1.33 13.20 912 13.0 2.6 5.8 Insurance 16,145 United Development 1.37 (0.72) (7.12) 4,851 10.4 0.5 7.3 Barw a Real Estate 3.40 0.89 (14.81) 13,230 8.7 0.7 7.4 Ezdan Real Estate 0.70 22.07 (46.30) 18,488 62.4 0.6 N/A Mazaya Qatar Real Estate Development 0.74 2.90 (4.62) 861 N/A 0.7 6.7 Real Estate 37,430 Ooredoo 7.78 9.12 3.73 24,921 14.5 1.1 3.2 Vodafone Qatar 1.25 0.81 (19.97) 5,284 36.2 1.2 4.0 Telecoms 30,205 Qatar Navigation (Milaha) 5.76 (2.37) (12.74) 6,597 12.2 0.5 5.2 Gulf Warehousing 4.80 (0.83) 24.77 281 15.0 1.7 4.0 Qatar Gas Transport (Nakilat) 2.45 0.82 36.64 13,574 14.7 2.2 4.1 Transportation 20,452 Qatar Exchange 578,608
- 6. Contacts Saugata Sarkar, CFA, CAIA Shahan Keushgerian Zaid al-Nafoosi , CMT, CFTe Head of Research Senior Research Analyst Senior Research Analyst Tel: (+974) 4476 6534 Tel: (+974) 4476 6509 Tel: (+974) 4476 6535 saugata.sarkar@qnbfs.com.qa shahan.keushgerian@qnbfs.com.qa zaid.alnafoosi@qnbfs.com.qa Mehmet Aksoy, PhD QNB Financial Services Co. W.L.L. Senior Research Analyst Contact Center: (+974) 4476 6666 Tel: (+974) 4476 6589 PO Box 24025 mehmet.aksoy@qnbfs.com.qa Doha, Qatar Disclaimer and Copyright Notice: This publication has been prepared by QNB Financial Services Co. W.L.L. (“QNB FS”) a wholly-owned subsidiary of Qatar National Bank (Q.P.S.C.). QNB FS is regulated by the Qatar Financial Markets Authority and the Qatar Exchange. Qatar National Bank (Q.P.S.C.) is regulated by the Qatar Central Bank. This publication expresses the views and opinions of QNB FS at a given time only. It is not an offer, promotion or recommendation to buy or sell securities or other investments, nor is it intended to constitute legal, tax, accounting, or financial advice. QNB FS accepts no liability whatsoever for any direct or indirect losses arising from use of this report. Any investment decision should depend on the individual circumstances of the investor and be based on specifically engaged investment advice. We therefore strongly advise potential investors to seek independent professional advice before making any investment decision. Although the information in this report has been obtained from sources that QNB FS believes to be reliable, we have not independently verified such information and it may not be accurate or complete. QNB FS does not make any representations or warranties as to the accuracy and completeness of the information it may contain, and declines any liability in that respect. For reports dealing with Technical Analysis, expressed opinions and/or recommendations may be different or contrary to the opinions/recommendations of QNB FS Fundamental Research as a result of depending solely on the historical technical data (price and volume). QNB FS reserves the right to amend the views and opinions expressed in this publication at any time. It may also express viewpoints or make investment decisions that differ significantly from, or even contradict, the views and opinions included in this report. This report may not be reproduced in whole or in part without permission from QNB FS COPYRIGHT: No part of this document may be reproduced without the explicit written permission of QNB FS. Page 6 of 6