QNBFS Weekly Market Report October 18, 2018
•
0 gefällt mir•29 views

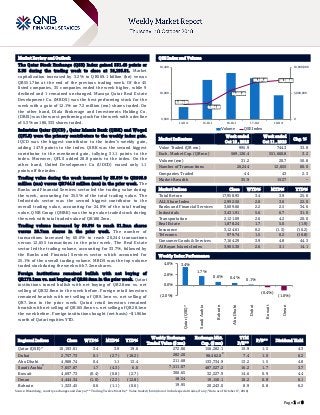
The Qatar Stock Exchange (QSE) Index gained 331.48 points or 3.36 during the trading week to close at 10,193.01.

Empfohlen
Empfohlen
Weitere ähnliche Inhalte
Mehr von QNB Group
Mehr von QNB Group (20)
Kürzlich hochgeladen
Kürzlich hochgeladen (20)
QNBFS Weekly Market Report October 18, 2018
- 1. ` Page 1 of 8 Market Review and Outlook QSE Index and Volume The Qatar Stock Exchange (QSE) Index gained 331.48 points or 3.36 during the trading week to close at 10,193.01. Market capitalization increased by 3.2% to QR569.1 billion (bn) versus QR551.7bn at the end of the previous trading week. Of the 45 listed companies, 35 companies ended the week higher, while 9 declined and 1 remained unchanged. Mazaya Qatar Real Estate Development Co. (MRDS) was the best performing stock for the week with a gain of 12.1% on 7.2 million (mn) shares traded. On the other hand, Dlala Brokerage and Investments Holding Co. (DBIS) was the worst performing stock for the week with a decline of 5.3% on 186,333 shares traded. Industries Qatar (IQCD) , Qatar Islamic Bank (QIBK) and Woqod (QFLS) were the primary contributors to the weekly index gain. IQCD was the biggest contributor to the index’s weekly gain, adding 147.9 points to the index. QIBK was the second biggest contributor to the mentioned gain, tallying 31.1 points to the index. Moreover, QFLS added 28.8 points to the index. On the other hand, United Development Co (UDCD) erased only 1.1 points off the index. Trading value during the week increased by 33.8% to QR995.9 million (mn) versus QR744.3 million (mn) in the prior week. The Banks and Financial Services sector led the trading value during the week, accounting for 35.5% of the total trading value. The Industrials sector was the second biggest contributor to the overall trading value, accounting for 24.0% of the total trading value. QNB Group (QNBK) was the top value traded stock during the week with total traded value of QR186.3mn. Trading volume increased by 50.8% to reach 31.2mn shares versus 20.7mn shares in the prior week. The number of transactions increased by 60.0% to reach 20,244 transactions versus 12,655 transactions in the prior week. The Real Estate sector led the trading volume, accounting for 33.7%, followed by the Banks and Financial Services sector which accounted for 25.1% of the overall trading volume. MRDS was the top volume traded stock during the week with 7.2mn shares. Foreign institutions remained bullish with net buying of QR172.1mn vs. net buying of QR68.0mn in the prior week. Qatari institutions turned bullish with net buying of QR2.8mn vs. net selling of QR32.8mn in the week before. Foreign retail investors remained bearish with net selling of QR9.1mn vs. net selling of QR7.1mn in the prior week. Qatari retail investors remained bearish with net selling of QR165.8mn vs. net selling of QR28.1mn the week before. Foreign institutions bought (net basis) ~$1.96bn worth of Qatari equities YTD. Market Indicators Week ended Oct 18 , 2018 Week ended Oct 11 , 2018 Chg. % Value Traded (QR mn) 995.9 744.3 33.8 Exch. Market Cap. (QR mn) 569,126.4 551,660.8 3.2 Volume (mn) 31.2 20.7 50.8 Number of Transactions 20,244 12,655 60.0 Companies Traded 44 43 2.3 Market Breadth 35:9 15:27 – Market Indices Close WTD% MTD% YTD% Total Return 17,958.95 3.4 3.9 25.6 ALL Share Index 2,992.56 2.8 3.6 22.0 Banks and Financial Services 3,609.66 2.2 2.5 34.6 Industrials 3,431.91 5.6 6.7 31.0 Transportation 2,121.09 2.6 4.2 20.0 Real Estate 1,878.24 1.7 5.0 (1.9) Insurance 3,124.61 0.2 (1.3) (10.2) Telecoms 979.74 1.5 0.2 (10.8) Consumer Goods & Services 7,164.29 3.9 4.8 44.3 Al Rayan Islamic Index 3,905.30 2.6 3.1 14.1 Market Indices Weekly Index Performance Regional Indices Close WTD% MTD% YTD% Weekly Exchange Traded Value ($ mn) Exchange Mkt. Cap. ($ mn) TTM P/E** P/B** Dividend Yield Qatar (QSE)* 10,193.01 3.4 3.9 19.6 272.66 156,282.1 15.9 1.5 4.3 Dubai 2,757.73 0.1 (2.7) (18.2) 282.20 98,462.0# 7.4 1.0 6.2 Abu Dhabi 4,988.74 0.4 1.1 13.4 211.68 133,734.9 13.2 1.5 4.8 Saudi Arabia# 7,657.87 1.7 (4.3) 6.0 7,511.07 487,527.2 16.2 1.7 3.7 Kuwait 4,697.73 (0.4) (0.8) (2.7) 300.65 32,227.9 14.6 0.9 4.4 Oman 4,444.34 (1.0) (2.2) (12.8) 18.54 19,150.1 10.2 0.8 6.1 Bahrain 1,323.45 0.6 (1.1) (0.6) 19.95 20,243.0 8.9 0.8 6.2 Source: Bloomberg, country exchanges and Zawya (** Trailing Twelve Months; * Value traded ($ mn) do not include special trades, if any; # Data as of October 17, 2018) 9,824.20 9,834.12 10,031.59 10,157.48 10,193.01 0 5,000,000 10,000,000 9,600 10,000 10,400 14-Oct 15-Oct 16-Oct 17-Oct 18-Oct Volume QSE Index 3.4% 1.7% 0.6% 0.4% 0.1% (0.4%) (1.0%)(2.0%) 0.0% 2.0% 4.0% Qatar(QSE)* SaudiArabia Bahrain AbuDhabi Dubai Kuwait Oman
- 2. Page 2 of 8 News Economic & Market News QIBK posts 11.5% YoY increase but 2.9% QoQ decline in net profit in 3Q2018, in-line with our estimate – Qatar Islamic Bank's (QIBK) net profit rose 11.5% YoY (but declined 2.9% on QoQ basis) to QR680.0mn in 3Q2018, in line with our estimate of QR664.1mn (variation of +2.4%). Total net income from financing and investing activities increased 11.2% YoY and 0.9% QoQ in 3Q2018 to QR1,551.0mn. The company's total income came in at QR1,740.2mn in 3Q2018, which represents an increase of 10.4% YoY (+0.5% QoQ). EPS amounted to QR2.88 in 3Q2018 as compared to QR2.58 in 3Q2017 and QR2.96 in 2Q2018. Financing assets were QR106.4bn, registering an increase of 3.7% YTD (+6.1% QoQ) at the end of September 30, 2018. Customers' deposits expanded 4.0% QoQ and 1.0% YTD to QR102.9bn at the end of September 30, 2018. In 9M2018, QIBK’s net profit exceeded QR2bn, which represents 13% growth on the same period in 2017. Total income was QR5.1bn, which QIBK stated indicated growth of 8.2% on QR4.7bn registered in the same period last year. Income from financing and investing activities grew 8.3% to reach QR4.5bn. In comparison, QIBK earned QR4.1bn as income from financing and investing activities in the same period in 2017. This reflects a “healthy growth” in the bank’s core operating activities, QIBK stated. QIBK was able to maintain the ratio of non-performing financing assets to total financing assets at 1.1% reflecting the quality of the bank’s financing assets portfolio and its effective risk management framework. The bank stated it continues to pursue the “conservative impairment provisioning policy” with the coverage ratio for non-performing financing assets at 127.9% as of September 2018. Total shareholders’ equity of the bank reached QR15.1bn in September, QIBK stated. Total capital adequacy of QIBK (under Basel III guidelines) was 17.7% as of September 2018, higher than the minimum regulatory requirements prescribed by the Qatar Central Bank and the Basel Committee. (QSE, QNBFS Research, Gulf-Times.com) DHBK posts 19.9% YoY decrease but QoQ surge in net profit in 3Q2018, beating our estimate – Doha Bank's (DHBK) net profit declined 19.9% YoY (but surged on QoQ basis) to QR266.8mn in 3Q2018, beating our estimate of QR191.6mn due to lower than expected provisions. Net operating income before provisions came in line at QR422.2mn vs. our estimate QR417.6mn (+1.1% variation). Net interest income decreased 6.7% YoY and 0.2% QoQ in 3Q2018 to QR520.9mn. The company's revenue came in at QR664.7mn in 3Q2018, which represents a decrease of 7.7% YoY (-0.3% QoQ). EPS amounted to QR0.86 in 3Q2018 as compared to QR1.15 in 3Q2017 and QR0.29 in 2Q2018. The bank's total assets stood at QR90.4bn at the end of September 30, 2018, down 2.2% YoY. However, on QoQ basis, the bank's total assets increased 1.4%. Loans and advances to customers were QR59.2bn, registering an increase of 2.2% QoQ (-1.1% YTD) at the end of September 30, 2018. Customer deposits declined 12.8% YTD to reach QR51.9bn at the end of September 30, 2018. However, on QoQ basis, customer deposits rose 0.6%. In 9M2018, DHBK posted net profit of QR737mn, after taking significant loan loss provision in relation to the bank’s overseas branches. In the same period last year, DHBK’s net profit stood at QR1.05bn. Interest income significantly grew by 10.6% as compared to the same period last year to reach QR2.9bn.The net operating income stood at QR2.03bn. Further, DHBK said it “has adequate loan loss provision against non-performing loans.” The investment portfolio amounted to QR20bn, registering an increase of 14%. DHBK’s Managing Director, Sheikh Abdul Rehman bin Mohamed bin Jabor Al- Thani said, “The total shareholder’s equity stood at QR13bn as of September 30, 2018, and through the strategic utilization of the shareholder’s funds by way of increasing our performance levels the return on average shareholders’ equity is 10.3% as of September 30. The bank, given the scale of operations, has achieved a return on the average assets of 1.07% as of September 30.” Highlighting DHBK’s key initiatives and innovations, CEO, R Seetharaman said, “DHBK looks to set the industry standard and continually explore new financial instruments that drive maximum value.” (QSE, QNBFS Research, Gulf-Times.com) QEWS' net profit declines 31.3% YoY and 17.8% QoQ in 3Q2018, missing our estimate – Qatar Electricity & Water Company's (QEWS) net profit declined 31.3% YoY (-17.8% QoQ) to QR343.8mn in 3Q2018, missing our estimate of QR452.6mn (variation of -24.0%). The company's revenue came in at QR671.5mn in 3Q2018, which was more in-line with our estimate of QR697.9mn (divergence: -3.8%); revenue for 3Q2018 represents a decrease of 18.7% YoY (-1.9% QoQ). EPS amounted to QR3.13 in 3Q2018 as compared to QR4.55 in 3Q2017 and QR3.80 in 2Q2018. Lower-than-expected gross margins of 53%, along with a decline in JV income (-36.4% YoY, -31.2% QoQ) impacted results for the quarter. We will update our estimates after we speak to management. (QSE, QNBFS Research, Peninsula Qatar) UDCD posts 18.2% YoY decrease but 170.6% QoQ increase in net profit in 3Q2018 – United Development Company's (UDCD) net profit declined 18.2% YoY (but rose 170.6% on QoQ basis) to QR124.3mn in 3Q2018.The company’s revenue came in at QR398.9mn in 3Q2018, which represents a decrease of 14.9% YoY. However, on QoQ basis, revenue rose 10.8%. EPS amounted to QR1.09 in 9M2018 as compared to QR1.23 in 9M2017. In 9M2018, UDCD’s net profit attributable to equity shareholders stood at QR385mn on revenues of QR1.29bn. “UDCD has achieved good performance given the challenging conditions prevailing in today’s real estate market. UDCD’s relatively strong showing under difficult circumstances was actually a testament to the quality of properties being offered at The Pearl-Qatar and to the prospective nature of three major developments being currently undertaken by UDCD, pursuant to the master plan,” said its Chairman, Turki bin Mohamed Al- Khater. This aims to ensure that The Pearl-Qatar remains the premier real estate development in Qatar and the location of choice for investors, developers, owners, residents and tenants, he said. The volume of residential properties rented during the first nine months of 2018 increased by 22% YoY, while the volume of retail areas under lease had increased by 6%, which indicate that The Pearl-Qatar is becoming a favorable destination for residential and retail tenants in Qatar to live and operate a business. UDCD’s unique real estate
- 3. Page 3 of 8 portfolio at The Pearl-Qatar includes properties for sale, consisting of land plots, apartment and townhouse units, and properties for lease, consisting of office space and residential and retail units, which all are located in a self-sufficient community. “The crown jewel of the three major developments is Gewan Island, a development that will include an assortment of waterfront and beach front villas, private island villas, apartments as well as retail and hospitality outlets, entertainment and sports facilities, and mosque, artistically woven into the reworked and reclaimed land that is adjacent to The Pearl-Qatar, Al-Khater said. “During the current month, UDCD has awarded the construction works for commercial showroom at Abraj Quartier district. The construction works will be completed by the end of the fourth quarter of the year 2020, by which the showroom will be ready for commercial tenants,” UDCD’s President and CEO, Ibrahim Jassim Al- Othman said. (QSE, Gulf-Times.com) MARK's bottom line driven by net reversals YoY and QoQ in 3Q2018, beating our estimate – Masraf Al Rayan's (MARK) net profit rose 4.4% YoY (+5.8% QoQ) to QR566.0mn in 3Q2018, ahead of our estimate of QR536.1mn (variation of +5.6%). The beat was due to MARK booking net reversals. The bank booked net reversals of QR15.1mn vs. net reversals of QR2.8mn in 3Q2017 (net provisions of QR4.9mn in 2Q2018). Total revenue increased by 3.0% YoY on the back of strong fees & commissions and income from associates, while net interest & investment income was flat. EPS increased to QR0.75 in 3Q2018 from QR0.72 in 3Q2017 and QR0.71 in 2Q2018. Net loans grew by 1.9% QoQ (+2.9% YTD) to QR74.2bn while deposits gained by 2.8% QoQ (3.1% YTD) reaching QR64.5bn. Hence, MARK’s LDR remained at 115% vs. 116% in 2Q2018 (115% at the end of 2017). MARK remains cost efficient with C/I ratio of 22.7%. On the profitability indicators, MARK again continued to maintain its ‘leading position’ with return on average assets at 2.15% and return on average equity at 16.72%, despite depositors’ share of profits increasing by 12.9%, due to higher cost profits on deposits at local and international levels. The bank’s capitalization remained strong with common equity tier 1 (CET 1) at 18.18% and total capital adequacy ratio (CAR) at 19.04%, well above the regulatory requirements including all buffers under Basel III and the Qatar Central Bank standards. MARK’s non-performing loans (NPLs) ratio remained at 0.64%, ‘reflecting a very strong and prudent credit risk management policies and procedures.’ MARK’s Chairman and Managing Director, Hussain Al-Abdulla expressed satisfaction over the results, stating that it was within expectations and in line with the positive indicators of the Qatari economy. (QNBFS Research, QSE, Gulf-Times.com) QIIK's bottom line rises 6.9% YoY and 8.8% QoQ in 3Q2018, beating our estimate – Qatar International Islamic Bank's (QIIK) net profit rose 6.9% YoY (+8.8% QoQ) to QR251.2mn in 3Q2018, beating our estimate of QR235.5mn (variation of +6.7%). EPS amounted to QR4.86 in 9M2018 as compared to QR4.63 in 9M2017. In 9M2018, QIIK earned net profit of QR735mn, up 5% on the same period last year. QIIK’s CEO, Abdulbasit Ahmad Al-Shaibei said, “The bank’s total income for the nine months ended on September 30, amounted to QR1,584mn compared to QR1,385mn for the same period in 2017.” He noted that QIIK’s total assets at the end of the third quarter stood at nearly QR49bn, while the financing portfolio exceeded QR28bn. QIIK’s capital adequacy ratio (under Basel III) reached 16.47 % by the end of the third quarter, which confirms the bank's solid position and its ability to cope with the various market risks. The CEO said, “These results clearly indicate that QIIK continues to achieve growth and success, drawing on the strength and resilience of the Qatari economy, which proved its capabilities to ward off its challengers.” (QNBFS Research, QSE, Gulf-Times.com) DBIS reports net loss of QR17.50mn in 3Q2018 – Dlala Brokerage and Investments Holding Co. (DBIS) reported net loss of QR17.50mn in 3Q2018 as compared to net profit of QR3.29mn in 3Q2017 and net profit of QR0.05mn in 2Q2018. Loss per share amounted to QR0.56 in 9M2018 as compared to EPS of QR0.57 in 9M2017. (QSE) WDAM's net profit declines ~27% YoY and ~31% QoQ in 3Q2018 – Widam Food Company's (WDAM) net profit declined ~27% YoY (~-31% QoQ) to ~QR19mn in 3Q2018. In 9M2018, WDAM reported net profit of QR79.7mn as compared to QR80.1mn for the same period of the previous year. EPS amounted to QR4.42 in 9M2018 as compared to QR4.45 in 9M2017. (QSE) QNCD's net profit declines ~33% YoY and ~36% QoQ in 3Q2018 – Qatar National Cement Company’s (QNCD) net profit declined ~33% YoY (~-36% QoQ) to ~QR50mn in 3Q2018. In 9M2018, QNCD reported net profit of QR218.8mn as compared to QR242.8mn for the same period of the previous year. EPS amounted to QR3.35 in 9M2018 as compared to QR3.72 in 9M2017. (QSE) MCGS posts 104.7% YoY increase but 41.4% QoQ decline in net profit in 3Q2018 – Medicare Group's (MCGS) net profit rose 104.7% YoY (but declined 41.4% on QoQ basis) to QR7.5mn in 3Q2018. The company's operating income came in at QR111.7mn in 3Q2018, which represents an increase of 4.7% YoY. However, on QoQ basis, operating income fell 5.7%. In 9M2018, MCGS reported net profit of QR40.8mn as compared to QR36.3mn for the same period of the previous year. EPS amounted to QR1.45 in 9M2018 as compared to QR1.29 in 9M2017. (QSE) Qatar affirmed at ‘AA-‘ by Fitch with ‘Stable’ Outlook – Qatar’s ‘AA-’ ratings reflect a return to budget surpluses, a strong net external and public sector asset position and one of the world’s highest ratios of GDP per capita. Fitch forecasted Qatar’s general government surplus at 4.7% of GDP in 2018 from a deficit of 2.9% of GDP in 2017, including the estimated investment income on public sector external assets, as the recovery in hydrocarbon revenue outpaces spending. Fitch sees Qatar’s annual fiscal surplus to widen slightly to 5.1% of GDP in 2019, before moderating to 3.3% of GDP in 2020. (Bloomberg) QGTS to disclose 3Q2018 financial statements on October 28 – Qatar Gas Transport Company Limited (QGTS) announced its intent to disclose 3Q2018 financial statements for the period ended September 30, 2018, on October 28, 2018. (QSE) ZHCD to disclose 3Q2018 financial statements on October 30 – Zad Holding Company (ZHCD) announced its intent to disclose 3Q2018 financial statements for the period ended September 30, 2018, on October 30, 2018. (QSE)
- 4. Page 4 of 8 QNNS to disclose 3Q2018 financial statements on October 30 – Qatar Navigation (QNNS) announced its intent to disclose 3Q2018 financial statements for the period ended September 30, 2018, on October 30, 2018. (QSE) MPHC to disclose 3Q2018 financial statements on October 29 – Mesaieed Petrochemical Holding Company (MPHC) announced its intent to disclose 3Q2018 financial statements for the period ended September 30, 2018, on October 29, 2018. (QSE) IQCD to disclose 3Q2018 financial statements on October 24 – Industries Qatar (IQCD) announced its intent to disclose 3Q2018 financial statements for the period ended September 30, 2018, on October 24, 2018. (QSE) GISS to disclose 3Q2018 financial statements on October 28 – Gulf International Services (GISS) announced its intent to disclose 3Q2018 financial statements for the period ended September 30, 2018, on October 28, 2018. (QSE) MCCS to disclose 3Q2018 financial statements on October 30 – Mannai Corporation (MCCS) announced its intent to disclose 3Q2018 financial statements for the period ended September 30, 2018, on October 30, 2018. (QSE) BRES to disclose 3Q2018 financial statements on October 28 – Barwa Real Estate Company (BRES) announced its intent to disclose 3Q2018 financial statements for the period ended September 30, 2018, on October 28, 2018. (QSE) IGRD to disclose 3Q2018 financial statements on October 28 – Investment Holding Group (IGRD) announced its intent to disclose 3Q2018 financial statements for the period ended September 30, 2018, on October 28, 2018. (QSE)
- 5. Page 5 of 8 Qatar Stock Exchange Top Gainers Top Decliners Source: Qatar Stock Exchange (QSE) Source: Qatar Stock Exchange (QSE) Most Active Shares by Value (QR Million) Most Active Shares by Volume (Million) Source: Qatar Stock Exchange (QSE) Source: Qatar Stock Exchange (QSE) Investor Trading Percentage to Total Value Traded Net Traded Value by Nationality (QR Million) Source: Qatar Stock Exchange (QSE) Source: Qatar Stock Exchange (QSE) 12.1% 10.0% 10.0% 6.2% 6.0% 0.0% 5.0% 10.0% 15.0% Mazaya Qatar Real Estate Dev. Industries Qatar Qatar Cinema & Film Distribution Co. Qatar National Cement Company The Commercial Bank -5.3% -3.6% -3.4% -1.4% -1.0% -6.0% -4.0% -2.0% 0.0% Dlala Brokerage & Inv. HoldingCo. Islamic Holding Group QatarIndustrial ManufacturingCo. WidamFood Company Zad Holding Company 186.3 102.9 85.1 62.5 54.3 0.0 80.0 160.0 240.0 QNB Group Industries Qatar Qatar Fuel Company Qatar Electricity & Water Co. Mazaya Qatar Real Estate Dev. 7.2 4.0 2.3 1.8 1.5 0.0 3.0 6.0 9.0 Mazaya Qatar Real Estate Dev. Vodafone Qatar Qatar First Bank Gulf International Services Barwa Real Estate Company 0% 20% 40% 60% 80% 100% Buy Sell 26.38% 43.03% 19.01% 18.73%12.33% 13.25% 42.28% 25.00% Qatari Individuals Qatari Institutions Non-Qatari Individuals Non-Qatari Institutions 452 544 615 381 (163) 163 (400) (200) - 200 400 600 800 Qatari Non-Qatari Net Investment Total Sold Total Bought
- 6. Page 6 of 8 TECHNICAL ANALYSIS OF THE QSE INDEX Source: Bloomberg The General Index managed to close above the 10,000 level; it closed at 10,193.01, up 3.36% from the week before. The Index reached the 38.2% Fibonacci retracement from the bearish move which has started back in 2014. This may act as intra-weekly resistance, but the general is up. Our next resistance level is at 11,000 points and the weekly support remains at the 9,200 level. DEFINITIONS OF KEY TERMS USED IN TECHNICAL ANALYSIS RSI (Relative Strength Index) indicator – RSI is a momentum oscillator that measures the speed and change of price movements. The RSI oscillates between 0 to 100. The index is deemed to be overbought once the RSI approaches the 70 level, indicating that a correction is likely. On the other hand, if the RSI approaches 30, it is an indication that the index may be getting oversold and therefore likely to bounce back. MACD (Moving Average Convergence Divergence) indicator – The indicator consists of the MACD line and a signal line. The divergence or the convergence of the MACD line with the signal line indicates the strength in the momentum during the uptrend or downtrend, as the case may be. When the MACD crosses the signal line from below and trades above it, it gives a positive indication. The reverse is the situation for a bearish trend. Candlestick chart – A candlestick chart is a price chart that displays the high, low, open, and close for a security. The ‘body’ of the chart is portion between the open and close price, while the high and low intraday movements form the ‘shadow’. The candlestick may represent any time frame. We use a one-day candlestick chart (every candlestick represents one trading day) in our analysis. Doji candlestick pattern – A Doji candlestick is formed when a security's open and close are practically equal. The pattern indicates indecisiveness, and based on preceding price actions and future confirmation, may indicate a bullish or bearish trend reversal. Shooting Star/Inverted Hammer candlestick patterns – These candlestick patterns have a small real body (open price and close price are near to each other), and a long upper shadow (large intraday movement on the upside). The Shooting Star is a bearish reversal pattern that forms after a rally. The Inverted Hammer looks exactly like a Shooting Star, but forms after a downtrend. Inverted Hammers represent a potential bullish trend reversal.
- 7. Page 7 of 8 Source: Bloomberg
- 8. Contacts Saugata Sarkar, CFA, CAIA Shahan Keushgerian Zaid al-Nafoosi , CMT, CFTe Head of Research Senior Research Analyst Senior Research Analyst Tel: (+974) 4476 6534 Tel: (+974) 4476 6509 Tel: (+974) 4476 6535 saugata.sarkar@qnbfs.com.qa shahan.keushgerian@qnbfs.com.qa zaid.alnafoosi@qnbfs.com.qa QNB Financial Services Co. W.L.L. Contact Center: (+974) 4476 6666 PO Box 24025 Doha, Qatar Disclaimer and Copyright Notice: This publication has been prepared by QNB Financial Services Co. W.L.L. (“QNBFS”) a wholly-owned subsidiary of Qatar National Bank (Q.P.S.C.). QNBFS is regulated by the Qatar Financial Markets Authority and the Qatar Exchange. Qatar National Bank (Q.P.S.C.) is regulated by the Qatar Central Bank. This publication expresses the views and opinions of QNBFS at a given time only. It is not an offer, promotion or recommendation to buy or sell securities or other investments, nor is it intended to constitute legal, tax, accounting, or financial advice. QNBFS accepts no liability whatsoever for any direct or indirect losses arising from use of this report. Any investment decision should depend on the individual circumstances of the investor and be based on specifically engaged investment advice. We therefore strongly advise potential investors to seek independent professional advice before making any investment decision. Although the information in this report has been obtained from sources that QNBFS believes to be reliable, we have not independently verified such information and it may not be accurate or complete. QNBFS does not make any representations or warranties as to the accuracy and completeness of the information it may contain, and declines any liability in that respect. For reports dealing with Technical Analysis, expressed opinions and/or recommendations may be different or contrary to the opinions/recommendations of QNBFS Fundamental Research as a result of depending solely on the historical technical data (price and volume). QNBFS reserves the right to amend the views and opinions expressed in this publication at any time. It may also express viewpoints or make investment decisions that differ significantly from, or even contradict, the views and opinions included in this report. This report may not be reproduced in whole or in part without permission from QNBFS COPYRIGHT: No part of this document may be reproduced without the explicit written permission of QNBFS. Page 8 of 8