QNBFS Weekly Market Report June 20, 2019
•
0 gefällt mir•101 views

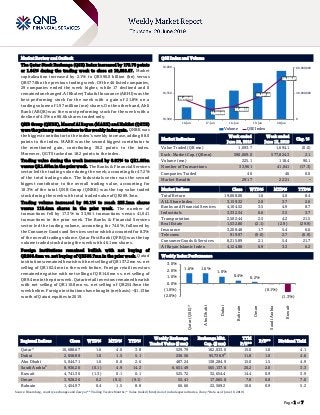
The Qatar Stock Exchange (QSE) Index increased by 172.79 points or 1.64% during the trading week to close at 10,688.67.

Empfohlen
Empfohlen
Weitere ähnliche Inhalte
Mehr von QNB Group
Mehr von QNB Group (20)
Kürzlich hochgeladen
Kürzlich hochgeladen (20)
QNBFS Weekly Market Report June 20, 2019
- 1. ` Page 1 of 7 Market Review and Outlook QSE Index and Volume The Qatar Stock Exchange (QSE) Index increased by 172.79 points or 1.64% during the trading week to close at 10,688.67. Market capitalization increased by 2.1% to QR590.0 billion (bn) versus QR577.8bn the previous trading week. Of the 46 listed companies, 29 companies ended the week higher, while 17 declined and 0 remainedunchanged.AlKhaleejTakafulInsurance(AKHI)wasthe best performing stock for the week with a gain of 21.8% on a trading volume of 1.97 million (mn) shares. On the other hand, Ahli Bank (ABQK) was the worst performing stock for the week with a decline of 4.5% on 96.6k shares traded only. QNB Group (QNBK), Masraf Al Rayan (MARK) and Nakilat (QGTS) were the primary contributors to the weekly indexgain. QNBK was the biggest contributor to the index’s weekly increase, adding 88.0 points to the index. MARK was the second biggest contributor to the mentioned gain, contributing 30.2 points to the index. Moreover, QGTS tacked on 18.2 points to the index. Trading value during the week increased by 0.01% to QR1.69bn versus QR1.69bn in the prior week. The Banks & Financial Services sector led the trading value during the week, accounting for 47.2% of the total trading value. The Industrials sector was the second biggest contributor to the overall trading value, accounting for 18.3% of the total. QNB Group (QNBK) was the top value traded stock during the week with total traded value of QR289.3mn. Trading volume increased by 90.1% to reach 225.1mn shares versus 118.4mn shares in the prior week. The number of transactions fell by 17.3% to 33,961 transactions versus 41,041 transactions in the prior week. The Banks & Financial Services sector led the trading volume, accounting for 74.6%, followed by the Consumer Goods and Services sector which accounted for 8.3% of the overall trading volume. Qatar First Bank (QFBQ) was the top volume traded stock during the week with 46.1mn shares. Foreign institutions remained bullish with net buying of QR266.6mn vs. net buying of QR366.7mn in the prior week. Qatari institutionsremainedbearishwithnetsellingofQR137.2mnvs.net selling of QR102.4mn in the week before. Foreign retail investors remained negative with net selling of QR14.6mn vs. net selling of QR9.4mninthepriorweek.Qatariretailinvestorsremainedbearish with net selling of QR110.8mn vs. net selling of QR254.9mn the week before. Foreign institutions have bought (net basis) ~$1.13bn worth of Qatari equities in 2019. Market Indicators Week ended June 20, 2019 Week ended June 13, 2019 Chg. % Value Traded (QR mn) 1,693.7 1,694.1 (0.0) Exch. Market Cap. (QR mn) 590,069.0 577,824.3 2.1 Volume (mn) 225.1 118.4 90.1 Number of Transactions 33,961 41,041 (17.3) Companies Traded 46 46 0.0 Market Breadth 29:17 22:21 – Market Indices Close WTD% MTD% YTD% Total Return 19,668.06 1.6 4.0 8.4 ALL Share Index 3,159.32 2.0 3.7 2.6 Banks and Financial Services 4,164.52 3.5 4.9 8.7 Industrials 3,332.34 0.6 3.5 3.7 Transportation 2,502.44 2.5 4.2 21.5 Real Estate 1,532.80 (2.1) (2.9) (29.9) Insurance 3,208.48 1.7 5.4 6.6 Telecoms 919.97 (0.0) 2.7 (6.9) Consumer Goods & Services 8,215.89 2.1 5.4 21.7 Al Rayan Islamic Index 4,124.88 0.9 3.3 6.2 Market Indices Weekly Index Performance Regional Indices Close WTD% MTD% YTD% Weekly Exchange Traded Value ($ mn) Exchange Mkt. Cap. ($ mn) TTM P/E** P/B** Dividend Yield Qatar* 10,688.67 1.6 4.0 3.8 529.79 162,033.0 15.0 1.6 4.1 Dubai 2,658.88 1.0 1.5 5.1 236.56 95,738.9# 11.8 1.0 4.6 Abu Dhabi 5,044.71 1.6 0.8 2.6 487.24 138,284.9 15.0 1.5 4.9 Saudi Arabia# 8,936.26 (0.1) 4.9 14.2 6,651.49 565,137.6 20.2 2.0 3.3 Kuwait 4,741.36 (1.3) 0.1 0.1 525.72 32,654.4 14.4 0.9 3.9 Oman 3,928.26 0.2 (0.1) (9.1) 55.41 17,065.0 7.8 0.8 7.0 Bahrain 1,454.97 0.4 1.5 8.8 66.66 22,569.2 10.6 0.9 5.2 Source: Bloomberg, country exchanges and Zawya (** Trailing Twelve Months; * Value traded ($ mn) do not include special trades, if any; #Data as of June 19, 2019) 10,479.63 10,390.08 10,420.14 10,507.40 10,688.67 0 40,000,000 80,000,000 10,300 10,550 10,800 16-Jun 17-Jun 18-Jun 19-Jun 20-Jun Volume QSE Index 1.6% 1.6% 1.0% 0.4% 0.2% (0.1%) (1.3%)(2.0%) (1.0%) 0.0% 1.0% 2.0% 3.0% Qatar(QSE)* AbuDhabi Dubai Bahrain Oman SaudiArabia Kuwait
- 2. Page 2 of 7 Stock Split Dates for Listed Qatari Companies News Economic & Market News World Bank: Higher gas prices, North Field production boost Qatar account surplus – Qatar’s current account surplus increased to 8.7% in third quarter of 2018, from less than 4% in 2017 due to higher gas prices and production from the North Field, the country’s biggest gas repository, according to the World Bank. Qatar, the largest LNG exporter globally, had seen its goods export earnings rose by 25% in 2018, World Bank stated in its recent ‘Economic Update’. The country’s public finances have improved, supported by the recovery in energy prices, and Qatar is expected to post a small fiscal surplus in 2018, the first since 2014. (Gulf-Times.com) Commerce Minister: Qatar’s GDP reaches $225bn in 2018 – Qatar’s GDP grew to $225bn in 2018, said HE the Minister of Commerce & Industry, Ali bin Ahmed al-Kuwari, who noted that the annual real GDP growth rate at constant prices reached 1.4% in 2018, which is a “better-than-expected” rate. Qatar's foreign trade saw remarkable growth in 2018 with total trade increasing by 19% to reach $116bn. Qatar’s total exports also increased by 25% to reach $84bn in 2018, resulting in a 40% increase in trade surplus, which reached $53bn in 2018. Al- Kuwari said that international trade and investment form a key part of Qatar’s future growth and diversification, noting that the US is one of Qatar’s strategic and largest global partners. (Gulf-Times.com) Qatar issued 659 building permits in May – Building permits issued in Qatar reached 659 in May 2019, a decrease of 11% compared to April 2019, data released by the Planning and Statistics Authority (PSA) showed. According to their geographical distribution, Al Rayyan municipality issued the maximum number of building permits at 184. Doha municipality came in the second place with 142 permits, followed by Al Wakrah (109), Al Da’ayen (97), Umm Salal (48), Al Sheehaniya (39), Al Khor (32), and Al Shamal (8). In terms of types of permits issued, data showed new building permits (residential and non-residential) constituted 51% (337 permits) of the total building permits issued in May, while the percentage of addition permits constituted 46% (300 permits), and fencing permits reached 3% (22 permits). An analysis of new residential buildings permits data showed that villas top the list, accounting for 71% (203 permits) of all new residential building permits, followed by dwellings of housing loans by 23% (65 permits) and apartment buildings by 5% (15 permits). (Qatar Tribune) Qatar’s industrial production up by 1% in April – The monthly Industrial Production index (IPI) of Qatar for April 2019 amounted to 101.6 points, showing an increase of 1% compared to the previous month, and decreased by 1.6%, when compared to the corresponding month last year, data released by the Planning and Statistics Authority showed. The Mining sector
- 3. Page 3 of 7 index, which contributes 83.6% of total IPI index, for April showed an increase of 1% compared to the previous month, as a result of the increase in the quantities of crude oil and natural gas by 1%, while other mining and quarrying showed an increase by 1.6%. When compared to the corresponding month of the previous year, the IPI of Mining decreased by 2.1%. (Peninsula Qatar) Draft law on new health insurance system to be unveiled soon – The draft law on the new health insurance system will soon be presented to the Advisory Council, HE the Minister of Public Health Hanan Mohamed Al-Kuwari said. A committee composed of the Ministry of Public Health, the Ministry of Finance, the Ministry of Commerce and Industry and the State Audit Bureau are examining the tender for the new health insurance, after studying the drawbacks of the previous system, the Minister said. She also revealed that work is being done to make it compulsory for visitors to Qatar have health insurance. This project is being implemented in cooperation with the Ministry of Public Health, the Ministry of Interior and the Ministry of Administrative Development, Labor and Social Affairs. "It will contribute to reducing the pressure on health services provided by the public sector, particularly the Emergency," she said. (Gulf-Times.com) QSE executes splits of share for QGMD – Qatar Stock Exchange (QSE) announced that the split of shares for Qatari German Company for Medical Devices (QGMD) has been executed, effective from June 19, 2019. The new number of QGMD’s shares after the split is 115,500,000 and the adjusted closing price of QR0.75 per share. QSE also sets price limits, (i) Price up limit: QR0.825 and (ii) Price down limit: QR0.675. (QSE) QSE executes splits of share for ZHCD – Qatar Stock Exchange (QSE) announced that the split of shares for Zad Holding Company (ZHCD) has been executed, effective from June 19, 2019. The new number of ZHCD’s shares after the split is 143,891,750 and the adjusted closing price of QR12.8 per share. QSE also sets price limits, (i) Price up limit: QR14.08 and (ii) Price down limit: QR11.52. (QSE) QSE executes splits of share for WDAM – Qatar Stock Exchange (QSE) announced that the split of shares for Widam Food Company (WDAM) has been executed, effective from June 19, 2019. The new number of WDAM’s shares after the split is 180,000,000 and the adjusted closing price of QR6.05 per share. QSE also sets price limits, (i) Price up limit: QR6.65 and (ii) Price down limit: QR5.45. (QSE) QSE executes splits of share for MCGS – Qatar Stock Exchange (QSE) announced that the split of shares for Medicare Group (MCGS) has been executed, effective from June 20, 2019. The new number of MCGS’ shares after the split is 281,441,000 and the adjusted closing price of QR6.77 per share. QSE also sets price limits, (i) Price up limit: QR7.44 and (ii) Price down limit: QR6.10. (QSE) QSE executes splits of share for QFLS – Qatar Stock Exchange (QSE) announced that the split of shares for Qatar Fuel Company (QFLS) has been executed, effective from June 20, 2019. The new number of QFLS’ shares after the split is 994,255,760 and the adjusted closing price of QR21.48 per share. QSE also sets price limits, (i) Price up limit: QR23.62 and (ii) Price down limit: QR19.34. (QSE) QSE executes splits of share for DHBK – Qatar Stock Exchange (QSE) announced that the split of shares for Doha Bank (DHBK) has been executed, effective from June 16, 2019. The new number of DHBK’s shares after the split is 3,100,467,020 and the adjusted closing price is QR2.48 per share. QSE has also set price limits; (i) Price up limit: QR2.72 and (ii) Price down limit: QR2.24. (QSE) QSE executes splits of share for QIBK – Qatar Stock Exchange (QSE) announced that the split of shares for Qatar Islamic Bank (QIBK) has been executed, effective from June 16, 2019. The new number of QIBK’s shares after the split is 2,362,932,000 and the adjusted closing price is QR17.61 per share. QSE has also set price limits; (i) Price up limit: QR19.37 and (ii) Price down limit: QR15.85. (QSE) QSE executes splits of share for MARK – Qatar Stock Exchange (QSE) announced that the split of shares for Masraf Al Rayan (MARK) has been executed, effective from June 17, 2019. The new number of MARK’s shares after the split is 7,500,000,000 and the adjusted closing price of QR3.62 per share. QSE also sets price limits, (i) Price up limit: QR3.98 and (ii) Price down limit: QR3.26. (QSE) QSE executes splits of share for MERS – Qatar Stock Exchange (QSE) announced that the split of shares for Al Meera Consumer Goods Company (MERS) has been executed, effective from June 18, 2019. The new number of MERS’ shares after the split is 200,000,000 and the adjusted closing price of QR14.25 per share. QSE also sets price limits, (i) Price up limit: QR15.67 and (ii) Price down limit: QR12.83. (QSE) QSE executes splits of share for MCCS – Qatar Stock Exchange (QSE) announced that the split of shares for Mannai Corporation (MCCS) has been executed, effective from June 18, 2019. The new number of MCCS’ shares after the split is 456,192,000 and the adjusted closing price of QR3.90 per share. QSE also sets price limits, (i) Price up limit: QR4.29 and (ii) Price down limit: QR3.51. (QSE) QCSD amends the foreign ownership percentage of Ahli Bank to 49% – Qatar Central Securities Depository has modified the foreigners’ ownership limit ofAhli Bank to be 49% of the capital, which is equal to 1,133,842,742 shares. (QSE)
- 4. Page 4 of 7 Qatar Stock Exchange Top Gainers Top Decliners Source: Qatar Stock Exchange (QSE) Source: Qatar Stock Exchange (QSE) Most Active Shares by Value (QR Million) Most Active Shares by Volume (Million) Source: Qatar Stock Exchange (QSE) Source: Qatar Stock Exchange (QSE) Investor Trading Percentage to Total Value Traded Net Traded Value by Nationality (QR Million) Source: Qatar Stock Exchange (QSE) Source: Qatar Stock Exchange (QSE) 21.8% 19.5% 13.3% 10.0% 7.5% 0.0% 10.0% 20.0% 30.0% Al Khaleej Takaful Insurance Co. Medicare Group Qatari Investors Group Qatar Cinema & Film Distribution Co. Islamic Holding Group -4.5% -3.4% -3.2% -3.1% -2.6% -6.0% -4.0% -2.0% 0.0% AhliBank QatarNational CementCompany Zad Holding Company BarwaReal Estate Company InvestmentHolding Group 289.3 190.0 98.4 87.5 87.1 0.0 100.0 200.0 300.0 QNB Group Qatar International Islamic Bank Industries Qatar Masraf Al Rayan Qatar Islamic Bank 46.1 25.3 22.7 22.3 15.0 0.0 17.0 34.0 51.0 Qatar First Bank Qatar International Islamic Bank Doha Bank Masraf Al Rayan QNB Group 0% 20% 40% 60% 80% 100% Buy Sell 28.03% 34.57% 11.36% 19.47%9.34% 10.21% 51.27% 35.76% Qatari Individuals Qatari Institutions Non-Qatari Individuals Non-Qatari Institutions 667 1,027 915 779 (248) 248 (400) (200) - 200 400 600 800 1,000 1,200 Qatari Non-Qatari Net Investment Total Sold Total Bought
- 5. Page 5 of 7 TECHNICAL ANALYSIS OF THE QSE INDEX Source: Bloomberg The QE Index closed 1.64% up from the week before, and closed at 10,688.67. The Index has created a bullish-continuation pattern; the pattern is getting confirmed through the price action. We keep our next expected resistance level at 10,800 points and the 9,700 as our weekly support level. DEFINITIONS OF KEY TERMS USED IN TECHNICAL ANALYSIS RSI (Relative Strength Index) indicator – RSI is a momentum oscillator that measures the speedand change of price movements. The RSI oscillates between 0 to 100. The index is deemed to be overbought once the RSI approaches the 70 level, indicating that a correction is likely. On the other hand, if the RSI approaches 30, it is an indication that the index may be getting oversold and therefore likely to bounce back. MACD (Moving Average Convergence Divergence) indicator – The indicator consists of the MACD line and a signal line. The divergence or the convergence of the MACD line with the signal line indicates the strength in the momentum during the uptrend or downtrend, as the case may be. When the MACD crosses the signal line from below and trades above it, it gives a positive indication. The reverse is the situation for a bearish trend. Candlestick chart – A candlestick chart is a price chart that displays the high, low, open, and close for a security. The ‘body’ of the chart is portion between the open and close price, while the high and low intraday movements form the ‘shadow’. The candlestick may represent any time frame. We use a one-day candlestick chart (every candlestick represents one trading day) in our analysis. Doji candlestick pattern – A Doji candlestick is formed when a security's open and close are practically equal. The pattern indicates indecisiveness, and based on preceding price actions and future confirmation, may indicate a bullish or bearish trend reversal. ShootingStar/Inverted Hammer candlestick patterns – These candlestick patterns have a small real body (open price and close price are near to each other), and a long upper shadow (large intraday movement on the upside). The Shooting Star is a bearish reversal pattern that forms after a rally. The Inverted Hammer looks exactly like a Shooting Star, but forms after a downtrend. Inverted Hammers represent a potential bullish trend reversal.
- 6. Page 6 of 7 Source: Bloomberg Company Name Price June 20 % Change WTD % Change YTD Market Cap. QR Million TTM P/E P/B Div. Yield Qatar National Bank 19.72 5.62 1.13 182,142 13.9 2.8 3.0 Qatar Islamic Bank 17.55 (0.37) 15.46 41,469 15.9 2.8 2.8 Commercial Bank of Qatar 4.90 1.03 24.40 19,832 13.7 1.2 3.1 Doha Bank 2.59 4.44 16.67 8,030 15.0 0.9 3.9 Al Ahli Bank 2.95 (4.53) 15.89 6,826 10.2 1.2 3.1 Qatar International Islamic Bank 7.55 3.14 14.19 11,428 13.6 2.1 5.3 Masraf Al Rayan 3.77 3.29 (9.55) 28,275 13.2 2.3 5.3 Al Khaliji Bank 1.20 2.56 3.99 4,320 7.7 0.8 6.3 Qatar First Bank 0.41 (2.14) 0.74 822 N/A 0.8 N/A National Leasing 0.80 4.87 (9.33) 394 36.0 0.6 6.3 Dlala Holding 0.93 1.09 (7.40) 263 N/A 1.2 N/A Qatar & Oman Investment 0.56 (1.07) 4.12 175 68.7 0.6 5.4 Islamic Holding Group 2.30 7.48 5.26 130 954.9 1.0 N/A Banking and Financial Services 304,108 Zad Holding 12.58 (3.23) 20.96 1,810 14.0 1.9 6.8 Qatar German Co. for Medical Devices 0.74 0.27 30.74 85 N/A 2.2 N/A Salam International Investment 4.48 4.19 3.46 512 N/A 0.4 N/A Medicare Group 6.87 19.48 8.87 1,933 22.9 2.0 26.2 Qatar Cinema & Film Distribution 19.83 9.98 4.26 125 14.0 0.9 7.6 Qatar Fuel 21.89 1.44 31.88 21,764 18.4 2.9 3.7 Qatar Meat and Livestock 6.12 2.00 (12.57) 1,102 10.2 3.6 7.4 Mannai Corp. 3.85 (1.31) (29.94) 1,756 4.8 0.7 5.2 Al Meera Consumer Goods 14.41 0.73 (2.64) 2,882 15.7 2.2 5.9 Consumer Goods and Services 31,970 Qatar Industrial Manufacturing 38.20 (0.78) (10.54) 1,815 9.9 1.2 6.5 Qatar National Cement 65.00 (3.42) 9.24 4,248 13.1 1.4 7.7 Industries Qatar 118.00 0.81 (11.68) 71,390 16.1 2.2 5.1 Qatari Investors Group 24.55 13.34 (11.72) 3,052 17.7 1.1 3.1 Qatar Electricity and Water 171.79 (0.70) (7.14) 18,897 13.0 2.0 4.5 Aamal 8.08 0.62 (8.60) 5,090 12.0 0.6 7.4 Gulf International Services 19.30 (1.73) 13.53 3,587 N/A 1.0 N/A Mesaieed Petrochemical Holding 27.00 0.37 79.64 33,921 25.8 2.4 3.0 Invesment Holding Group 5.70 (2.56) 16.56 473 7.9 0.6 4.4 Qatar Aluminum Manufacturing 9.95 (0.40) (25.47) 5,552 N/A N/A 2.0 Industrials 148,025 Qatar Insurance 36.36 1.03 1.28 11,876 19.6 1.5 4.1 Doha Insurance 12.10 0.83 (7.56) 605 12.2 0.6 6.6 Qatar General Insurance & Reinsurance 41.00 (2.12) (8.65) 3,588 17.2 0.6 2.4 Al Khaleej Takaful Insurance 20.46 21.79 138.18 522 18.1 1.0 2.4 Qatar Islamic Insurance 59.00 2.61 9.85 885 13.7 2.7 5.9 Insurance 17,476 United Development 13.80 0.07 (6.44) 4,886 10.7 0.5 7.2 Barw a Real Estate 34.60 (3.14) (13.30) 13,464 7.0 0.7 7.2 Ezdan Real Estate 7.18 (2.18) (44.68) 19,045 31.4 0.6 N/A Mazaya Qatar Real Estate Development 7.80 4.84 0.00 903 78.8 0.6 6.4 Real Estate 38,298 Ooredoo 66.89 (0.61) (10.81) 21,426 14.3 1.0 3.7 Vodafone Qatar 7.11 0.99 (8.96) 6,011 42.2 1.4 3.5 Telecoms 27,437 Qatar Navigation (Milaha) 63.98 (0.81) (3.08) 7,327 13.6 0.5 4.7 Gulf Warehousing 48.75 3.61 26.72 2,857 11.9 1.8 3.9 Qatar Gas Transport (Nakilat) 22.69 4.03 26.55 12,571 13.8 2.0 4.4 Transportation 22,755 Qatar Exchange 590,069
- 7. Contacts Saugata Sarkar, CFA, CAIA Shahan Keushgerian Zaid al-Nafoosi , CMT, CFTe Head of Research Senior Research Analyst Senior Research Analyst Tel: (+974) 4476 6534 Tel: (+974) 4476 6509 Tel: (+974) 4476 6535 saugata.sarkar@qnbfs.com.qa shahan.keushgerian@qnbfs.com.qa zaid.alnafoosi@qnbfs.com.qa Mehmet Aksoy, PhD QNB Financial Services Co. W.L.L. Senior Research Analyst Contact Center: (+974) 4476 6666 Tel: (+974) 4476 6589 PO Box 24025 mehmet.aksoy@qnbfs.com.qa Doha, Qatar Disclaimer and Copyright Notice: This publication has been prepared by QNB Financial Services Co. W.L.L. (“QNB FS”) a wholly-owned subsidiary of Qatar National Bank (Q.P.S.C.). QNB FS is regulated by the Qatar Financial Markets Authority and the Qatar Exchange. Qatar National Bank (Q.P.S.C.) is regulated by the Qatar Central Bank. This publication expresses the views and opinions of QNB FS at a given time only. It is not an offer, promotion or recommendation to buy or sell securities or other investments, nor is it intended to constitute legal, tax, accounting, or financial advice. QNB FS accepts no liability whatsoever for any direct or indirect losses arising from use of this report. Any investment decision should depend on the individual circumstances of the investor and be based on specifically engaged investment advice. We therefore strongly advise potential investors to seek independent professional advice before making any investment decision. Although the information in this report has been obtained from sources that QNB FS believes to be reliable, we have not independently verified such information and it may not be accurate or complete. QNB FS does not make any representations or warranties as to the accuracy and completeness of the information it may contain, and declines any liability in that respect. For reports dealing with Technical Analysis, expressed opinions and/or recommendations may be different or contrary to the opinions/recommendations of QNB FS Fundamental Research as a result of depending solely on the historical technical data (price and volume). QNB FS reserves the right to amend the views and opinions expressed in this publication at any time. It may also express viewpoints or make investment decisions that differ significantly from, or even contradict, the views and opinions included in this report. This report may not be reproduced in whole or in part without permission from QNB FS COPYRIGHT: No part of this document may be reproduced without the explicit written permission of QNB FS. Page 7 of 7