QNBFS Weekly Market Report July 12, 2018
•
0 gefällt mir•87 views

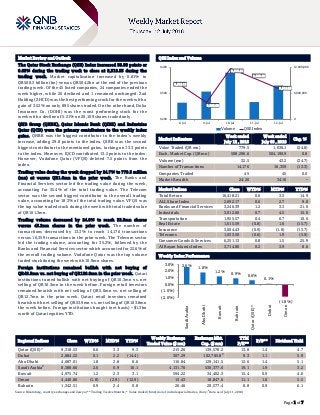
The Qatar Stock Exchange (QSE) Index increased 58.58 points or 0.63% during the trading week to close at 9,318.53 during the trading week.

Empfohlen
Empfohlen
Weitere ähnliche Inhalte
Mehr von QNB Group
Mehr von QNB Group (20)
Kürzlich hochgeladen
Kürzlich hochgeladen (20)
QNBFS Weekly Market Report July 12, 2018
- 1. ` Page 1 of 7 Market Review and Outlook QSE Index and Volume The Qatar Stock Exchange (QSE) Index increased 58.58 points or 0.63% during the trading week to close at 9,318.53 during the trading week. Market capitalization increased by 0.81% to QR508.3 billion (bn) versus QR504.2bn at the end of the previous trading week. Of the 45 listed companies, 24 companies ended the week higher, while 20 declined and 1 remained unchanged. Zad Holding (ZHCD) was the best performing stock for the week with a gain of 3.52% on only 895 shares traded. On the other hand, Doha Insurance Co. (DOHI) was the worst performing stock for the week with a decline of 5.21% on 20,109 shares traded only. QNB Group (QNBK), Qatar Islamic Bank (QIBK) and Industries Qatar (QCD) were the primary contributors to the weekly index gains. QNBK was the biggest contributor to the index’s weekly increase, adding 29.8 points to the index. QIBK was the second biggest contributor to the mentioned gains, tacking on 13.3 points to the index. Moreover, IQCD contributed 13.2 points to the index. However, Vodafone Qatar (VFQS) deleted 7.5 points from the index. Trading value during the week dropped by 24.7% to 779.5 million (mn) at versus QR1.0mn in the prior week. The Banks and Financial Services sector led the trading value during the week, accounting for 35.4% of the total trading value. The Telecom sector was the second biggest contributor to the overall trading value, accounting for 18.3% of the total trading value. VFQS was the top value traded stock during the week with total traded value of QR101.3mn. Trading volume decreased by 24.6% to reach 32.5mn shares versus 43.2mn shares in the prior week. The number of transactions decreased by 13.3% to reach 14,176 transactions versus 16,359 transactions in the prior week. The Telecom sector led the trading volume, accounting for 35.2%, followed by the Banks and Financial Services sector which accounted for 22.6% of the overall trading volume. Vodafone Qatar was the top volume traded stock during the week with 10.9mn shares. Foreign institutions remained bullish with net buying of QR48.5mn vs. net buying of QR126.8mn in the prior week. Qatari institutions turned bullish with net buying of QR10.3mn vs. net selling of QR10.3mn in the week before. Foreign retail investors remained bearish with net selling of QR5.0mn vs. net selling of QR12.7mn in the prior week. Qatari retail investors remained bearish with net selling of QR53.9mn vs. net selling of QR103.8mn the week before. Foreign institutions bought (net basis) ~$1.3bn worth of Qatari equities YTD. Market Indicators Week ended July 12 , 2018 Week ended July 05 , 2018 Chg. % Value Traded (QR mn) 779.5 1,036.1 (24.8) Exch. Market Cap. (QR mn) 508,296.6 504,190.9 0.8 Volume (mn) 32.5 43.2 (24.7) Number of Transactions 14,176 16,359 (13.3) Companies Traded 45 45 0.0 Market Breadth 24:20 34:10 – Market Indices Close WTD% MTD% YTD% Total Return 16,418.21 0.6 3.3 14.9 ALL Share Index 2,692.17 0.6 2.7 9.8 Banks and Financial Services 3,246.39 1.2 3.3 21.0 Industrials 3,012.66 0.7 4.5 15.0 Transportation 1,955.57 0.4 0.7 10.6 Real Estate 1,615.59 (0.8) 1.6 (15.7) Insurance 3,004.43 (0.9) (1.8) (13.7) Telecoms 1,033.50 (0.6) 1.9 (5.9) Consumer Goods & Services 6,251.13 0.8 1.5 25.9 Al Rayan Islamic Index 3,714.80 0.2 3.9 8.6 Market Indices Weekly Index Performance Regional Indices Close WTD% MTD% YTD% Weekly Exchange Traded Value ($ mn) Exchange Mkt. Cap. ($ mn) TTM P/E** P/B** Dividend Yield Qatar (QSE)* 9,318.53 0.6 3.3 9.3 215.26 139,578.2 13.8 1.4 4.7 Dubai 2,884.22 0.1 2.2 (14.4) 307.29 102,785.8# 9.3 1.1 5.9 Abu Dhabi 4,687.01 1.8 2.8 6.6 116.84 129,141.5 12.6 1.4 5.1 Saudi Arabia# 8,388.66 2.6 0.9 16.1 4,131.70 530,377.6 19.1 1.9 3.2 Kuwait 4,975.74 1.2 2.3 3.1 594.22 34,402.3 15.4 0.9 4.0 Oman 4,440.80 (1.8) (2.9) (12.9) 13.43 18,847.6 11.1 1.0 5.5 Bahrain 1,342.51 0.9 2.4 0.8 26.46 20,577.4 8.8 0.9 6.1 Source: Bloomberg, country exchanges and Zawya (** Trailing Twelve Months; * Value traded ($ mn) do not include special trades, if any; # Data as of July 11, 2018) 9,325.15 9,265.00 9,395.81 9,355.02 9,318.53 0 6,000,000 12,000,000 9,200 9,300 9,400 8-Jul 9-Jul 10-Jul 11-Jul 12-Jul Volume QSE Index 2.6% 1.8% 1.2% 0.9% 0.6% 0.1% (1.8%) (2.0%) (1.0%) 0.0% 1.0% 2.0% 3.0% SaudiArabia AbuDhabi Kuwait Bahrain Qatar(QSE)* Dubai Oman
- 2. Page 2 of 7 News Economic & Market News QNBK’s net profit rises 7% YoY to QR7.1bn in 1H2018 – QNB Group (QNBK) recorded net profit of QR7.1bn in 1H2018, up 7% compared to the previous year. Operating Income increased by 10% YoY to QR12.2bn. This reflects QNBK’s success in maintaining growth across the range of revenue sources. QNBK’s drive for operational efficiency is yielding cost-savings in addition to sustainable revenue generating sources. This helped QNBK to improve the efficiency ratio (cost to income ratio) to 27.2%, from 29.3% last year, which is considered one of the best ratios among large financial institutions in the MEA. Total assets increased by 10% YoY to reach QR846bn at the end of June 30, 2018. The key driver of total assets growth was from loans and advances which grew by 9% to reach QR604bn. This was mainly funded by customer deposits which increased by 9% to reach QR614bn from June 2017. This helped to maintain QNBK’s loans to deposits ratio at 98.4% as at June 30, 2018 reflecting the strength of the long term funding sources and considered to be at the optimum level. QNBK’s conservative policy in regard to provisioning continued with the coverage ratio reaching at 110% in June 30, 2018. Total Equity increased by 3% YoY to reach QR76bn as at June 30, 2018. EPS increased to QR7.4 in 1H2018 as compared to QR7.0 in 1H2017. QNBK’s strong recovery efforts helped reduce the net impairment charge on QNBK’s loan book during the year demonstrating strong credit quality of the bank’s asset base. Also maintaining the stock of nonperforming loans ratio at 1.8% reflecting the high quality of QNBK’s loan book and the effective management of credit risk. QNBK’s conservative policy in regard to provisioning maintained the coverage ratio at 110% as at June 30, 2018. Capital Adequacy Ratio (CAR) as at June 30, 2018 amounted to 15.8%, higher than the regulatory minimum requirements of the Qatar Central Bank and Basel Committee. In April 2018, the Extraordinary General Assembly Meeting of shareholders approved the increase of non-Qatari ownership limit to 49% as well as increase of single ownership limit to 5%. QNBK’s successful funding from the international markets during the first six months of 2018 which includes, amongst others, (1) capital market issuances of $560mn with a five and ten-year maturity in Australia and (2) $720mn bonds with 30 year maturity in Taiwan. This reflects the group’s success in diversifying funding sources by entering new debt markets, sourcing sustainable long term funding, extending the maturity profile of funding sources and the trust of international investors in the strong financial position of QNBK and its strategy. QNBK remains a highly- rated bank, demonstrating a strength that continues to attract institutional, corporate and individual customers to bank with QNBK, and for investors and markets to believe in QNBK’s strong financial position and strategy. In June 2018, Fitch Ratings has revised the Outlook to ‘Stable’ due to successful management of the impact from the blockade. Based on QNBK’s continuous strong performance and its diversified international presence, QNBK is now the most valuable banking brand in the MEA region, with the value of its brand increased to $4.2bn to rise to the 60th place globally, in addition to attaining the highest rating of AA+ in brand strength, making it the only Qatari banking brand among the world’s top 100. QNB Group’s presence spans more than 31 countries serving more than 22mn customers through more than 1,100 locations, 4,400 ATMs and more than 29,000 staff. (QNB Group Press Release) QGTS’ bottom line rises 5% YoY/QoQ in 2Q2018, modestly better than our estimate (divergence of 5%) – Qatar Gas Transport Company Limited’s (QGTS) net profit rose 4.8% YoY (5.2% QoQ) to QR227.72mn in 2Q2018, modestly besting our estimate of QR216.02mn (variation of 5.4%). Wholly-owned ship business was in-line with gross profits lower by 1% vs. our forecast. The beat vs. our earnings estimate came primarily due to higher-than-expected JV income (likely due to impact of the 2 conventional vessels added in March in the 40%-owned Maran JV) and lower depreciation expenses. JV income of QR106.8mn (4.9% YoY/25.7% QoQ) was 16.9% better than our forecast and was at the highest level seen since 4Q2016. Going forward, we envision a further boost to the quarterly run-rate of JV income given the addition of a 55% stake in a FSRU vessel. We continue to favor Nakilat, #1 owner/operator of LNG vessels globally, as a LT play geared to Qatari LNG’s dominance and anticipated growth in the LNG market. We believe the stock is attractive at current levels and reiterate our QR21 price target and Outperform rating. (QNBFS Research, QSE, Gulf-Times.com) BRES’ subsidiary, Alaqaria, terminates leasing agreement with Qatar Petroleum; insignificant impact to numbers– Barwa Real Estate Company (BRES) announced that its fully owned subsidiary, Qatar Real Estate Investments Company (Alaqaria), signed contract termination and discharge release for financial leasing agreements, related to real estate projects, with Qatar Petroleum that Alaqaria has been constructing to be leased to Qatar petroleum. The contract termination and discharge releases will result in Alaqaria to receive QR670mn, which will entail an increase in the balance of cash and bank balances of BRES and will support the investing activities of the group. There is no major impact to numbers as the announcement implies that BRES will record revenue of QR670mn likely in 3Q2017 in a sales transaction instead of recognizing finance lease income over several years. Moreover, there is minimal impact to the bottom-line given the nature of the agreement with QP. We continue to rate BRES an Accumulate with a QR39 price target. (QNBFS Research, QSE) GDI, Seadrill sign pact for utilization of off-shore drilling rig West Tucana – Gulf International Services announces that its subsidiary Gulf Drilling International (GDI) signed a definitive agreement with Seadrill for the utilization of the offshore drilling rig West Tucana. As a part of the agreement, the ‘West Tucana’, a JU 2000E, will be contracted to work in Qatar offshore for a firm period of 440 days with options in place for further extensions. GDI also announced that it has signed a Strategic Cooperation Agreement with Seadrill that provides the foundation for future synergies in Qatar’s offshore market between GDI & Seadrill. GDI’s CEO, Mubarak A. Al-Hajri said, “This partnership with Seadrill will lead to greater strategic and competitive advantage strengthening our position as the leader in Qatar Offshore drilling market. By bringing together
- 3. Page 3 of 7 Seadrill’s high-specification jack up fleet, GDI’s diverse customer base, and our combined experience, we plan to continue delivering market leading level of operational and safety performance to our clients.” (QSE) Milaha deploys flagship vessel off West African Coast – Qatar Navigation (Milaha) announced the deployment of its liftboat, Milaha Explorer, off the coast of West Africa as part of a long- term charter with a major international oil company. Milaha Explorer is the largest of its kind to be owned by a Qatari company and has a large deck area, a variable load capacity and the ability to accommodate 300 persons on board. Milaha’s President and CEO, Abdulrahman Essa Al Mannai said, “Over the past few months, we have been significantly ramping up our operations, and I am pleased to announce further growth in our geographic footprint and operational portfolio with this long-term deployment, which marks our entry into Africa. Milaha Explorer is a new and modern vessel, and we wish its captain and crew safe and successful operations.” (QSE) Hamad Port received 803 ships in six months – Showing a robust half yearly performance, Hamad Port received 803 ships in the first six months of the current year. It was performance driven time for the $7.4bn port as it achieved many significant milestones during the first six months of the year. (Peninsula Qatar) QGRI to disclose its semi-annual financials on July 31 – Qatar General Insurance & Reinsurance Company (QGRI) announced that it will disclose its semi-annual financial reports for the period ending June 30, 2018 on July 31, 2018. (QSE) QFBQ to disclose its semi-annual financials on July 30 – Qatar First Bank (QFBQ) announced that it will disclose its semi- annual financial reports for the period ending June 30, 2018 on July 30, 2018. (QSE) Aamal Company to disclose its semi-annual financials on July 30 – Aamal Company announced that it will disclose its semi- annual financial reports for the period ending June 30, 2018 on July 30, 2018. (QSE) SIIS to disclose its semi-annual financials on July 31 – Salam International Investment Limited (SIIS) announced that it will disclose its semi-annual financial reports for the period ending June 30, 2018 on July 31, 2018. (QSE) Ezdan Holding Group to hold its EGM on July 23 – Ezdan Holding Group announced that its board of directors will hold its Extraordinary General Meeting (EGM) on July 23, 2018. In case of lack of quorum, an alternate meeting will be held on August 15, 2018. (QSE) Vodafone Qatar to disclose its semi-annual financials on July 24 – Vodafone Qatar announced that it will disclose its semi- annual financial reports for the period ending June 30, 2018 on July 24, 2018. (QSE) QOIS to disclose its semi-annual financials on July 25 – Qatar Oman Investment Company (QOIS) announced that it will disclose its semi-annual financial reports for the period ending June 30, 2018 on July 25, 2018. (QSE) QIGD to disclose its semi-annual financials on July 23 – Qatari Investors Group (QIGD) announced that it will disclose its semi-annual financial reports for the period ending June 30, 2018 on July 23, 2018. (QSE) QATI to disclose its semi-annual financials on July 24 – Qatar Insurance Company (QATI) announced that it will disclose its semi-annual financial reports for the period ending June 30, 2018 on July 24, 2018. (QSE) BRES to disclose its semi-annual financials on July 24 – Barwa Real Estate Group (BRES) announced that it will disclose its semi-annual financial reports for the period ending June 30, 2018 on July 24, 2018. (QSE) Ezdan Holding Group to hold its EGM on July 23 – Ezdan Holding Group to hold its Extraordinary Meeting (EGM) on July 23, 2018, in case of lack of quorum a second date will be on August 15, 2018. (Peninsula Qatar)
- 4. Page 4 of 7 Qatar Stock Exchange Top Gainers Top Decliners Source: Qatar Stock Exchange (QSE) Source: Qatar Stock Exchange (QSE) Most Active Shares by Value (QR Million) Most Active Shares by Volume (Million) Source: Qatar Stock Exchange (QSE) Source: Qatar Stock Exchange (QSE) Investor Trading Percentage to Total Value Traded Net Traded Value by Nationality (QR Million) Source: Qatar Stock Exchange (QSE) Source: Qatar Stock Exchange (QSE) 3.5% 3.3% 3.3% 3.2% 3.1% 0.0% 1.5% 3.0% 4.5% Zad Holding Company Al Meera Consumer Goods Company AhliBank Qatari Investors Group Mannai Corporation -5.2% -4.2% -3.2% -2.5% -2.5% -6.0% -4.0% -2.0% 0.0% DohaInsurance Group QatarFirstBank MazayaQatarReal Estate Dev. DlalaBrokerage & InvestmentHolding Co. Al KhaleejTakaful Insurance Co. 101.3 90.6 65.5 60.2 45.5 0.0 40.0 80.0 120.0 Vodafone Qatar QNB Group Masraf Al Rayan Industries Qatar Qatar Gas Transport Co. Ltd. 10.9 2.8 1.8 1.6 1.6 0.0 4.0 8.0 12.0 Vodafone Qatar Qatar Gas Transport Co. Ltd. Masraf Al Rayan Mazaya Qatar Real Estate Dev. Dlala Brokerage & Inv. Holding Co. 0% 20% 40% 60% 80% 100% Buy Sell 45.32% 52.24% 9.81% 8.47% 10.18% 10.83% 34.69% 28.46% Qatari Individuals Qatari Institutions Non-Qatari Individuals Non-Qatari Institutions 430 350 473 306 (44) 44 (100) - 100 200 300 400 500 Qatari Non-Qatari Net Investment Total Sold Total Bought
- 5. Page 5 of 7 TECHNICAL ANALYSIS OF THE QSE INDEX Source: Bloomberg The General Index managed to close slightly up for the week by 0.63% from the week before. In addition, the Index managed to approach the 9,370 level. As a result, we reiterate our last week’s statement that the Index is in a strong position to reach the 9,500 level, but we wait on how that challenge will unfold to determine the next direction for the Index. The major resistance levels are around the 9,500- 9,600 points and the closest support is around the 8,600 level. DEFINITIONS OF KEY TERMS USED IN TECHNICAL ANALYSIS RSI (Relative Strength Index) indicator – RSI is a momentum oscillator that measures the speed and change of price movements. The RSI oscillates between 0 to 100. The index is deemed to be overbought once the RSI approaches the 70 level, indicating that a correction is likely. On the other hand, if the RSI approaches 30, it is an indication that the index may be getting oversold and therefore likely to bounce back. MACD (Moving Average Convergence Divergence) indicator – The indicator consists of the MACD line and a signal line. The divergence or the convergence of the MACD line with the signal line indicates the strength in the momentum during the uptrend or downtrend, as the case may be. When the MACD crosses the signal line from below and trades above it, it gives a positive indication. The reverse is the situation for a bearish trend. Candlestick chart – A candlestick chart is a price chart that displays the high, low, open, and close for a security. The ‘body’ of the chart is portion between the open and close price, while the high and low intraday movements form the ‘shadow’. The candlestick may represent any time frame. We use a one-day candlestick chart (every candlestick represents one trading day) in our analysis. Doji candlestick pattern – A Doji candlestick is formed when a security's open and close are practically equal. The pattern indicates indecisiveness, and based on preceding price actions and future confirmation, may indicate a bullish or bearish trend reversal. Shooting Star/Inverted Hammer candlestick patterns – These candlestick patterns have a small real body (open price and close price are near to each other), and a long upper shadow (large intraday movement on the upside). The Shooting Star is a bearish reversal pattern that forms after a rally. The Inverted Hammer looks exactly like a Shooting Star, but forms after a downtrend. Inverted Hammers represent a potential bullish trend reversal.
- 6. Page 6 of 7 Source: Bloomberg
- 7. Contacts Saugata Sarkar, CFA, CAIA Shahan Keushgerian Zaid al-Nafoosi , CMT, CFTe Head of Research Senior Research Analyst Senior Research Analyst Tel: (+974) 4476 6534 Tel: (+974) 4476 6509 Tel: (+974) 4476 6535 saugata.sarkar@qnbfs.com.qa shahan.keushgerian@qnbfs.com.qa zaid.alnafoosi@qnbfs.com.qa QNB Financial Services Co. W.L.L. Contact Center: (+974) 4476 6666 PO Box 24025 Doha, Qatar Disclaimer and Copyright Notice: This publication has been prepared by QNB Financial Services Co. W.L.L. (“QNBFS”) a wholly-owned subsidiary of Qatar National Bank (Q.P.S.C.). QNBFS is regulated by the Qatar Financial Markets Authority and the Qatar Exchange. Qatar National Bank (Q.P.S.C.) is regulated by the Qatar Central Bank. This publication expresses the views and opinions of QNBFS at a given time only. It is not an offer, promotion or recommendation to buy or sell securities or other investments, nor is it intended to constitute legal, tax, accounting, or financial advice. QNBFS accepts no liability whatsoever for any direct or indirect losses arising from use of this report. Any investment decision should depend on the individual circumstances of the investor and be based on specifically engaged investment advice. We therefore strongly advise potential investors to seek independent professional advice before making any investment decision. Although the information in this report has been obtained from sources that QNBFS believes to be reliable, we have not independently verified such information and it may not be accurate or complete. QNBFS does not make any representations or warranties as to the accuracy and completeness of the information it may contain, and declines any liability in that respect. For reports dealing with Technical Analysis, expressed opinions and/or recommendations may be different or contrary to the opinions/recommendations of QNBFS Fundamental Research as a result of depending solely on the historical technical data (price and volume). QNBFS reserves the right to amend the views and opinions expressed in this publication at any time. It may also express viewpoints or make investment decisions that differ significantly from, or even contradict, the views and opinions included in this report. This report may not be reproduced in whole or in part without permission from QNBFS COPYRIGHT: No part of this document may be reproduced without the explicit written permission of QNBFS. Page 7 of 7