QNBFS Weekly Market Report January 23, 2020
•
0 gefällt mir•39 views

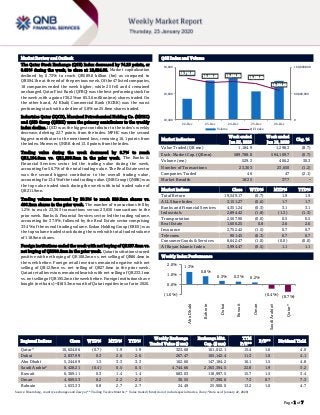
The Qatar Stock Exchange (QSE) Index decreased by 74.25 points, or 0.69% during the week, to close at 10,624.06

Empfohlen
Empfohlen
Weitere ähnliche Inhalte
Mehr von QNB Group
Mehr von QNB Group (20)
Kürzlich hochgeladen
Kürzlich hochgeladen (20)
QNBFS Weekly Market Report January 23, 2020
- 1. ` Page 1 of 7 Market Review and Outlook QSE Index and Volume The Qatar Stock Exchange (QSE) Index decreased by 74.25 points, or 0.69% during the week, to close at 10,624.06. Market capitalization declined by 0.73% to reach QR589.8 billion (bn) as compared to QR594.1bn at the end of the previous week. Of the 47 listed companies, 18 companies ended the week higher, while 25 fell and 4 remained unchanged. Qatar First Bank (QFBQ) was the best performing stock for the week, with a gain of 36.2% on 85.3.6 million (mn) shares traded. On the other hand, Al Khalij Commercial Bank (KCBK) was the worst performing stock with a decline of 5.8% on 25.8mn shares traded. Industries Qatar (IQCD), Mesaieed Petrochemical Holding Co. (MPHC) and QNB Group (QNBK) were the primary contributors to the weekly index decline. IQCD was the biggest contributor to the index’s weekly decrease, deleting 22.7 points from the index. MPHC was the second biggest contributor to the mentioned loss, removing 16.1 points from the index. Moreover, QNBK shed 13.0 points from the index. Trading value during the week decreased by 8.7% to reach QR1,184.9mn vs. QR1,298.3mn in the prior week. The Banks & Financial Services sector led the trading value during the week, accounting for 56.7% of the total trading value. The Real Estate sector was the second biggest contributor to the overall trading value, accountingfor13.4%ofthetotaltradingvalue.QNBGroup(QNBK)was the top value traded stock during the week with total traded value of QR211.9mn. Trading volume increased by 30.3% to reach 529.3mn shares vs. 406.2mn shares in the prior week. The number of transactions fell by 1.2% to reach 23,363 transactions versus 23,650 transactions in the prior week. Banks & Financial Services sector led the trading volume, accounting for 37.9%, followed by the Real Estate sector comprising 33.4% of the overall trading volume. Ezdan Holding Group (ERES) was the top volume traded stock during the week with total traded volume of 118.9mn shares. Foreign institutions ended the week with net buying of QR137.8mn vs. net buying of QR309.2mn in the prior week. Qatari institutions turned positive with net buying of QR108.2mn vs. net selling of QR86.4mn in the week before. Foreign retail investors remained negative with net selling of QR12.9mn vs. net selling of QR27.6mn in the prior week. Qatari retail investors remained bearish with net selling of QR233.1mn vs. net selling of QR195.2mnthe weekbefore. Foreigninstitutions have bought (net basis) ~$185.3mn worth of Qatari equities in so far in 2020. Market Indicators Week ended Jan 23, 2020 Week ended Jan 16, 2020 Chg. % Value Traded (QR mn) 1,184.9 1,298.3 (8.7) Exch. Market Cap. (QR mn) 589,788.0 594,109.7 (0.7) Volume (mn) 529.3 406.2 30.3 Number of Transactions 23,363 23,650 (1.2) Companies Traded 46 47 (2.1) Market Breadth 18:25 37:7 – Market Indices Close WTD% MTD% YTD% Total Return 19,549.17 (0.7) 1.9 1.9 ALL Share Index 3,151.27 (0.6) 1.7 1.7 Banks and Financial Services 4,351.24 (0.3) 3.1 3.1 Industrials 2,894.42 (1.8) (1.3) (1.3) Transportation 2,567.90 (0.0) 0.5 0.5 Real Estate 1,606.25 0.8 2.6 2.6 Insurance 2,752.42 (1.5) 0.7 0.7 Telecoms 901.45 (0.3) 0.7 0.7 Consumer Goods & Services 8,642.47 (1.0) (0.0) (0.0) Al Rayan Islamic Index 3,994.47 (0.5) 1.1 1.1 Market Indices Weekly Index Performance Regional Indices Close WTD% MTD% YTD% Weekly Exchange Traded Value ($ mn) Exchange Mkt. Cap. ($ mn) TTM P/E** P/B** Dividend Yield Qatar* 10,624.06 (0.7) 1.9 1.9 323.68 161,012.1 15.4 1.6 4.0 Dubai 2,837.99 0.3 2.6 2.6 267.47 105,142.4 11.3 1.0 4.1 Abu Dhabi 5,244.69 1.3 3.3 3.3 162.60 147,184.2 16.1 1.5 4.8 Saudi Arabia# 8,428.21 (0.4) 0.5 0.5 4,744.66 2,363,394.5 22.8 1.9 3.2 Kuwait 6,369.11 0.3 1.4 1.4 683.03 118,997.5 15.7 1.5 3.4 Oman 4,069.53 0.2 2.2 2.2 30.55 17,390.6 7.3 0.7 7.3 Bahrain 1,653.33 0.8 2.7 2.7 24.49 25,900.0 13.2 1.0 4.7 Source: Bloomberg, country exchanges and Zawya (** Trailing Twelve Months; * Value traded ($ mn) do not include special trades, if any; #Data as of January 22, 2020) 10,712.93 10,689.66 10,694.36 10,680.64 10,624.06 0 80,000,000 160,000,000 10,400 10,600 10,800 22-Dec 23-Dec 24-Dec 25-Dec 26-Dec Volume QE Index 1.3% 0.8% 0.3% 0.3% 0.2% (0.4%) (0.7%)(1.0%) 0.0% 1.0% 2.0% AbuDhabi Bahrain Dubai Kuwait Oman SaudiArabia# Qatar*
- 2. Page 2 of 7 News Economic News/Market & Corporate News CEO: QNB Group focuses on Southeast Asia as part of expansion plan – QNB Group’s CEO, Abdulla Al-Khalifa said that QNB Group is putting Southeast Asia as the focus of its expansion. “Our focus really was the Middle East and then we expanded to Southeast Asia where we’re now focusing,” the CEO said in an interview with Bloomberg TV. “If we find the right opportunity for acquisition, we will consider it,” he said, adding there are no deals currently under review. QNB Group has been expanding with the purchase of National Bank of Greece SA’s Turkish unit and Societe Generale SA’s Egypt subsidiary. “Expanding abroad is part of how the bank will continue growing despite the small scale of Qatar’s local market. We know that Qatar, at one point in time, will not be itself sufficient to satisfy our expansion growth, or the growth potential that we have,” Al-Khalifa said. Al-Khalifa also said the reduction in real estate value in Qatar is a very healthy correction; and QNB Group has changed the way it finances real estate investments to consider a period of 12-15 years instead of six-eight years. The CEO sees the bank continuing to build credit growth in the private sector, particularly services, trading and contracting. He also expects the bank to help finance new liquefied natural gas facilities. Al- Khalifa is encouraging consolidation among competitors and would like them to be bigger. (Gulf-Times.com) MARK posts ~4% YoY increase but ~10% QoQ decline in net profit in 4Q2019, in-line with our estimate – Masraf Al Rayan's (MARK) net profit rose ~4% YoY (but declined ~10% on QoQ basis) to ~QR0.5bn (~QR517mn) in 4Q2019, in line with our estimate of QR530.0mn (variation of ~-3%). EPS amounted to QR0.290 in FY2019 as compared to QR0.284 in FY2018. In FY2019, MARK reported net profit of QR2.17bn compared to net profit amounting to QR2.13bn for the same period of the previous year. In FY2019, MARK has posted a net profit of QR2.17bn during the year that ended on December 31, 2019, a growth of 2.3% from the previous year. The bank’s board of directors at their meeting on Monday proposed to distribute a cash dividend of QR0.225 per share (22.5% of the paid-up capital), for recommendation to the ordinary general assembly meeting to be held on March 18, after obtaining the approval from the Qatar Central Bank. The election of the board members for the fifth term (2020-2022) will also be held during the meeting. Group CEO Adel Mustafawi said, “Such results were aligned with the overall growth trend of the Qatari economy, reflecting the bank’s focus on robust asset quality, prudent risk management policies and a conservative lending strategy, while continuously developing and improving customer service standards.” Mustafawi also termed the results as good as it maintained the continuation of the upward line of the performance of MARK. The bank's profits from banking operating activities increased by 7.1% of the same achieved in the previous year. He said MARK’s total assets reached QR106.3bn in December 2019 compared to QR97.2bn in December 2018, a growth of 9.4%. Financing activities amounted to QR74.8bn in December 2019 compared to QR72.5bn in December 2018, a growth of 3.2%. Investments increased to QR21.9bn in December 2019 compared to QR19.7bn in December 2018, which represents a growth of 10.9%. MARK’s customer deposits totaled QR65.6bn in December 2019 compared to QR61.5bn in December 2018, a growth of 6.6%. Total shareholders' equity (before distribution) reached QR13.9bn in December 2019, compared to QR13.2bn at the end of 2018, a growth of 4.8%. In respect of MARK’s financial indicators, Mustafawi said the return on average assets continued to be one of the highest in the market at 2.14%. Return on average shareholders' equity reached 16.02% in December 2019. Book value per share reached QR1.86 in December 2019 compared to QR1.77 in December 2018. Capital adequacy ratio, using Basel-III standards and QCB regulations, reached 20.27% in December 2019 compared to 19.23% at the end of 2018. Non-performing financing (NPF) ratio reached 1.01% in December 2019 reflecting very strong and prudent credit and risk management policies and procedures. MARK continues to focus on providing integrated Shari’ah-compliant banking solutions for both retail and corporate customers in order to meet their increasing and varied needs and on developing technology-based banking services made available in various forms and applications to ensure the best customer service at all times. (QNB FS Research, QSE, Gulf-Times.com) KCBK's bottom line rises 7.2% YoY and 2.6% QoQ in 4Q2019, in- line with our estimate – Al Khalij Commercial Bank's (KCBK) net profit rose 7.2% YoY (+2.6% QoQ) to QR148.9mn in 4Q2019, in line with our estimate of QR148.7mn (variation of +0.2%). Net Interest Income increased 10.1% YoY in 4Q2019 to QR240.4mn. However, on QoQ basis Net Interest Income declined 8.1%. The company's net operating income came in at QR281.2mn in 4Q2019, which represents an increase of 9.6% YoY. However, on QoQ basis Net Operating income fell 7.5%. The bank's total assets stood at QR53.8bn at the end of December 31, 2019, up 3.2% YoY (+5.1% QoQ). Loans and Advances to Customers were QR30.8bn, registering a fell by 2.6% YoY at the end of December 31, 2019. However, on QoQ basis Loans and Advances to Customers increased 2.6%. Customer Deposits rose 1.2% YoY and 6.8% QoQ to reach QR29.2bn at the end of December 31, 2019. EPS amounted to QR0.16 in FY2019 as compared to QR0.15 in FY2018.In FY2019, KCBK reported a net profit of QR646mn, and registering a YoY growth of 6%. The bank’s net operating income increased by 3% to QR1.18bn compared to 2018. The bank witnessed a 7% decline in net impairment loss to QR176mn. Operating expenses remained flat at QR329mn, resulting in a cost-to-income ratio of 27.9% at the end of December 31, 2019, compared to 28.8% in the previous year. The bank’s balance sheet remains strong and liquid with 27% of total assets comprising of cash and high quality investment securities, and capital adequacy ratio standing at a robust at 19.1%. The bank’s non-performing loan coverage ratio stood at 131% at the end of December 31, 2019, compared to 109% in the previous year. Total equity stood at QR7bn as on December 31, 2019 against QR6.56bn a year ago. After reviewing the audited financials, the board has recommended (subject to QCB approval) to the Annual General Assembly the distribution of a cash dividend of 7.5% of the nominal share value i.e. QR0.075 per share. Fahad Al Khalifa, KCBK’s Group CEO, said, “2019 was
- 3. Page 3 of 7 yet again a positive year for al khaliji. The bank delivered QR646mn in profits, which is 6% better than our performance last year. We have delivered these results by increasing operating income by improving margins, maintaining an efficient cost base, strengthening our capital and funding positions. Our full year results reflect our continued focus on growing our business locally in Qatar, selectively pursuing opportunities in the local economy. Net operating income grew by 3% YoY driven primarily by an increase of 7% in net interest income. While we focused on improving operating income, we also continued our focus on maintaining an efficient cost base. Operating costs remained similar to 2018 levels, at QR329m. Prudent management of our loan book has resulted in impairment charges being lower by 7% compared to last year. We will continue to focus on maintaining asset quality during 2020 as well”. During 2019, both Moody’s and Fitch re-affirmed their ratings of ‘A3/ Stable’ and ‘A/Stable Outlook’ noting our good asset quality, and strong capitalization liquidity positions. (QNB FS Research, QSE, Peninsula Qatar, Gulf-Times.com, Company Releases) ABQK posts ~2% YoY increase but ~29% QoQ decline in net profit in 4Q2019, misses our estimate – Ahli Bank's (ABQK) net profit rose 2.3% YoY (but declined 29.5% on QoQ basis) to QR130.7mn in 4Q2019 vs. our estimate of QR157.5mn. In FY2019, ABQK has posted a net profit of QR675.23mn compared to net profit amounting to QR665.56mn for the same period of the previous year. EPS amounted to QR0.292 in FY2019 as compared to QR0.288 in FY2018. The bank’s balance sheet grew by 8.7% over December 31, 2018 to QR43.9bn. Loans and advances grew 14.8% last year to nearly QR31.6bn. Investment Securities grew by 27.1% to QR7.5bn in 2019. ABQK’s customer deposits grew by 17.2% to QR25.5bn in 2019. Cost-to-income ratio for 2019 improved to 27.3% from 28.1% in 2018 reflecting efficient management of the bank’s operations. The Return on Average Assets (ROAA) and Return on Average Equity (ROAE) stood steady at 1.7% and 11.9% respectively, despite an increase in balance sheet size and equity base. Total capital adequacy ratio as of December 2019 stood at a healthy 17.1%, reflecting strong capital position of the bank. Ahli Bank’s board of directors has proposed a cash dividend of 15% i.e. QR0.15 per share, and a bonus share of 5% (one new share for every 20 shares held) as the dividend distribution for 2019. The dividend proposal takes into account maximization of shareholders’ wealth, bank’s internal capital requirements, liquidity and balance sheet growth projections. (QNB FS Research, QSE, Gulf- Times.com) MRDS posts net profit of QR32.50mn and EPS of QR0.03 per share in FY2019 – Mazaya Qatar Real Estate Development's (MRDS) posted net profit of QR32.50mn in FY2019 compared to net profit amounting to QR16.59mn for the same period of the previous year. During the year, the company had implemented International Financial Reporting Standard 16 (IFRS 16) which resulted in a restated net profit of QR374,173,823 for the same period of the previous year (net profit after implementing IFRS 16 – FY2019: QR32.50mn and FY2018: QR374,173,823). The EPS amounted to QR0.03 for the year ended December 31, 2019 to earning per share amounted to QR0.0143 and restated earnings per share amounted to QR0.32 for the same period of the previous year (EPS after implementing IFRS 16 – FY2019: QR0.03 and FY2018: QR0.32). (QSE) QIBK announces successful execution of $650mn Formosa Sukuk issuance – Qatar Islamic Bank (QIBK) announced successful execution of Formosa Sukuk issuance under its $4bn Trust Certificate Issuance Program, dual listed on the Taipei and Irish Stock Exchanges. Under this program, a $650mn tranche was issued with a maturity of five years. The issuance was part of QIBK's strategy to diversify funding from new markets. This is the first ever Reg S Sukuk issue to be listed on the Taipei stock exchange and attracted strong interest from investors globally especially Asia, and was arranged by Standard Chartered Bank (Taiwan) Limited. This success confirms the trust of international investors in Qatar’s economy, QIBK's strategy and the strength of its financial position. (QSE)
- 4. Page 4 of 7 Qatar Stock Exchange Top Gainers Top Decliners Source: Qatar Stock Exchange (QSE) Source: Qatar Stock Exchange (QSE) Most Active Shares by Value (QR Million) Most Active Shares by Volume (Million) Source: Qatar Stock Exchange (QSE) Source: Qatar Stock Exchange (QSE) Investor Trading Percentage to Total Value Traded Net Traded Value by Nationality (QR Million) Source: Qatar Stock Exchange (QSE) Source: Qatar Stock Exchange (QSE) 36.2% 5.6% 4.1% 2.3% 2.1% 0.0% 13.0% 26.0% 39.0% Qatar First BankQatariInvestors Group Qatar General Insurance & Reinsurance Company EzdanHolding Group Salam International Investment Limited -5.8% -4.4% -3.8% -3.6% -3.6% -7.5% -5.0% -2.5% 0.0% AlKhalij Commercial Bank Doha Insurance Group Mesaieed Petrochemical Holding Company Mannai Corporation Gulf International Services 211.9 143.5 110.1 76.5 76.1 0.0 80.0 160.0 240.0 QNB Group Masraf AlRayan Qatar Islamic Bank EzdanHolding Group Qatar First Bank 118.9 85.3 40.8 34.4 25.8 0.0 45.0 90.0 135.0 EzdanHolding Group Qatar First Bank Mazaya Qatar RealEstate Development Masraf AlRayan AlKhalij Commercial Bank 0% 20% 40% 60% 80% 100% Buy Sell 2 5 .27% 4 4 .94% 3 3 .65% 2 4 .51% 1 1 .18% 1 2 .27% 2 9 .90% 1 8 .28% QatariIndividuals QatariInstitutions Non-QatariIndividuals Non-QatariInstitutions 698 487 823 362 -125 125 -200 0 200 400 600 800 1,000 Qatari Non-Qatari Net Investment Total Sold Total Bought
- 5. Page 5 of 7 TECHNICAL ANALYSIS OF THE QSE INDEX Source: Bloomberg The QSE Index closed slightly lower by 0.69% from the week before, and closed at the 10,624.06 level. We remain on the bullish side after the Index closed, for the second week in a row above the strong resistance (around the 10,600 level). As a result, if such a breakout remains above the 10,600, then the next target around the 10,800 is possibly achievable. We keep our expected weekly-resistance level at 10,800 and the support at the 10,000 level. DEFINITIONS OF KEY TERMS USED IN TECHNICAL ANALYSIS RSI (Relative Strength Index) indicator – RSI is a momentum oscillator that measures the speedand change of price movements. The RSI oscillates between 0 to 100. The index is deemed to be overbought once the RSI approaches the 70 level, indicating that a correction is likely. On the other hand, if the RSI approaches 30, it is an indication that the index may be getting oversold and therefore likely to bounce back. MACD (Moving Average Convergence Divergence) indicator – The indicator consists of the MACD line and a signal line. The divergence or the convergence of the MACD line with the signal line indicates the strength in the momentum during the uptrend or downtrend, as the case may be. When the MACD crosses the signal line from below and trades above it, it gives a positive indication. The reverse is the situation for a bearish trend. Candlestick chart – A candlestick chart is a price chart that displays the high, low, open, and close for a security. The ‘body’ of the chart is portion between the open and close price, while the high and low intraday movements form the ‘shadow’. The candlestick may represent any time frame. We use a one-day candlestick chart (every candlestick represents one trading day) in our analysis. Doji candlestick pattern – A Doji candlestick is formed when a security's open and close are practically equal. The pattern indicates indecisiveness, and based on preceding price actions and future confirmation, may indicate a bullish or bearish trend reversal. ShootingStar/Inverted Hammer candlestick patterns – These candlestick patterns have a small real body (open price and close price are near to each other), and a long upper shadow (large intraday movement on the upside). The Shooting Star is a bearish reversal pattern that forms after a rally. The Inverted Hammer looks exactly like a Shooting Star, but forms after a downtrend. Inverted Hammers represent a potential bullish trend reversal.
- 6. Page 6 of 7 Source: Bloomberg Company Name Price January 23 % Change WTD % Change YTD Market Cap. QR Million TTM P/E P/B Div. Yield Qatar National Bank 20.78 (0.76) 0.92 191,933 15.3 2.6 2.9 Qatar Islamic Bank 16.59 0.55 8.22 39,201 13.8 2.3 3.0 Commercial Bank of Qatar 4.97 (0.40) 5.74 20,115 12.2 1.1 3.0 Doha Bank 2.85 (1.72) 12.65 8,836 12.5 0.9 3.5 Al Ahli Bank 3.62 (2.16) 3.43 8,377 12.4 1.4 2.5 Qatar International Islamic Bank 9.40 0.11 (2.89) 14,229 16.3 2.4 4.3 Masraf Al Rayan 4.13 0.49 4.29 30,975 14.2 2.2 4.8 Al Khaliji Bank 1.31 (5.76) 0.00 4,716 7.9 0.8 5.7 Qatar First Bank 0.99 36.23 20.90 692 N/A 1.0 N/A National Leasing 0.73 1.66 3.97 363 23.1 0.5 6.8 Dlala Holding 0.59 1.04 (4.26) 166 N/A 0.8 N/A Qatar & Oman Investment 0.59 0.34 (11.66) 186 69.6 0.6 5.1 Islamic Holding Group 1.88 (1.05) (1.05) 106 199.8 0.8 N/A Banking and Financial Services 319,895 Zad Holding 14.03 (0.07) 1.52 3,325 15.6 2.2 6.1 Qatar German Co. for Medical Devices 0.59 1.38 1.20 68 N/A 2.1 N/A Salam International Investment 0.53 2.11 3.09 609 N/A 0.5 N/A Baladna 1.00 0.00 0.00 1,901 N/A N/A N/A Medicare Group 8.47 (0.12) 0.24 2,384 29.3 2.4 21.3 Qatar Cinema & Film Distribution 2.20 0.00 0.00 138 17.9 1.0 6.8 Qatar Fuel 22.70 (1.39) (0.87) 22,570 18.7 2.8 3.5 Qatar Meat and Livestock 6.85 (0.72) 1.33 1,233 11.6 3.7 6.6 Mannai Corp. 3.20 (3.61) 3.90 1,460 5.5 0.6 6.3 Al Meera Consumer Goods 15.80 0.38 3.27 3,160 17.1 2.3 5.4 Consumer Goods and Services 36,848 Qatar Industrial Manufacturing 3.56 (1.93) (0.28) 1,692 15.0 1.1 7.0 Qatar National Cement 5.56 0.00 (1.59) 3,634 15.0 1.2 9.0 Industries Qatar 10.30 (1.81) 0.19 62,315 19.2 1.8 5.8 Qatari Investors Group 1.90 5.56 6.15 2,362 18.2 0.8 3.9 Qatar Electricity and Water 16.42 (1.08) 2.05 18,062 13.6 1.9 4.7 Aamal 0.81 (0.86) (0.62) 5,090 14.0 0.6 7.4 Gulf International Services 1.62 (3.57) (5.81) 3,011 N/A 0.8 N/A Mesaieed Petrochemical Holding 2.30 (3.77) (8.37) 28,895 33.8 2.0 3.5 Invesment Holding Group 0.57 (1.03) 1.77 476 7.8 0.6 4.4 Qatar Aluminum Manufacturing 0.77 0.13 (1.15) 4,308 N/A N/A 2.6 Industrials 129,845 Qatar Insurance 3.18 (2.45) 0.63 10,386 17.7 1.3 4.7 Doha Insurance 1.08 (4.42) (10.00) 540 8.3 0.5 7.4 Qatar General Insurance & Reinsurance 2.55 4.08 3.66 2,231 12.4 0.4 3.9 Al Khaleej Takaful Insurance 1.95 (2.01) (2.50) 498 12.4 0.9 2.6 Qatar Islamic Insurance 6.89 (0.14) 3.14 1,034 15.7 2.8 5.1 Insurance 14,689 United Development 1.57 1.29 3.29 5,559 14.9 0.5 6.4 Barw a Real Estate 3.60 0.28 1.69 14,008 9.0 0.7 6.9 Ezdan Real Estate 0.64 2.25 3.41 16,870 50.8 0.5 N/A Mazaya Qatar Real Estate Development 0.77 1.05 6.68 888 89.5 0.7 6.5 Real Estate 37,325 Ooredoo 6.98 (0.14) (1.41) 22,358 12.9 1.0 3.6 Vodafone Qatar 1.25 (0.79) 7.76 5,284 35.3 1.2 4.0 Telecoms 27,642 Qatar Navigation (Milaha) 6.09 (0.16) (0.16) 6,975 12.9 0.5 4.9 Gulf Warehousing 5.30 0.19 (3.28) 311 12.5 1.7 3.6 Qatar Gas Transport (Nakilat) 2.43 0.00 1.67 13,463 14.0 2.1 4.1 Transportation 20,748 Qatar Exchange 589,788
- 7. Contacts Saugata Sarkar, CFA, CAIA Shahan Keushgerian Zaid al-Nafoosi , CMT, CFTe Head of Research Senior Research Analyst Senior Research Analyst Tel: (+974) 4476 6534 Tel: (+974) 4476 6509 Tel: (+974) 4476 6535 saugata.sarkar@qnbfs.com.qa shahan.keushgerian@qnbfs.com.qa zaid.alnafoosi@qnbfs.com.qa Mehmet Aksoy, PhD QNB Financial Services Co. W.L.L. Senior Research Analyst Contact Center: (+974) 4476 6666 Tel: (+974) 4476 6589 PO Box 24025 mehmet.aksoy@qnbfs.com.qa Doha, Qatar Disclaimer and Copyright Notice: This publication has been prepared by QNB Financial Services Co. W.L.L. (“QNB FS”) a wholly-owned subsidiary of Qatar National Bank (Q.P.S.C.). QNB FS is regulated by the Qatar Financial Markets Authority and the Qatar Exchange. Qatar National Bank (Q.P.S.C.) is regulated by the Qatar Central Bank. This publication expresses the views and opinions of QNB FS at a given time only. It is not an offer, promotion or recommendation to buy or sell securities or other investments, nor is it intended to constitute legal, tax, accounting, or financial advice. QNB FS accepts no liability whatsoever for any direct or indirect losses arising from use of this report. Any investment decision should depend on the individual circumstances of the investor and be based on specifically engaged investment advice. We therefore strongly advise potential investors to seek independent professional advice before making any investment decision. Although the information in this report has been obtained from sources that QNB FS believes to be reliable, we have not independently verified such information and it may not be accurate or complete. QNB FS does not make any representations or warranties as to the accuracy and completeness of the information it may contain, and declines any liability in that respect. For reports dealing with Technical Analysis, expressed opinions and/or recommendations may be different or contrary to the opinions/recommendations of QNB FS Fundamental Research as a result of depending solely on the historical technical data (price and volume). QNB FS reserves the right to amend the views and opinions expressed in this publication at any time. It may also express viewpoints or make investment decisions that differ significantly from, or even contradict, the views and opinions included in this report. This report may not be reproduced in whole or in part without permission from QNB FS COPYRIGHT: No part of this document may be reproduced without the explicit written permission of QNB FS. Page 7 of 7