QNBFS Weekly Market Report January 09, 2020
•
0 gefällt mir•30 views

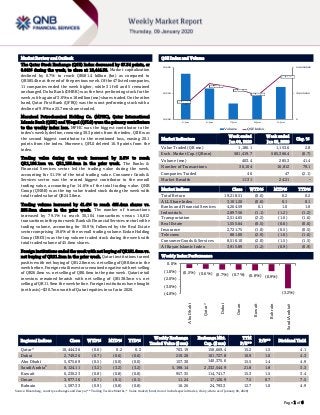
The Qatar Stock Exchange (QSE) Index decreased by 67.34 points, or 0.64% during the week, to close at 10,444.36

Empfohlen
Empfohlen
Weitere ähnliche Inhalte
Mehr von QNB Group
Mehr von QNB Group (20)
Kürzlich hochgeladen
Kürzlich hochgeladen (20)
QNBFS Weekly Market Report January 09, 2020
- 1. ` Page 1 of 6 Market Review and Outlook QSE Index and Volume The Qatar Stock Exchange (QSE) Index decreased by 67.34 points, or 0.64% during the week, to close at 10,444.36. Market capitalization declined by 0.7% to reach QR581.4 billion (bn) as compared to QR585.4bn at the end of the previous week. Of the 47 listed companies, 11 companies ended the week higher, while 31 fell and 5 remained unchanged. Doha Bank (DHBK) was the best performing stock for the week,witha gainof3.0%on18million(mn)sharestraded.Ontheother hand, Qatar First Bank (QFBQ) was the worst performing stock with a decline of 9.9% on 25.7mn shares traded. Mesaieed Petrochemical Holding Co. (MPHC), Qatar International Islamic Bank (QIIK) and Woqod (QFLS) were the primary contributors to the weekly index loss. MPHC was the biggest contributor to the index’s weekly decline, removing 30.3 points from the index. QIIK was the second biggest contributor to the mentioned loss, erasing 20.1 points from the index. Moreover, QFLS deleted 16.9 points from the index. Trading value during the week increased by 2.8% to reach QR1,186.1mn vs. QR1,153.6mn in the prior week. The Banks & Financial Services sector led the trading value during the week, accounting for 51.1% of the total trading value. Consumer Goods & Services sector was the second biggest contributor to the overall trading value, accounting for 14.6% of the total trading value. QNB Group (QNBK) was the top value traded stock during the week with total traded value of QR243.8mn. Trading volume increased by 41.4% to reach 403.4mn shares vs. 285.3mn shares in the prior week. The number of transactions increased by 79.1% to reach 30,104 transactions versus 16,812 transactionsinthepriorweek.Banks&FinancialServicessectorledthe trading volume, accounting for 30.9%, followed by the Real Estate sector comprising 19.6% of the overall trading volume. Ezdan Holding Group (ERES) was the top volume traded stock during the week with total traded volume of 45.6mn shares. Foreign institutions ended the week with net buying of QR151.6mn vs. net buying of QR21.2mn in the prior week. Qatari institutions turned positive with net buying of QR12.8mn vs. net selling of QR8.6mn in the weekbefore.Foreignretailinvestorsremainednegativewithnetselling of QR26.0mn vs. net selling of QR0.6mn in the prior week. Qatari retail investors remained bearish with net selling of QR138.3mn vs. net selling of QR11.9mn the week before. Foreign institutions have bought (net basis) ~$30.7mn worth of Qatari equities in so far in 2020. Market Indicators Week ended Jan 09, 2020 Week ended Jan 02, 2020 Chg. % Value Traded (QR mn) 1,186.1 1,153.6 2.8 Exch. Market Cap. (QR mn) 581,419.7 585,366.4 (0.7) Volume (mn) 403.4 285.3 41.4 Number of Transactions 30,104 16,812 79.1 Companies Traded 46 47 (2.1) Market Breadth 11:31 24:21 – Market Indices Close WTD% MTD% YTD% Total Return 19,218.51 (0.6) 0.2 0.2 ALL Share Index 3,101.20 (0.6) 0.1 0.1 Banks and Financial Services 4,264.59 0.1 1.0 1.0 Industrials 2,897.56 (1.1) (1.2) (1.2) Transportation 2,514.65 (2.2) (1.6) (1.6) Real Estate 1,555.64 (0.5) (0.6) (0.6) Insurance 2,721.75 (1.0) (0.5) (0.5) Telecoms 881.00 (2.9) (1.6) (1.6) Consumer Goods & Services 8,516.10 (2.0) (1.5) (1.5) Al Rayan Islamic Index 3,915.89 (1.2) (0.9) (0.9) Market Indices Weekly Index Performance Regional Indices Close WTD% MTD% YTD% Weekly Exchange Traded Value ($ mn) Exchange Mkt. Cap. ($ mn) TTM P/E** P/B** Dividend Yield Qatar* 10,444.36 (0.6) 0.2 0.2 703.19 158,669.4 15.2 1.5 4.1 Dubai 2,749.26 (0.7) (0.6) (0.6) 219.28 101,727.8 10.9 1.0 4.3 Abu Dhabi 5,075.69 (0.5) (0.0) (0.0) 157.30 140,375.6 15.5 1.4 4.9 Saudi Arabia# 8,124.11 (3.2) (3.2) (3.2) 5,198.14 2,332,544.9 21.8 1.8 3.3 Kuwait 6,230.23 (0.8) (0.8) (0.8) 957.35 114,741.7 15.3 1.5 3.4 Oman 3,977.16 (0.7) (0.1) (0.1) 11.24 17,126.9 7.5 0.7 7.5 Bahrain 1,597.33 (0.9) (0.8) (0.8) 16.26 24,793.3 12.7 1.0 4.9 Source: Bloomberg, country exchanges and Zawya (** Trailing Twelve Months; * Value traded ($ mn) do not include special trades, if any; #Data as of January 08, 2020) 10,286.31 10,408.16 10,381.74 10,337.32 10,444.36 0 70,000,000 140,000,000 10,200 10,350 10,500 5-Jan 6-Jan 7-Jan 8-Jan 9-Jan Volume QSE Index (0.5%) (0.6%) (0.7%) (0.7%) (0.8%) (0.9%) (3.2%)(4.0%) (3.0%) (2.0%) (1.0%) 0.0% AbuDhabi Qatar* Dubai Oman Kuwait Bahrain SaudiArabia#
- 2. Page 2 of 6 News Economic News/Market & Corporate News KCBK to hold board meeting on January 20 to discuss financial statements; conference call will be held on January 22 – Al Khalij Commercial Bank (KCBK) announced that the board of directors will hold its meeting on January 20, 2020 to discuss and approve the consolidated financial statements for the period ended December 31, 2019. A conference call will also take place on January 22, 2020 through QNB FS to discuss EOY results with the investors. (QSE) CBQK to hold board meeting on January 29 to discuss the financial statements; conference call will be held on January 30 – The Commercial Bank (CBQK) announced that the board of directors will hold its meeting on January 29, 2020 to discuss and approve the consolidated financial statements for the period ended December 31, 2019. A conference call will also take place on January 30, 2020. (QSE) QIIK to hold board meeting on January 28 to discuss the financial statements – Qatar International Islamic Bank (QIIK) announced that its board of directors will meet on January 28, 2020 to discuss financial statements for the period ended December 31, 2019. (QSE) OBG: Qatar’s Islamic financial services sector growth prospects closely tied to country's economic expansion – Growth prospects of Qatar’s Islamic financial services (IFS) sector are closely tied to the continued expansion of the country’s economy, which is expected to remain buoyant as its natural gas exports persist, a new report has showed. The continued expansion of the GCC’s Shari’ah-compliant assets is being driven by a number of ongoing regional developments, including the 2022 FIFA World Cup, which is hosted by Qatar, and the stabilization of energy prices, Oxford Business Group (OBG) has stated in a report. The Islamic finance industry has been an important component of the nation’s financial system since the early 1980s, when the first Shari’ah-compliant bank opened its doors for business, OBG stated in its 2019 report. Islamic financial services have been growing at a strong pace over recent years, with Shari’ah-compliant assets expanding at a compound annual growth rate (CAGR) of 11% between 2012 and 2017, outpacing their conventional counterparts. (Gulf- Times.com) Ezdan: Huge public spending to boost real estate growth – The huge public expenditure on major infrastructure projects and other key sectors such as education and health, as part of the 2020 national budget will support the robust growth of the Qatari economy, including the real estate sector, noted a report by Ezdan Real Estate Company (Ezdan). The monthly report issued by Market Research and Reports Department of Ezdan Real Estate Company depicted the positive indicators made in recently issued reports by international organizations, such as the World Bank, regarding the growth projection on Qatari economy. They projected a growth rate of 3% for the Qatari economy for 2020, which indicates an accompanying growth in the real estate sector, being one of the most vital sectors of the local economy. Such indicators are supported by the 2020 annual budget with a projected QR211bn in revenue and QR210.5bn expenditure, which is 1.9% higher compared to 2019. The report also stressed about the importance of laws regulating and promoting Qatar’s tourism sector. As a result of concerted efforts on the part of National Tourism Council and other entities, there is influx of tourists estimated at around millions of visitors each year.This, in turn, will further boost the real estate sector across all segments including residential, hotel or commercial properties. The monthly report also noted that QR90bn expenditure on major projects (accounting for nearly 43% of total expenses) under the national budget 2020 will strongly support for the real east sector growth. (Peninsula Qatar) QCB: Public sector drives local currency deposits expansion in Qatar banks – The local currency time and savings (T&S) deposits of the public sector has considerably outpaced the total deposits expansion in Qatar’s banking industry during November 2019, according to the central bank data. The public sector T&S deposits’ growth was mainly on account of the local currency (T&S) deposits of the sovereign and government institutions during the review period, according to figures released by the Qatar Central Bank (QCB). Total (public, private and non-resident) deposits in the country’s commercial banks otherwise witnessed an about 5% YoY rise to QR830.46bn during November. The public sector’s total deposits shrank 4% YoY to QR260.2bn, mainly dragged by foreign currency T&S deposits during the review period. The public sector’s local currency T&S deposits soared 67% YoY to QR141.57bn, which constituted more than 54% of the total deposits of the public sector during November 2019. The local currency T&S deposits of government institutions almost doubled YoY to QR75.03bn and those of the sovereign shot up 65% to QR51.16bn; while those of the semi-government institutions fell 5% to QR15.37bn during the review period. On the other hand, the local currency demand deposits of public sector were down by a marginal 0.35% to QR28.17bn in the review period. Such deposits of sovereign and semi-government institutions declined 23% and 36% YoY to QR5bn and QR2.22bn respectively; whereas those of government institutions were seen gaining 14% to QR20.95bn during November 2019. The public sector foreign currency demand deposits registered an impressive 71% YoY surge to QR18.33bn; whereas foreign currency T&S deposits plummeted 51% to QR72.13bn during the review period. The foreign currency deposits of the sovereign reported 51% decline YoY to QR20.02bn, those of government institutions by 43% to QR61.36bn and those of semi-government institutions by 19% to QR9.07bn during November last year. (Gulf-Times.com)
- 3. Page 3 of 6 Qatar Stock Exchange Top Gainers Top Decliners Source: Qatar Stock Exchange (QSE) Source: Qatar Stock Exchange (QSE) Most Active Shares by Value (QR Million) Most Active Shares by Volume (Million) Source: Qatar Stock Exchange (QSE) Source: Qatar Stock Exchange (QSE) Investor Trading Percentage to Total Value Traded Net Traded Value by Nationality (QR Million) Source: Qatar Stock Exchange (QSE) Source: Qatar Stock Exchange (QSE) 3.0% 2.0% 1.4% 1.2% 1.1% 0.0% 1.5% 3.0% 4.5% Doha Bank Al Meera Consumer Goods Company Mazaya Qatar Real Estate Development Qatar Islamic Insurance Company Industries Qatar -9.9% -7.0% -6.7% -6.1% -5.5% -12.0% -8.0% -4.0% 0.0% Qatar First Bank Mesaieed Petrochemical Holding Company Qatar General Insurance & Reinsurance Company Qatari German Company for Medical Devices Dlala Brokerage & Investment Holding Company 243.8 134.3 81.8 54.7 53.0 0.0 90.0 180.0 270.0 QNB Group Masraf Al Rayan Qatar Fuel Company Qatar International Islamic Bank Ooredoo 45.6 36.3 33.6 25.7 18.0 0.0 17.0 34.0 51.0 EzdanHolding Group Baladna Masraf AlRayanQatar First Bank Doha Bank 0% 20% 40% 60% 80% 100% Buy Sell 25.59% 37.25% 28.84% 27.76% 10.81% 13.00% 34.77% 21.99% Qatari Individuals Qatari Institutions Non-Qatari Individuals Non-Qatari Institutions 646 541 771 415 -126 126 -200 0 200 400 600 800 1,000 Qatari Non-Qatari Net Investment Total Sold Total Bought
- 4. Page 4 of 6 TECHNICAL ANALYSIS OF THE QSE INDEX Source: Bloomberg The QE Index closed down by 0.64% from the week before, and closed at the 10,444.36 level. Our thesis has not changed over the past few weeks, as the Index kept moving inside the corrective channel and bounced below the strong resistance (around the 10,600 level). We keep our expected weekly-resistance level at 10,800 points and the 9,700 level as our weekly support. DEFINITIONS OF KEY TERMS USED IN TECHNICAL ANALYSIS RSI (Relative Strength Index) indicator – RSI is a momentum oscillator that measures the speedand change of price movements. The RSI oscillates between 0 to 100. The index is deemed to be overbought once the RSI approaches the 70 level, indicating that a correction is likely. On the other hand, if the RSI approaches 30, it is an indication that the index may be getting oversold and therefore likely to bounce back. MACD (Moving Average Convergence Divergence) indicator – The indicator consists of the MACD line and a signal line. The divergence or the convergence of the MACD line with the signal line indicates the strength in the momentum during the uptrend or downtrend, as the case may be. When the MACD crosses the signal line from below and trades above it, it gives a positive indication. The reverse is the situation for a bearish trend. Candlestick chart – A candlestick chart is a price chart that displays the high, low, open, and close for a security. The ‘body’ of the chart is portion between the open and close price, while the high and low intraday movements form the ‘shadow’. The candlestick may represent any time frame. We use a one-day candlestick chart (every candlestick represents one trading day) in our analysis. Doji candlestick pattern – A Doji candlestick is formed when a security's open and close are practically equal. The pattern indicates indecisiveness, and based on preceding price actions and future confirmation, may indicate a bullish or bearish trend reversal. ShootingStar/Inverted Hammer candlestick patterns – These candlestick patterns have a small real body (open price and close price are near to each other), and a long upper shadow (large intraday movement on the upside). The Shooting Star is a bearish reversal pattern that forms after a rally. The Inverted Hammer looks exactly like a Shooting Star, but forms after a downtrend. Inverted Hammers represent a potential bullish trend reversal.
- 5. Page 5 of 6 Source: Bloomberg Company Name Price January 09 % Change WTD % Change YTD Market Cap. QR Million TTM P/E P/B Div. Yield Qatar National Bank 20.69 0.53 0.49 191,102 14.8 2.7 2.9 Qatar Islamic Bank 15.39 (0.52) 0.39 36,366 13.3 2.2 3.2 Commercial Bank of Qatar 4.88 0.62 3.83 19,751 12.0 1.1 3.1 Doha Bank 2.73 3.02 7.91 8,464 12.0 0.9 3.7 Al Ahli Bank 3.50 0.00 0.00 8,099 12.0 1.4 2.6 Qatar International Islamic Bank 9.33 (3.91) (3.62) 14,123 16.2 2.4 4.3 Masraf Al Rayan 4.09 0.49 3.28 30,675 14.2 2.3 4.9 Al Khaliji Bank 1.33 0.76 1.53 4,788 8.2 0.8 5.6 Qatar First Bank 0.73 (9.90) (11.00) 510 N/A 0.7 N/A National Leasing 0.69 (0.14) (2.27) 341 21.7 0.5 7.3 Dlala Holding 0.57 (5.48) (6.87) 162 N/A 0.8 N/A Qatar & Oman Investment 0.65 (4.02) (3.59) 203 75.9 0.7 4.7 Islamic Holding Group 1.89 (3.08) (0.53) 107 200.9 0.8 N/A Banking and Financial Services 314,689 Zad Holding 13.86 (1.77) 0.29 3,285 15.4 2.2 6.1 Qatar German Co. for Medical Devices 0.54 (6.10) (7.39) 62 N/A 1.9 N/A Salam International Investment 0.50 (3.67) (3.48) 570 N/A 0.5 N/A Baladna 1.00 0.00 0.00 1,901 N/A N/A N/A Medicare Group 8.19 (3.08) (3.08) 2,305 28.4 2.3 22.0 Qatar Cinema & Film Distribution 2.20 0.00 0.00 138 17.9 1.0 6.8 Qatar Fuel 22.50 (2.17) (1.75) 22,371 18.6 2.7 3.6 Qatar Meat and Livestock 6.53 (4.67) (3.40) 1,175 11.1 3.5 6.9 Mannai Corp. 3.07 (1.29) (0.32) 1,401 5.2 0.6 6.5 Al Meera Consumer Goods 15.55 2.03 1.63 3,110 16.8 2.3 5.5 Consumer Goods and Services 36,318 Qatar Industrial Manufacturing 3.43 (2.28) (3.92) 1,630 14.5 1.0 7.3 Qatar National Cement 5.46 (2.33) (3.36) 3,568 14.7 1.2 9.2 Industries Qatar 10.50 1.06 2.14 63,525 19.6 1.9 5.7 Qatari Investors Group 1.72 (3.91) (3.91) 2,138 16.4 0.8 4.4 Qatar Electricity and Water 16.15 0.06 0.37 17,765 13.4 1.9 4.8 Aamal 0.80 (2.55) (1.48) 5,046 13.8 0.6 7.5 Gulf International Services 1.69 (2.87) (1.74) 3,141 N/A 0.9 N/A Mesaieed Petrochemical Holding 2.25 (7.02) (10.36) 28,267 33.1 1.9 3.6 Invesment Holding Group 0.55 (1.60) (2.13) 458 7.5 0.6 4.5 Qatar Aluminum Manufacturing 0.78 0.00 (0.51) 4,336 N/A N/A 2.6 Industrials 129,875 Qatar Insurance 3.18 0.00 0.63 10,386 17.7 1.3 4.7 Doha Insurance 1.13 (1.74) (5.83) 565 8.7 0.5 7.1 Qatar General Insurance & Reinsurance 2.35 (6.75) (4.47) 2,056 11.4 0.3 4.3 Al Khaleej Takaful Insurance 1.90 (3.06) (5.00) 485 12.1 0.9 2.6 Qatar Islamic Insurance 6.75 1.20 1.05 1,013 15.4 2.8 5.2 Insurance 14,505 United Development 1.50 (1.32) (1.32) 5,311 14.2 0.5 6.7 Barw a Real Estate 3.54 0.28 0.00 13,775 8.8 0.7 7.1 Ezdan Real Estate 0.60 (3.39) (2.76) 15,862 47.8 0.5 N/A Mazaya Qatar Real Estate Development 0.73 1.39 1.67 846 N/A 0.7 6.8 Real Estate 35,794 Ooredoo 7.01 (2.77) (0.99) 22,454 13.0 1.0 3.6 Vodafone Qatar 1.12 (3.45) (3.45) 4,734 31.7 1.1 4.5 Telecoms 27,189 Qatar Navigation (Milaha) 6.02 (1.15) (1.31) 6,894 12.8 0.5 5.0 Gulf Warehousing 5.35 (2.73) (2.37) 314 16.6 1.8 3.6 Qatar Gas Transport (Nakilat) 2.35 (2.89) (1.67) 13,020 13.6 2.0 4.3 Transportation 20,228 Qatar Exchange 581,420
- 6. Contacts Saugata Sarkar, CFA, CAIA Shahan Keushgerian Zaid al-Nafoosi , CMT, CFTe Head of Research Senior Research Analyst Senior Research Analyst Tel: (+974) 4476 6534 Tel: (+974) 4476 6509 Tel: (+974) 4476 6535 saugata.sarkar@qnbfs.com.qa shahan.keushgerian@qnbfs.com.qa zaid.alnafoosi@qnbfs.com.qa Mehmet Aksoy, PhD QNB Financial Services Co. W.L.L. Senior Research Analyst Contact Center: (+974) 4476 6666 Tel: (+974) 4476 6589 PO Box 24025 mehmet.aksoy@qnbfs.com.qa Doha, Qatar Disclaimer and Copyright Notice: This publication has been prepared by QNB Financial Services Co. W.L.L. (“QNB FS”) a wholly-owned subsidiary of Qatar National Bank (Q.P.S.C.). QNB FS is regulated by the Qatar Financial Markets Authority and the Qatar Exchange. Qatar National Bank (Q.P.S.C.) is regulated by the Qatar Central Bank. This publication expresses the views and opinions of QNB FS at a given time only. It is not an offer, promotion or recommendation to buy or sell securities or other investments, nor is it intended to constitute legal, tax, accounting, or financial advice. QNB FS accepts no liability whatsoever for any direct or indirect losses arising from use of this report. Any investment decision should depend on the individual circumstances of the investor and be based on specifically engaged investment advice. We therefore strongly advise potential investors to seek independent professional advice before making any investment decision. Although the information in this report has been obtained from sources that QNB FS believes to be reliable, we have not independently verified such information and it may not be accurate or complete. QNB FS does not make any representations or warranties as to the accuracy and completeness of the information it may contain, and declines any liability in that respect. For reports dealing with Technical Analysis, expressed opinions and/or recommendations may be different or contrary to the opinions/recommendations of QNB FS Fundamental Research as a result of depending solely on the historical technical data (price and volume). QNB FS reserves the right to amend the views and opinions expressed in this publication at any time. It may also express viewpoints or make investment decisions that differ significantly from, or even contradict, the views and opinions included in this report. This report may not be reproduced in whole or in part without permission from QNB FS COPYRIGHT: No part of this document may be reproduced without the explicit written permission of QNB FS. Page 6 of 6