QNBFS Weekly Market Report August 13, 2020
•
0 gefällt mir•226 views

The Qatar Stock Exchange Index increased by 2.03% over the week. Trading value and volume increased significantly by 125.3% and 162.0% respectively. Industries Qatar, Woqod and Masraf Al Rayan were the top contributors to the weekly index gain. Several companies reported their financial results for 2Q2020, with some seeing profits rise and others seeing profits decline compared to the prior periods. The market outlook remains uncertain due to the COVID-19 pandemic and lower oil prices.

Empfohlen
Weitere ähnliche Inhalte
Was ist angesagt?
Was ist angesagt? (20)
Ähnlich wie QNBFS Weekly Market Report August 13, 2020
Ähnlich wie QNBFS Weekly Market Report August 13, 2020 (20)
Mehr von QNB Group
Mehr von QNB Group (20)
Kürzlich hochgeladen
Kürzlich hochgeladen (20)
QNBFS Weekly Market Report August 13, 2020
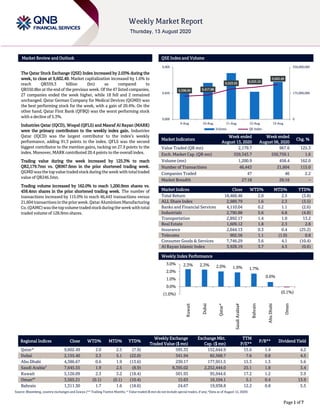
- 1. ````` Page 1 of 7 Market Review and Outlook QSE Index and Volume The Qatar Stock Exchange (QSE) Index increased by 2.03% during the week, to close at 9,602.49. Market capitalization increased by 1.6% to reach QR559.3 billion (bn) as compared to QR550.8bn at the end of the previous week. Of the 47 listed companies, 27 companies ended the week higher, while 18 fell and 2 remained unchanged. Qatar German Company for Medical Devices (QGMD) was the best performing stock for the week, with a gain of 20.4%. On the other hand, Qatar First Bank (QFBQ) was the worst performing stock with a decline of 5.3%. Industries Qatar (IQCD), Woqod (QFLS) and Masraf Al Rayan (MARK) were the primary contributors to the weekly index gain. Industries Qatar (IQCD) was the largest contributor to the index’s weekly performance, adding 91.3 points to the index. QFLS was the second biggest contributor to the mention gains, tacking on 27.9 points to the index. Moreover, MARK contributed 20.4 points to the overall index. Trading value during the week increased by 125.3% to reach QR2,179.7mn vs. QR967.6mn in the prior shortened trading week. QGMD wasthe topvalue tradedstockduring the weekwithtotaltraded value of QR246.5mn. Trading volume increased by 162.0% to reach 1,200.9mn shares vs. 458.4mn shares in the prior shortened trading week. The number of transactions increased by 115.0% to reach 46,443 transactions versus 21,604transactions inthe prior week. QatarAluminiumManufacturing Co.(QAMC)wasthetopvolumetradedstockduringtheweekwithtotal traded volume of 128.9mn shares. Market Indicators Week ended August 13, 2020 Week ended August 06, 2020 Chg. % Value Traded (QR mn) 2,179.7 967.6 125.3 Exch. Market Cap. (QR mn) 559,343.7 550,759.1 1.6 Volume (mn) 1,200.9 458.4 162.0 Number of Transactions 46,443 21,604 115.0 Companies Traded 47 46 2.2 Market Breadth 27:18 26:16 – Market Indices Close WTD% MTD% YTD% Total Return 18,460.46 2.0 2.5 (3.8) ALL Share Index 2,989.79 1.6 2.3 (3.5) Banks and Financial Services 4,110.04 0.2 1.1 (2.6) Industrials 2,790.88 5.6 6.8 (4.8) Transportation 2,892.17 1.4 1.0 13.2 Real Estate 1,609.12 1.8 2.3 2.8 Insurance 2,044.13 0.3 0.4 (25.2) Telecoms 902.56 1.1 (1.0) 0.8 Consumer Goods & Services 7,746.29 3.6 4.1 (10.4) Al Rayan Islamic Index 3,928.19 3.7 4.5 (0.6) Weekly Index Performance Regional Indices Close WTD% MTD% YTD% Weekly Exchange Traded Value ($ mn) Exchange Mkt. Cap. ($ mn) TTM P/E** P/B** Dividend Yield Qatar* 9,602.49 2.0 2.5 (7.9) 595.33 152,644.9 15.6 1.4 4.2 Dubai 2,155.40 2.3 5.1 (22.0) 341.94 82,568.7 7.6 0.8 4.5 Abu Dhabi 4,386.67 0.6 1.9 (13.6) 230.17 177,951.5 15.3 1.3 5.6 Saudi Arabia# 7,645.55 1.9 2.5 (8.9) 8,395.02 2,252,444.0 25.1 1.8 3.4 Kuwait 5,126.09 2.3 3.2 (18.4) 501.93 95,944.6 17.2 1.2 3.9 Oman## 3,565.21 (0.1) (0.1) (10.4) 15.63 16,104.1 5.1 0.4 13.9 Bahrain 1,311.30 1.7 1.6 (18.6) 24.67 19,938.8 12.2 0.8 5.5 Source: Bloomberg, country exchanges and Zawya (** Trailing Twelve Months; * Value traded ($ mn) do not include special trades, if any; #Data as of August 12, 2020) 9,398.90 9,417.88 9,523.63 9,553.10 9,602.49 0 175,000,000 350,000,000 9,000 9,450 9,900 9-Aug 10-Aug 11-Aug 12-Aug 13-Aug Volume QE Index 2.3% 2.3% 2.0% 1.9% 1.7% 0.6% (0.1%)(1.0%) 0.0% 1.0% 2.0% 3.0% Kuwait Dubai Qatar* SaudiArabia# Bahrain AbuDhabi Oman
- 2. Page 2 of 7 News Economic /Corporate News GISS' bottom line rises to QR45.3mn in 2Q2020 from QR4.0mn in 2Q2019, below our estimate – Gulf International Services' (GISS) net profit rose to QR45.3mn in 2Q2020 as compared to QR4.0mn in 2Q2019 and QR8.7mn in 1Q2020, below our estimate of QR86.8mn. The company's Revenue came in at QR727.3mn in 2Q2020, which represents a decrease of 3.3% YoY (-12.6% QoQ). In 1H2020, GISS reported net profit of QR54.0mn (1H2019: QR29.3mn) on 6.0% growth in revenue to QR1.6bn. EPS amounted to QR0.029 in 1H2020 as compared to QR0.016 in 1H2019. Net profit continued to reflect the growth across segments with aviation showing strong operational and financial performance on market expansion strategy. Similarly, the drilling segment showed a moderate recovery owing to rationalization of operating costs, including general and administrative expenses. However, top-line performance of the drilling segment was largely impacted by the lower rig utilization rates, due to travel restrictions imposed to contain the spread of COVID-19 pandemic which affected the crew repatriation process, which led to a reduction in revenues compared to last year. The operating profits improved 41% YoY to QR193mn in 1H2020, mainly attributable to the improved revenue compared to last year. Finance cost shrank 21% to QR98mn in 1H2020, on the back of the declining interest rates. GISS’ Chairman, Sheikh Khalid bin Khalifa Al-Thani, “Despite the macroeconomic challenges due to the spread of COVID-19 and recent deterioration of oil market, GISS repositioned itself by focusing on high assets utilization, combined with expanding market share and rationalizing operating costs, to build solid foundations for revenue and profit growth. This strategy has particularly helped all the segments to contribute to the group’s performance, which translated into the group’s improved financial performance." The drilling segment witnessed slight recovery net losses of 3% in 1H2020, due to savings on direct operating costs and lower finance costs. However, drilling revenues declined 11% to QR522mn. The aviation segment reported 16% jump in revenues to QR340mn, which translated into net earnings of QR362mn. The segment continued to maintain its leading position in the domestic market with 100% market share, while operating internationally in Europe, Africa and Asia, with a total fleet of 55 helicopters. Revenue within the insurance segment for the six months period ended June 30, 2020, increased significantly by 23%, as compared to the same period last year, to reach QR470mn. The insurance segment’s net profit grew 7% to QR12mn and revenues by 23% to QR470mn. The revenue growth was on the back of successful renewal of policies, along with improved pricing terms on all major accounts within the medical segment, which provided an assurance of continued revenue streams over the year. Moreover, the segment was further able to add new clients within its medical line of business. The catering arm saw a net profit of QR5mn on revenues of QR227mn. The revenue saw 9% growth due to successful expansion of core industrial catering and manpower contracting services and higher occupancy levels at Mesaieed and Dukhan camps. The group’s total assets stood at QR11bn. On the liquidity front, the closing cash, including short-term investments, were QR891mn. The total debt at group level stood at QR4.7bn as on June 30, 2020. A GISS’ Spokesman said, “Due to the recent uncertainty emanating from the unforeseen lowered operating backdrop, across the oil and gas industry, caused by the spread of the pandemic, the management has decided to temporarily defer all the proceedings of the proposed new debt restructuring and refinancing exercise to latter part of the year. “ (QNB FS Research, QSE, Gulf-Times.com) MRDS reports net loss of QR0.2mn in 2Q2020 – Mazaya Real Estate Development (MRDS) reported net loss of QR0.2mn in 2Q2020 as compared to net profit of QR25.1mn in 2Q2019 and net profit of QR6.9mn in 1Q2020.The company's ‘Income from operations’ came in at QR22.5mn in 2Q2020, which represents a decrease of 48.2% YoY (-2.8% QoQ). In 1H2020, MRDS posted net profit of QR6.7mn compared to QR13.6mn for the same period of the previous year. EPS amounted to QR0.006 in 1H2020 as compared to QR0.012 in 1H2019. (QSE) QCFS posts 6.8% YoY increase but 13.9% QoQ decline in net profit in 2Q2020 – Qatar Cinema and Film Distribution Company's (QCFS) net profit rose 6.8% YoY (but declined 13.9% on QoQ basis) to QR1.3mn in 2Q2020.The company's ‘Cinema Revenue’ came in at QR0.1mn in 2Q2020, which represents a decrease of 96.6% YoY (-94.5% QoQ). In 1H2020, QCFS posted net profit of QR2.7mn compared to net profit amounting to QR4.3mn for the same period of the previous year. EPS amounted to QR0.043 in 1H2020 as compared to QR0.069 in 1H2019. (QSE) QOIS posts 177.8% YoY increase but 0.3% QoQ decline in net profit in 2Q2020 – Qatar Oman Investment Company's (QOIS) net profit rose 177.8% YoY (but declined 0.3% on QoQ basis) to QR1.8mn in 2Q2020.The company's ‘Net investment and interest income’ came in at QR2.6mn in 2Q2020, which represents an increase of 402.5% YoY. However, on QoQ basis Net investmentand interest income fell 15.5%. In 1H2020, QOIS recorded net profit of QR3.6mn compared to QR4.0mn for the same period of the previous year. EPS amounted to QR0.012 in 1H2020 as compared to QR0.013 in 1H2019. (QSE) MERS' bottom line rises ~12% YoY and QoQ in 2Q2020 – Al Meera Consumer Goods Company's (MERS) net profit rose ~12% YoY (+~12% QoQ) to ~QR57mn in 2Q2020. In 1H2020, MERS posted net profit of QR107.17mn compared to QR94.99mn in 1H2019. EPS amounted to QR0.54 in 1H2020 as compared to QR0.47 in 1H2019. (QSE) DBIS reports net loss of QR0.2mn in 2Q2020 – Dlala Brokerage and Investments Holding Company (DBIS) reported net loss of QR0.2mn in 2Q2020 as compared to net loss of QR4.8mn in 2Q2019 and net profit of QR2.5mn in 1Q2020.The company's ‘Net brokerage commission income’ came in at QR3.7mn in 2Q2020, which represents an increase of 6.3% YoY. However, on QoQ basis ‘Net brokerage commission income’ fell 8.2%. In 1H2020, DBIS posted net profit of QR2.3mn compared to net loss amounting to QR3.7mn for the same period of the previous year.
- 3. Page 3 of 7 The earnings per share amounted to QR0.008 in 1H2020 as compared to loss per share of QR0.013 in 1H2019. (QSE) MCCS reports net loss of QR181.7mn in 2Q2020 – Mannai Corporation (MCCS) reported net loss of QR181.7mn in 2Q2020 as compared to net profit of QR37.9mn in 2Q2019 and net loss of QR21.1mn in 1Q2020. The company's Revenue came in at QR2,678.3mn in 2Q2020, which represents a decrease of 5.9% YoY. However, on QoQ basis Revenue rose 0.5%. In 1H2020, MCCS posted net loss of QR202.8mn compared to net profit amounting to QR87.4mn for the same period of the previous year. Loss per share amounted to QR0.44 in 1H2020 as compared to earnings per share of QR0.19 in 1H2019. (QSE) IGRD's net profit declines 52.9% YoY and 40.9% QoQ in 2Q2020, below our estimate – Investment Holding Group's (IGRD) net profit declined 52.9% YoY (-40.9% QoQ) to QR5.7mn in 2Q2020, below our estimate of QR7.6mn. The company's Revenue came in at QR74.8mn in 2Q2020, which represents a decrease of 35.2% YoY (-1.7% QoQ). In 1H2020, IGRD posted net profit of QR15.4mn compared to net profit amounted to QR27.8mn for the same period of the previous year. EPS amounted to QR0.019 in 1H2020 as compared to QR0.034 in 1H2019. (QSE) SIIS reports net loss of QR48.5mn in 2Q2020 – Salam International Investment Limited (SIIS) reported net loss of QR48.5mn in 2Q2020 as compared to net profit of QR52.6mn in 2Q2019 and net loss of QR37.5mn in 1Q2020.The company's Operating Revenue came in at QR257.4mn in 2Q2020, which represents a decrease of 51.5% YoY (-31.8% QoQ). In 1H2020, SIIS recorded net loss of QR86.0mn as compared to net profit of QR58.2mn attained in the same period in 2019. Loss per share amounted to QR0.075 in 1H2020 as compared to earnings per share of QR0.051 in 1H2019. (QSE) DOHI posts 2.7% YoY decrease but 17.0% QoQ increase in net profit in 2Q2020 – Doha Insurance Group's (DOHI) net profit declined 2.7% YoY (but rose 17.0% on QoQ basis) to QR17.2mn in 2Q2020.The company's Net Premiums came in at QR96.5mn in 2Q2020, which represents an increase of 42.3% YoY. However, on QoQ basis Net Premiums fell 0.4%. EPS amounted to QR0.03 in 2Q2020 as compared to QR0.04 in 2Q2019 (1Q2020: QR0.03). In 1H2020, DOHI’s net profit reached to QR32.0mn compared to net profit of QR35.4mn for the same period of the previous year. EPS amounted to QR0.06 for the period ending on the June 30, 2020 as compared to QR0.07 for the same period of the previous year. (QSE) QGMD reports net profit of QR1.2mn in 2Q2020 – Qatari German Company for Medical Devices (QGMD) reported net profit of QR1.2mn in 2Q2020 as compared to net loss of QR2.6mn in 2Q2019 and net loss of QR2.4mn in 1Q2020.The company's Revenue came in at QR9.3mn in 2Q2020, which represents an increase of 585.9% YoY (+352.5% QoQ). In 1H2020, QGMD posted net loss of QR1.1mn as compared to net loss of QR5.6mn for the same period of the previous year. Loss per share amounted to QR0.010 in 1H2020 as compared to loss per share of QR0.049 in 1H2019. (QSE)
- 4. Page 4 of 7 Qatar Stock Exchange Top Gainers Top Decliners Source: Qatar Stock Exchange (QSE) Source: Qatar Stock Exchange (QSE) Most Active Shares by Value (QR Million) Most Active Shares by Volume (Million) Source: Qatar Stock Exchange (QSE) Source: Qatar Stock Exchange (QSE) Investor Trading Percentage to Total Value Traded Net Traded Value by Nationality (QR Million) Source: Qatar Stock Exchange (QSE) Source: Qatar Stock Exchange (QSE) 20.4% 9.3% 8.8% 7.3% 6.1% 0.0% 8.0% 16.0% 24.0% Qatari German Company for Medical Devices Industries Qatar Gulf Warehousing Company Qatar Aluminium Manufacturing Company Qatar Cinema & Film Distribution Company -5.3% -3.7% -3.0% -2.4% -2.2% -6.0% -4.0% -2.0% 0.0% Qatar First Bank Qatari Investors Group Ahli Bank Dlala Brokerage & Investment Holding Company The Commercial Bank 246.5 172.1 118.0 107.3 105.4 0.0 100.0 200.0 300.0 Qatari German Company for Medical Devices QNB Group Qatar Aluminium Manufacturing Company Alijarah Holding Masraf Al Rayan 128.9 123.9 112.8 95.5 94.4 0.0 45.0 90.0 135.0 Qatar Aluminium Manufacturing Company Investment Holding Group Alijarah Holding Qatari German Company for Medical Devices Salam International Investment Limited 0% 20% 40% 60% 80% 100% Buy Sell 46.67% 50.73% 26.55% 20.87% 15.03% 15.47% 11.75% 12.94% Qatari Individuals Qatari Institutions Non-Qatari Individuals Non-Qatari Institutions 1,597 584 1,562 620 35 -35 -500 0 500 1,000 1,500 2,000 Qatari Non-Qatari Net Investment Total Sold Total Bought
- 5. Page 5 of 7 TECHNICAL ANALYSIS OF THE QSE INDEX Source: Bloomberg The QE Index closed in the green, gaining 2.03% from the week before and finished at the 9,602.49 level. It managed to breach above the 200-day moving average, which is great feat and poises the Index to move higher in the foreseen future. We update our weekly support to the 9,300 level and the resistance to the 9,800 level. DEFINITIONS OF KEY TERMS USED IN TECHNICAL ANALYSIS RSI (Relative Strength Index) indicator – RSI is a momentum oscillator that measures the speedand change of price movements. The RSI oscillates between 0 to 100. The index is deemed to be overbought once the RSI approaches the 70 level, indicating that a correction is likely. On the other hand, if the RSI approaches 30, it is an indication that the index may be getting oversold and therefore likely to bounce back. MACD (Moving Average Convergence Divergence) indicator – The indicator consists of the MACD line and a signal line. The divergence or the convergence of the MACD line with the signal line indicates the strength in the momentum during the uptrend or downtrend, as the case may be. When the MACD crosses the signal line from below and trades above it, it gives a positive indication. The reverse is the situation for a bearish trend. Candlestick chart – A candlestick chart is a price chart that displays the high, low, open, and close for a security. The ‘body’ of the chart is portion between the open and close price, while the high and low intraday movements form the ‘shadow’. The candlestick may represent any time frame. We use a one-day candlestick chart (every candlestick represents one trading day) in our analysis. Doji candlestick pattern – A Doji candlestick is formed when a security's open and close are practically equal. The pattern indicates indecisiveness, and based on preceding price actions and future confirmation, may indicate a bullish or bearish trend reversal. ShootingStar/Inverted Hammer candlestick patterns – These candlestick patterns have a small real body (open price and close price are near to each other), and a long upper shadow (large intraday movement on the upside). The Shooting Star is a bearish reversal pattern that forms after a rally. The Inverted Hammer looks exactly like a Shooting Star, but forms after a downtrend. Inverted Hammers represent a potential bullish trend reversal.
- 6. Page 6 of 7 Source: Bloomberg Company Name Price August 13 % Change WTD % Change YTD Market Cap. QR Million TTM P/E P/B Div. Yield Qatar National Bank 18.18 0.00 (11.70) 167,918 14.4 2.4 3.3 Qatar Islamic Bank 16.13 (0.25) 5.22 38,114 13.5 2.3 3.3 Commercial Bank of Qatar 4.03 (2.23) (14.26) 16,310 9.2 0.9 5.0 Doha Bank 2.42 (0.25) (4.19) 7,516 14.4 0.8 N/A Al Ahli Bank 3.20 (3.03) (4.00) 7,775 12.7 1.3 4.5 Qatar International Islamic Bank 8.59 3.45 (11.30) 12,997 14.7 2.2 4.9 Masraf Al Rayan 4.02 2.13 1.57 30,165 13.8 2.3 5.6 Al Khaliji Bank 1.60 (0.12) 22.14 5,760 9.6 1.0 4.7 Qatar First Bank 1.40 (5.34) 71.27 981 N/A 2.0 N/A National Leasing 0.95 4.86 34.61 470 17.5 0.7 5.3 Dlala Holding 1.92 (2.39) 214.24 546 N/A 2.7 N/A Qatar & Oman Investment 0.86 (1.94) 28.40 271 32.6 0.9 2.3 Islamic Holding Group 3.90 (1.59) 105.26 221 72.0 1.6 N/A Banking and Financial Services 289,042 Zad Holding 15.00 (0.66) 8.54 3,555 17.2 2.2 5.7 Qatar German Co. for Medical Devices 2.70 20.45 364.60 312 N/A 10.6 N/A Salam International Investment 0.47 1.75 (9.86) 533 N/A 0.3 N/A Baladna 1.85 (1.44) 85.30 3,523 N/A 1.6 1.1 Medicare Group 7.49 (0.89) (11.33) 2,109 29.1 2.2 24.0 Qatar Cinema & Film Distribution 3.51 6.07 59.59 221 48.1 1.6 2.8 Qatar Fuel 16.91 5.03 (26.16) 16,813 17.9 2.2 4.7 Qatar Meat and Livestock 7.15 5.91 5.75 1,287 15.1 3.7 4.2 Mannai Corp. 2.80 (2.17) (9.16) 1,276 N/A 0.5 7.1 Al Meera Consumer Goods 20.00 2.67 30.72 4,000 20.2 2.9 4.3 Consumer Goods and Services 33,628 Qatar Industrial Manufacturing 2.74 0.85 (23.14) 1,304 13.9 0.8 5.5 Qatar National Cement 3.92 4.93 (30.71) 2,559 18.5 0.9 7.7 Industries Qatar 8.80 9.32 (14.40) 53,240 33.7 1.6 4.5 Qatari Investors Group 2.29 (3.75) 27.71 2,842 28.1 1.0 2.4 Qatar Electricity and Water 17.00 2.53 5.66 18,700 12.9 2.2 4.6 Aamal 0.77 3.52 (5.90) 4,820 30.1 0.6 5.2 Gulf International Services 1.72 1.96 (0.12) 3,193 46.3 0.9 N/A Mesaieed Petrochemical Holding 2.15 3.37 (14.34) 27,011 27.8 1.9 3.3 Invesment Holding Group 0.52 (0.19) (8.51) 428 10.0 0.5 N/A Qatar Aluminum Manufacturing 0.93 7.29 18.69 5,173 N/A 0.9 1.1 Industrials 119,269 Qatar Insurance 2.00 (0.55) (36.74) 6,529 N/A 0.9 7.5 Doha Insurance 1.10 4.36 (8.33) 550 12.5 0.5 7.3 Qatar General Insurance & Reinsurance 2.25 2.27 (8.54) 1,969 N/A 0.4 N/A Al Khaleej Takaful Insurance 1.94 3.14 (3.10) 495 15.3 0.9 2.6 Qatar Islamic Insurance 6.22 (1.30) (6.96) 932 13.7 2.5 6.0 Insurance 10,475 United Development 1.18 1.99 (22.43) 4,175 18.5 0.4 4.2 Barw a Real Estate 3.31 2.26 (6.50) 12,880 8.1 0.7 6.0 Ezdan Real Estate 1.39 (0.43) 126.67 36,976 3883.0 1.2 N/A Mazaya Qatar Real Estate Development 0.89 2.67 23.09 1,024 40.0 0.8 N/A Real Estate 55,055 Ooredoo 6.56 0.54 (7.40) 21,000 12.5 0.9 3.8 Vodafone Qatar 1.28 2.56 10.52 5,419 37.3 1.2 3.9 Telecoms 26,419 Qatar Navigation (Milaha) 5.93 2.03 (2.84) 6,788 12.7 0.5 5.1 Gulf Warehousing 5.38 8.79 (1.75) 316 13.3 1.8 3.7 Qatar Gas Transport (Nakilat) 2.80 0.00 17.15 15,513 14.5 2.6 3.6 Transportation 22,616 Qatar Exchange 559,344
- 7. Contacts Saugata Sarkar, CFA, CAIA Shahan Keushgerian Zaid al-Nafoosi , CMT, CFTe Head of Research Senior Research Analyst Senior Research Analyst Tel: (+974) 4476 6534 Tel: (+974) 4476 6509 Tel: (+974) 4476 6535 saugata.sarkar@qnbfs.com.qa shahan.keushgerian@qnbfs.com.qa zaid.alnafoosi@qnbfs.com.qa Mehmet Aksoy, PhD QNB Financial Services Co. W.L.L. Senior Research Analyst Contact Center: (+974) 4476 6666 Tel: (+974) 4476 6589 PO Box 24025 mehmet.aksoy@qnbfs.com.qa Doha, Qatar Disclaimer and Copyright Notice: This publication has been prepared by QNB Financial Services Co. W.L.L. (“QNB FS”) a wholly-owned subsidiary of Qatar National Bank (Q.P.S.C.). QNB FS is regulated by the Qatar Financial Markets Authority and the Qatar Exchange. Qatar National Bank (Q.P.S.C.) is regulated by the Qatar Central Bank. This publication expresses the views and opinions of QNB FS at a given time only. It is not an offer, promotion or recommendation to buy or sell securities or other investments, nor is it intended to constitute legal, tax, accounting, or financial advice. QNB FS accepts no liability whatsoever for any direct or indirect losses arising from use of this report. Any investment decision should depend on the individual circumstances of the investor and be based on specifically engaged investment advice. We therefore strongly advise potential investors to seek independent professional advice before making any investment decision. Although the information in this report has been obtained from sources that QNB FS believes to be reliable, we have not independently verified such information and it may not be accurate or complete. QNB FS does not make any representations or warranties as to the accuracy and completeness of the information it may contain, and declines any liability in that respect. For reports dealing with Technical Analysis, expressed opinions and/or recommendations may be different or contrary to the opinions/recommendations of QNB FS Fundamental Research as a result of depending solely on the historical technical data (price and volume). QNB FS reserves the right to amend the views and opinions expressed in this publication at any time. It may also express viewpoints or make investment decisions that differ significantly from, or even contradict, the views and opinions included in this report. This report may not be reproduced in whole or in part without permission from QNB FS COPYRIGHT: No part of this document may be reproduced without the explicit written permission of QNB FS. Page 7 of 7