QNBFS Weekly Market Report April 18, 2019
•
1 gefällt mir•1,291 views

The Qatar Stock Exchange (QSE) Index increased by 89.12 points or 0.87% during the trading week to close at 10,348.19

Empfohlen
Empfohlen
Weitere ähnliche Inhalte
Mehr von QNB Group
Mehr von QNB Group (20)
Kürzlich hochgeladen
Kürzlich hochgeladen (20)
QNBFS Weekly Market Report April 18, 2019
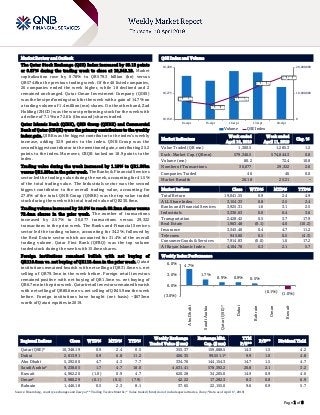
- 1. ` Page 1 of 8 Market Review and Outlook QSE Index and Volume The Qatar Stock Exchange (QSE) Index increased by 89.12 points or 0.87% during the trading week to close at 10,348.19. Market capitalization rose by 0.78% to QR579.3 billion (bn) versus QR574.8bn the previous trading week. Of the 46 listed companies, 26 companies ended the week higher, while 18 declined and 2 remained unchanged. Qatar Oman Investment Company (QOIS) was the best performing stock for the week with a gain of 14.7% on a trading volume of 1.4 million (mn) shares. On the other hand, Zad Holding (ZHCD) was the worst performing stock for the week with a decline of 7.1% on 72.6 k (thousand) shares traded. Qatar Islamic Bank (QIBK), QNB Group (QNBK) and Commercial Bank of Qatar (CBQK) were the primary contributors to the weekly index gain. QIBK was the biggest contributor to the index’s weekly increase, adding 32.9 points to the index. QNB Group was the secondbiggestcontributortothementionedgain,contributing 25.2 points to the index. Moreover, CBQK tacked on 18.9 points to the index. Trading value during the week increased by 1.18% to QR1.30bn versus QR1.29bn in the prior week. The Banks & Financial Services sector led the trading value during the week, accounting for 41.5% of the total trading value. The Industrials sector was the second biggest contributor to the overall trading value, accounting for 27.8% of the total. QNB Group (QNBK) was the top value traded stock during the week with total traded value of QR230.8mn. Trading volume increased by 10.8% to reach 80.2mn shares versus 72.4mn shares in the prior week. The number of transactions increased by 2.57% to 30,077 transactions versus 29,322 transactions in the prior week. The Banks and Financial Services sector led the trading volume, accounting for 34.2%, followed by the Real Estate sector which accounted for 31.4% of the overall trading volume. Qatar First Bank (QFBQ) was the top volume traded stock during the week with 15.8mn shares. Foreign institutions remained bullish with net buying of QR110.0mn vs. net buying of QR118.4mn in the prior week. Qatari institutions remained bearish with net selling of QR31.0mn vs. net selling of QR79.3mn in the week before. Foreign retail investors remained positive with net buying of QR1.5mn vs. net buying of QR6.7mninthepriorweek.Qatariretailinvestorsremainedbearish with net selling of QR80.6mn vs. net selling of QR45.9mn the week before. Foreign institutions have bought (net basis) ~$673mn worth of Qatari equities in 2019. Market Indicators Week ended April 18, 2019 Week ended April 11, 2019 Chg. % Value Traded (QR mn) 1,300.5 1,285.3 1.2 Exch. Market Cap. (QR mn) 579,346.5 574,844.3 0.8 Volume (mn) 80.2 72.4 10.8 Number of Transactions 30,077 29,322 2.6 Companies Traded 46 46 0.0 Market Breadth 26:18 25:21 – Market Indices Close WTD% MTD% YTD% Total Return 19,041.55 0.9 2.4 4.9 ALL Share Index 3,154.33 0.8 2.5 2.4 Banks and Financial Services 3,925.31 1.6 3.1 2.5 Industrials 3,330.63 0.0 0.4 3.6 Transportation 2,428.42 0.5 3.7 17.9 Real Estate 1,963.48 (0.1) 4.0 (10.2) Insurance 3,345.40 0.4 4.7 11.2 Telecoms 945.80 0.5 0.5 (4.3) Consumer Goods & Services 7,914.83 (0.0) 1.0 17.2 Al Rayan Islamic Index 4,104.78 0.3 2.1 5.7 Market Indices Weekly Index Performance Regional Indices Close WTD% MTD% YTD% Weekly Exchange Traded Value ($ mn) Exchange Mkt. Cap. ($ mn) TTM P/E** P/B** Dividend Yield Qatar (QSE)* 10,348.19 0.9 2.4 0.5 355.37 159,088.5 14.3 1.5 4.2 Dubai 2,813.91 0.9 6.8 11.2 406.35 99,551.1# 9.9 1.0 4.8 Abu Dhabi 5,292.00 4.7 4.3 7.7 334.76 144,154.3 14.7 1.5 4.7 Saudi Arabia# 9,238.05 1.7 4.7 18.0 4,631.41 578,392.2 20.8 2.1 3.2 Kuwait 4,962.20 (1.0) 0.9 4.7 620.28 34,205.0 14.9 0.9 4.0 Oman# 3,980.29 (0.1) (0.1) (7.9) 42.22 17,282.3 8.3 0.8 6.9 Bahrain 1,446.18 0.5 2.3 8.1 37.65 22,155.0 9.6 0.9 5.7 Source: Bloomberg, country exchanges and Zawya (** Trailing Twelve Months; * Value traded ($ mn) do not include special trades, if any; #Data as of April 17, 2019) 10,235.76 10,221.52 10,258.75 10,308.17 10,348.19 0 10,000,000 20,000,000 10,150 10,275 10,400 14-Apr 15-Apr 16-Apr 17-Apr 18-Apr Volume QSE Index 4.7% 1.7% 0.9% 0.9% 0.5% (0.1%) (1.0%)(3.0%) 0.0% 3.0% 6.0% AbuDhabi SaudiArabia Qatar(QSE)* Dubai Bahrain Oman Kuwait
- 2. Page 2 of 8 Stock Split Dates for Listed Qatari Companies Source: QSE News Economic News Qatar’s CPI inflation declines 1.31% YoY in March – Lower expenses - especially towards the communication, recreation, housing and transport segments - led Qatar’s cost of living, based on Consumer Price Index (CPI), to decline 1.31% YoY in March 2019, according to official data. The CPI-based cost of living was down a marginal 0.03% on a monthly basis, despite increased expenses towards clothing and footwear, according to the Planning and Statistics Authority’s data. Highlighting that headline inflation remains subdued, the International Monetary Fund (IMF), after its officials concluded their visit to Qatar, stated the proposed restructuring in the fiscal space, including taxation, may slightly lift price levels in the future. (Gulf- Times.com) S&P publishes its report on the Qatari banking system – S&P Global Ratings (S&P) published its report on Qatar, ‘Banking Industry Country Risk Assessment: Qatar’. In its report, S&P stated, “We classify the banking sector of Qatar (AA-/Stable/A- 1+) in group '5' under our Banking Industry Country Risk Assessment (BICRA). Qatar has a wealthy economy, with high GDP per capita, at about $69,700 in 2018. It holds the third- largest proven natural gas reserves in the world, and is one of the largest exporters of Liquefied Natural Gas globally. We believe Qatar has effectively managed the ongoing boycott's impact on its economy. (Bloomberg) Qatar’s hospitality sector records strong growth; hotel occupancy rate up 7% YoY – Collective efforts in boosting Qatar’s hospitality and tourism industry have witnessed positive results. Despite the ongoing blockade for more than 21 months, the occupancy of hotels across all categories witnessed solid YoY growth in February 2019. The average occupancy of hotels (all categories put together) jumped to 67% in February 2019 registering 7 percentage points improvement in YoY growth against 60% recorded in the corresponding month last year, official data showed. The average revenue per available room has increased by QR10 to QR246 in February 2019 from QR236 in February 2018. This remarkable improvement in the performance of the hotel industry can be attributed to increase in the number of tourists. In February 2019 some 376,106 people visited Qatar, which is about 8.2% more than the same month last year. When compared on monthly basis, the number of visitors saw a sharp jump of over 90% compared to 196,594 visitors in January 2019. (Peninsula Qatar) Qatar Petroleum issues tender invitation for four LNG mega trains of NFE project – Qatar Petroleum (QP) has issued the invitation to tender package for the engineering procurement and construction (EPC) of the four Liquefied Natural Gas (LNG) mega-trains of its North Field Expansion (NFE) project. The package has been issued to three EPC joint ventures: (i) Chiyoda Corporation and Technip France, (ii) JGC Corporation and Hyundai Engineering and Construction, and (iii) Saipem,
- 3. Page 3 of 8 McDermott Middle East Inc. and CTCI Corporation. The tender calls for the EPC of the four mega-LNG trains with gas and liquid treating facilities, ethane and liquefied petroleum gas production and fractionation, a helium plant, and utilities and infrastructure to support the processing units. The four mega- LNG trains are part of QP's plans to expand Qatar’s LNG production from 77mn tons per annum (mtpa) to 110mtpa by 2024. "This tender package comes in line with QP’s plan to move into the next significant phase of the NFE project, which will culminate in the award of this EPC contract in January 2020," according to HE Saad Sherida Al-Kaabi, Minister of State for Energy Affairs as well as President and CEO of QP. (Gulf- Times.com) CBQK's bottom line rises 6.5% YoY and 6.8% QoQ in 1Q2019, in- line with our estimate – The Commercial Bank's (CBQK) net profit rose 6.5% YoY (+6.8% QoQ) to QR431.1mn in 1Q2019, in line with our estimate of QR425.0mn (variation of +1.4%). Net interest income decreased 11.9% YoY in 1Q2019 to QR580.6mn. However, on QoQ basis, net interest income rose 1.2%. The company's revenue came in at QR899.8mn in 1Q2019, which represents a decrease of 2.1% YoY. However, on QoQ basis, revenue rose 6.5%. The bank's total assets stood at QR144.0bn at the end of March 31, 2019, down 1.6% YoY. However, on QoQ basis, the bank's total assets increased 6.6%. Loans and advances to customers gained by 1.7% YTD to QR85.2bn. Customer deposits rose 14.4% YTD to reach QR81.6bn at the end of March 31, 2019. Earnings per share amounted to QR1.07 in 1Q2019 as compared to QR1.00 in 1Q2018. (QNB FS Research, QSE) MARK's bottom line rises 2.5% YoY and 9.2% QoQ in 1Q2019, in-line with our estimate – Masraf Al Rayan's (MARK) net profit rose 2.5% YoY (+9.2% QoQ) to QR544.2mn in 1Q2019, in line with our estimate of QR534.1mn (variation of +1.9%). Total net income from financing and investing activities increased 0.6% YoY and 1.6% QoQ in 1Q2019 to QR1.11bn. The company's total income came in at QR1.26bn in 1Q2019, which represents an increase of 2.1% YoY (+4.0% QoQ). The bank's total assets stood at QR100.3bn at the end of March 31, 2019, down 3.1% YoY. However, on QoQ basis, the bank's total assets increased 3.1%. Financing assets were QR75.9bn, registering a rise of 4.5% YoY (+4.6% QoQ) at the end of March 31, 2019. Customer current accounts rose 2.4% YoY and 6.6% QoQ to reach QR7.7bn at the end of March 31, 2019. EPS increased to QR0.726 in 1Q2019 from QR0.708 in 1Q2018. MARK’s return on average assets continues to be one of the highest in the market at 2.20%. Return on average shareholders’ equity of the bank reached 17.0%. Capital adequacy ratio, using Basel-III standards and QCB regulations, reached 19.28%. The bank’s operational efficiency ratio (cost to income ratio) stood at 22.78%. Non-performing financing (NPF) ratio reached 0.74%, reflecting very strong and prudent credit and risk management policies and procedures. (QNB FS Research, QSE, Peninsula Qatar) QIBK posts 9.6% YoY increase but 8.6% QoQ decline in net profit in 1Q2019, modestly beating our estimate – Qatar Islamic Bank's (QIBK) net profit rose 9.6% YoY (but declined 8.6% on QoQ basis) to QR685.2mn in 1Q2019, modestly beating our estimate of QR650.7mn (variation of +5.3%). Total net income from financing and investing activities increased 16.3% YoY and 12.4% QoQ in 1Q2019 to QR1.68bn. The company's total income came in at QR1.85.5bn in 1Q2019, which represents an increase of 13.0% YoY (+3.2% QoQ). The bank's total assets stood at QR155.3bn at the end of March 31, 2019, up 2.3% YoY (+1.4% QoQ). Financing assets were QR106.3bn, registering a rise of 1.6% YoY (+4.0% QoQ) at the end of March 31, 2019. Customers' current accounts declined 13.3% YoY and 2.0% QoQ to reach QR15.1bn at the end of March 31, 2019. EPS increased to QR2.90 in 1Q2019 from QR2.65 in 1Q2018. Total expenses of QR267.1mn for the three months’ period ended March 31, 2019 are 8.1% lower than QR290.7mn from a year ago. Strict cost controls supporting higher operating revenues enabled further enhancement of efficiency, bringing down the cost to income ratio to 23.2% for 1Q2019 as compared to 26.5% for 1Q2018. QIBK was able to maintain the ratio of non-performing financing assets to total financing assets at 1.2%, reflecting the quality of the bank’s financing assets portfolio and its effective risk management framework. QIBK continues to pursue the conservative impairment provisioning policy with the coverage ratio for non-performing financing assets at 100% as of March 2019. Total shareholders’ equity of the bank has reached QR14.9bn. Total Capital adequacy of the bank under Basel III guidelines is 18.7% as of March 2019, higher than the minimum regulatory requirements prescribed by Qatar Central Bank and the Basel Committee. (QNB FS Research, QSE, Gulf-Times.com) ABQK's bottom line rises 0.8% YoY and 38.9% QoQ in 1Q2019, in-line with our estimate – Ahli Bank's (ABQK) net profit rose 0.8% YoY (+38.9% QoQ) to QR177.5mn in 1Q2019, in line with our estimate of QR177.8mn (variation of -0.2%). Net interest income decreased 1.0% YoY and 0.2% QoQ in 1Q2019 to QR204.0mn. The company's total revenue came in at QR262.5mn in 1Q2019, which represents an increase of 0.6% YoY. However, on QoQ basis, total revenue fell 14.0%. Loans and advances to customers were QR28.0bn, registering a growth of 2.5% YTD. Deposits & CDs expanded by 12.4% YTD to QR24.8bn. (QNB FS Research, QSE) AKHI’s AGM and EGM endorses items on its agenda and approves the distribution of 5% cash dividend – Al Khaleej Takaful Insurance Company (AKHI) announced the results of the AGM and EGM, which was held on April 17, 2019. The AGM approved the board of directors’ recommendation to distribute 5% cash dividends to shareholders. In the EGM following resolutions were approved: 1) Amending Article (3) of the Articles of Association concerning the company's purposes by adding the following paragraphs: a) extended warranty services: The company carries out extended warranty insurance for vehicles, equipment, electronic and electrical equipment. B) Selling insurance salvage: Sale of damaged cars, electrical and electronic equipment and all insurance salvage of any type. 2) Amending the Articles of Association in accordance with the decision of the board of directors of Qatar Financial Markets Authority issued on December16, 2018 regarding the stock split of the shares. (QSE) GISS announces Gulf Helicopters acquires a 49% stake in Air Ocean Maroc – Gulf International Services (GISS) announced that Gulf Helicopters Company, a fully owned subsidiary of GISS, acquired a 49% stake for an amount of $1mn in Air Ocean Maroc, a Moroccan company specialized in aviation and medical evacuation in Morocco. Gulf Helicopters’ CEO, Mohamed Ibrahim Al Mohannadi said, "This 49% acquisition of Air Ocean
- 4. Page 4 of 8 Maroc represents a new important milestone in our roadmap to expand our global presence and to serve the North-West Africa and Southern Europe." The acquisition comes in line with GISS' strategy to enter new and profitable international markets, such as North-West Africa and Southern Europe that have greater potential. This international expansion will undoubtedly support the company in its efforts to increase sources of income and utilize its assets more efficiently, while establishing itself as a leading global aviation service provider. Gulf Helicopters will continue to explore further opportunities and areas to strengthen its global footprint by engaging in effective partnerships with key players in various promising markets. Air Ocean Maroc currently holds an Air Operator Certificate for the Fixed Wing and is also in the process of obtaining an Air Operator Certificate for Helicopters. (QSE) GDI sells its ‘Al-Doha’ jack-up rig to India's Star Matrix for $1.9mn – Gulf Drilling International (GDI), a subsidiary of Gulf International Services (GISS), has sold the ‘Al-Doha’ jack-up rig to India’s Star Matrix for $1.9mn, the company announced. Delivered in 1981 by Mitsubishi Heavy Industries, the Mitsubishi MD T76J-Viii self-elevating, independent-leg cantilever jack-up drilling rig, Al-Doha has a long and successful operational history offshore Qatar. GDI has impaired the drilling rig Al-Doha as declared in its 2018 financial statements due to being off contract and unmarketable in its present technical conditions. GDI, as part of its efforts to modernize its fleet and provide the most modern and efficient assets to its clients, decided to recycle Al-Doha in an environmentally-responsible manner and in compliance with the Hong Kong International Convention for the safe and environmentally sound recycling of ships. With the sale of the Al-Doha complete, the company will continue to operate eight jack-ups, eight land rigs, two lift- boats, and one accommodation barge. (Qatar Tribune) ERES reports net profit of QR272.4mn in 1Q2019 – Ezdan Holding Group (ERES) reported net profit of QR272.4mn in 1Q2019 as compared to net profit of QR103.3mn (+163.7% YoY) in 1Q2018 and net loss of QR29.7mn in 4Q2018. The company's rental income came in at QR338.4mn in 1Q2019, which represents an increase of 2.3% YoY (+2.5% QoQ). EPS increased to QR0.10 in 1Q2019 from QR0.04 in 1Q2018. (QSE)
- 5. Page 5 of 8 Qatar Stock Exchange Top Gainers Top Decliners Source: Qatar Stock Exchange (QSE) Source: Qatar Stock Exchange (QSE) Most Active Shares by Value (QR Million) Most Active Shares by Volume (Million) Source: Qatar Stock Exchange (QSE) Source: Qatar Stock Exchange (QSE) Investor Trading Percentage to Total Value Traded Net Traded Value by Nationality (QR Million) Source: Qatar Stock Exchange (QSE) Source: Qatar Stock Exchange (QSE) 14.7% 13.3% 12.8% 11.0% 9.7% 0.0% 5.0% 10.0% 15.0% Qatar Oman Investment Co. Qatar Cinema & Film Distribution Co. Qatari German Co. for Medical Dev. Al Khaleej Takaful Insurance Co. Salam International Inv. Ltd. -7.1% -6.7% -6.1% -3.8% -2.6% -9.0% -6.0% -3.0% 0.0% Zad Holding Company Aamal Company MazayaQatarReal Estate Dev. IslamicHolding Group Medicare Group 230.8 98.4 88.8 81.8 57.4 0.0 80.0 160.0 240.0 QNB Group Qatar Aluminium Manufacturing Company Industries Qatar Qatar First Bank Vodafone Qatar 15.8 8.7 8.5 7.2 4.4 0.0 6.0 12.0 18.0 Qatar First Bank Investment Holding Group Qatar Aluminium Manufacturing Company Vodafone Qatar Aamal Company 0% 20% 40% 60% 80% 100% Buy Sell 43.38% 49.58% 14.52% 16.90% 15.30% 15.18% 26.80% 18.34% Qatari Individuals Qatari Institutions Non-Qatari Individuals Non-Qatari Institutions 753 548 865 436 (112) 112 (200) - 200 400 600 800 1,000 Qatari Non-Qatari Net Investment Total Sold Total Bought
- 6. Page 6 of 8 TECHNICAL ANALYSIS OF THE QSE INDEX Source: Bloomberg The Index closed at 10,348.19 for the week, gaining 0.88% from last week. Our thesis remains intact as the Index gets closer to our expected resistance level. We remind our readers that the rising-wedge price formation would become an issue if it is breached downwards. DEFINITIONS OF KEY TERMS USED IN TECHNICAL ANALYSIS RSI (Relative Strength Index) indicator – RSI is a momentum oscillator that measures the speed and change of price movements. The RSI oscillates between 0 to 100. The index is deemed to be overbought once the RSI approaches the 70 level, indicating that a correction is likely. On the other hand, if the RSI approaches 30, it is an indication that the index may be getting oversold and therefore likely to bounce back. MACD (Moving Average Convergence Divergence) indicator – The indicator consists of the MACD line and a signal line. The divergence or the convergence of the MACD line with the signal line indicates the strength in the momentum during the uptrend or downtrend, as the case may be. When the MACD crosses the signal line from below and trades above it, it gives a positive indication. The reverse is the situation for a bearish trend. Candlestick chart – A candlestick chart is a price chart that displays the high, low, open, and close for a security. The ‘body’ of the chart is portion between the open and close price, while the high and low intraday movements form the ‘shadow’. The candlestick may represent any time frame. We use a one-day candlestick chart (every candlestick represents one trading day) in our analysis. Doji candlestick pattern – A Doji candlestick is formed when a security's open and close are practically equal. The pattern indicates indecisiveness, and based on preceding price actions and future confirmation, may indicate a bullish or bearish trend reversal. ShootingStar/Inverted Hammer candlestick patterns – These candlestick patterns have a small real body (open price and close price are near to each other), and a long upper shadow (large intraday movement on the upside). The Shooting Star is a bearish reversal pattern that forms after a rally. The Inverted Hammer looks exactly like a Shooting Star, but forms after a downtrend. Inverted Hammers represent a potential bullish trend reversal.
- 7. Page 7 of 8 Source: Bloomberg Company Name Price April 18 % Change WTD % Change YTD Market Cap. QR Million TTM P/E P/B Div. Yield Qatar National Bank 183.00 1.67 (6.15) 169,027 12.9 2.6 3.3 Qatar Islamic Bank 168.50 2.71 10.86 39,815 15.3 2.7 3.0 Commercial Bank of Qatar 47.49 3.28 20.56 19,220 13.3 1.2 3.2 Doha Bank 21.30 (0.47) (4.05) 6,604 10.8 0.8 4.7 Al Ahli Bank 29.20 (2.31) 14.71 6,757 10.1 1.2 3.1 Qatar International Islamic Bank 70.11 (1.39) 6.03 10,612 12.8 1.8 5.7 Masraf Al Rayan 36.48 0.30 (12.48) 27,360 12.8 2.2 5.5 Al Khaliji Bank 11.80 (1.67) 2.25 4,248 7.7 0.8 6.4 Qatar First Bank 5.29 8.62 29.66 1,058 N/A 1.1 N/A National Leasing 8.55 2.03 (2.73) 423 56.4 0.6 5.8 Dlala Holding 10.99 4.97 9.90 312 N/A 1.5 N/A Qatar & Oman Investment 6.64 14.68 24.34 209 45.5 0.7 4.5 Islamic Holding Group 22.88 (3.83) 4.71 130 949.9 0.9 N/A Banking and Financial Services 285,776 Zad Holding 139.10 (7.08) 33.75 2,002 15.8 2.1 4.2 Qatar German Co. for Medical Devices 6.53 12.78 15.37 75 N/A 1.8 N/A Salam International Investment 5.30 9.73 22.40 606 N/A 0.5 N/A Medicare Group 63.00 (2.58) (0.16) 1,773 21.0 1.7 2.9 Qatar Cinema & Film Distribution 20.40 13.33 7.26 128 15.1 0.9 7.4 Qatar Fuel 201.00 0.00 21.09 19,985 17.2 2.5 4.0 Qatar Meat and Livestock 60.80 (0.93) (13.14) 1,094 10.1 3.0 7.4 Mannai Corp. 47.86 5.86 (12.90) 2,183 5.4 0.8 4.3 Al Meera Consumer Goods 146.50 0.00 (1.01) 2,930 16.1 2.1 5.8 Consumer Goods and Services 30,776 Qatar Industrial Manufacturing 39.90 3.10 (6.56) 1,896 9.5 1.2 6.3 Qatar National Cement 71.10 (2.13) 19.50 4,647 14.3 1.6 7.0 Industries Qatar 125.00 0.14 (6.44) 75,625 15.0 2.1 4.8 Qatari Investors Group 24.80 (0.96) (10.82) 3,083 14.9 1.1 3.0 Qatar Electricity and Water 169.00 (1.17) (8.65) 18,590 12.8 1.9 4.6 Aamal 9.47 (6.70) 7.13 5,966 13.5 0.7 6.3 Gulf International Services 15.27 0.13 (10.18) 2,838 N/A 0.8 N/A Mesaieed Petrochemical Holding 21.12 1.78 40.52 26,533 19.1 1.8 3.8 Invesment Holding Group 5.77 8.26 18.00 479 8.3 0.6 4.3 Qatar Aluminum Manufacturing 11.85 6.47 (11.24) 6,612 N/A N/A N/A Industrials 146,270 Qatar Insurance 38.62 0.05 7.58 12,316 22.0 1.6 3.9 Doha Insurance 11.70 (0.85) (10.62) 585 9.7 0.5 6.7 Qatar General Insurance & Reinsurance 41.01 (2.36) (8.62) 3,589 14.7 0.6 2.4 Al Khaleej Takaful Insurance 16.61 11.03 93.36 424 20.8 0.8 3.0 Qatar Islamic Insurance 56.78 1.39 5.72 852 13.5 2.4 6.2 Insurance 17,766 United Development 14.86 1.16 0.75 5,262 10.5 0.5 6.7 Barw a Real Estate 35.21 0.03 (11.78) 13,701 7.2 0.7 7.1 Ezdan Real Estate 10.98 (0.36) (15.41) 29,124 48.0 0.9 N/A Mazaya Qatar Real Estate Development 8.33 (6.09) 6.79 964 58.3 0.6 6.0 Real Estate 49,052 Ooredoo 65.00 (0.61) (13.33) 20,821 13.3 0.9 3.8 Vodafone Qatar 8.00 2.17 2.43 6,763 57.7 1.5 3.1 Telecoms 27,584 Qatar Navigation (Milaha) 66.90 0.42 1.35 7,662 14.7 0.5 4.5 Gulf Warehousing 45.79 (0.43) 19.03 2,683 11.3 1.5 4.1 Qatar Gas Transport (Nakilat) 21.23 0.81 18.57 11,779 13.2 1.7 4.7 Transportation 22,124 Qatar Exchange 579,346
- 8. Disclaimer and Copyright Notice: This publication has been prepared by QNB Financial Services Co. W.L.L. (“QNB FS”) a wholly-owned subsidiary of Qatar National Bank (Q.P.S.C.). QNB FS is regulated by the Qatar Financial Markets Authority and the Qatar Exchange. Qatar National Bank (Q.P.S.C.) is regulated by the Qatar Central Bank. This publication expresses the views and opinions of QNB FS at a given time only. It is not an offer, promotion or recommendation to buy or sell securities or other investments, nor is it intended to constitute legal, tax, accounting, or financial advice. QNB FS accepts no liability whatsoever for any direct or indirect losses arising from use of this report. Any investment decision should depend on the individual circumstances of the investor and be based on specifically engaged investment advice. We therefore strongly advise potential investors to seek independent professional advice before making any investment decision. Although the information in this report has been obtained from sources that QNB FS believes to be reliable, we have not independently verified such information and it may not be accurate or complete. QNB FS does not make any representations or warranties as to the accuracy and completeness of the information it may contain, and declines any liability in that respect. For reports dealing with Technical Analysis, expressed opinions and/or recommendations may be different or contrary to the opinions/recommendations of QNB FS Fundamental Research as a result of depending solely on the historical technical data (price and volume). QNB FS reserves the right to amend the views and opinions expressed in this publication at any time. It may also express viewpoints or make investment decisions that differ significantly from, or even contradict, the views and opinions included in this report. This report may not be reproduced in whole or in part without permission from QNB FS COPYRIGHT: No part of this document may be reproduced without the explicit written permission of QNB FS. Page 8 of 8 Contacts Saugata Sarkar, CFA, CAIA Shahan Keushgerian Zaid al-Nafoosi , CMT, CFTe Head of Research Senior Research Analyst Senior Research Analyst Tel: (+974) 4476 6534 Tel: (+974) 4476 6509 Tel: (+974) 4476 6535 saugata.sarkar@qnbfs.com.qa shahan.keushgerian@qnbfs.com.qa zaid.alnafoosi@qnbfs.com.qa Mehmet Aksoy, PhD QNB Financial Services Co. W.L.L. Senior Research Analyst Contact Center: (+974) 4476 6666 Tel: (+974) 4476 6589 PO Box 24025 mehmet.aksoy@qnbfs.com.qa Doha, Qatar