QNBFS Daily Market Report August 9, 2018
•
0 gefällt mir•39 views

The QSE Index declined 0.1% to close at 9,961.6.

Empfohlen
Empfohlen
Weitere ähnliche Inhalte
Mehr von QNB Group
Mehr von QNB Group (20)
Kürzlich hochgeladen
Kürzlich hochgeladen (20)
QNBFS Daily Market Report August 9, 2018
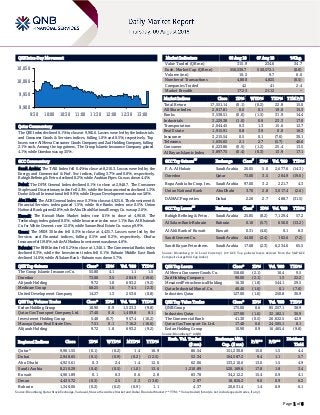
- 1. Page 1 of 6 QSE Intra-Day Movement Qatar Commentary The QSE Index declined 0.1% to close at 9,961.6. Losses were led by the Industrials and Consumer Goods & Services indices, falling 1.0% and 0.5%, respectively. Top losers were Al Meera Consumer Goods Company and Zad Holding Company, falling 2.1% each. Among the top gainers, The Group Islamic Insurance Company gained 4.1%, while Ooredoo was up 3.5%. GCC Commentary Saudi Arabia: The TASI Index fell 0.4% to close at 8,210.3. Losses were led by the Energy and Commercial & Prof. Svc indices, falling 3.7% and 0.8%, respectively. Rabigh Refining & Petro. declined 8.2%, while Arabian Pipes Co. was down 4.4%. Dubai: The DFM General Index declined 0.1% to close at 2,948.7. The Consumer Staples and Discretionary index fell 2.3%, while the Insurance index declined 1.3%. Drake & Scull International fell 9.9%, while Deyaar Development was down 5.8%. Abu Dhabi: The ADX General Index rose 0.3% to close at 4,925.6. The Investment & Financial Services index gained 1.5%, while the Banks index rose 0.5%. Union National Bank gained 2.8%, while Abu Dhabi National Energy Co. was up 2.6%. Kuwait: The Kuwait Main Market Index rose 0.1% to close at 4,961.9. The Technology index gained 8.0%, while Insurance index rose 1.1%. Ras Al Khaimah Co. for White Cement. rose 12.0%, while Sanam Real Estate Co. was up 9.9%. Oman: The MSM 30 Index fell 0.3% to close at 4,435.7. Losses were led by the Services and Financial indices, falling 0.5% and 0.2%, respectively. Dhofar Insurance fell 19.8%, while Al Madina Investment was down 4.6%. Bahrain: The BHB Index fell 0.2% to close at 1,346.1. The Commercial Banks index declined 0.3%, while the Investment index fell 0.1%. Bahrain Middle East Bank declined 14.0%, while Al Salam Bank - Bahrain was down 5.7%. QSE Top Gainers Close* 1D% Vol. ‘000 YTD% The Group Islamic Insurance Co. 55.80 4.1 1.1 1.5 Ooredoo 73.00 3.5 204.9 (19.6) Alijarah Holding 9.72 1.8 693.2 (9.2) Medicare Group 68.25 1.6 74.1 (2.3) United Development Company 14.27 1.3 253.6 (0.8) QSE Top Volume Trades Close* 1D% Vol. ‘000 YTD% Ezdan Holding Group 10.90 0.9 1,523.3 (9.8) Qatar Gas Transport Company Ltd. 17.40 0.6 1,409.8 8.1 Investment Holding Group 5.48 (0.7) 957.4 (10.2) Mazaya Qatar Real Estate Dev. 7.51 0.1 716.2 (16.6) Alijarah Holding 9.72 1.8 693.2 (9.2) Market Indicators 08 Aug 18 07 Aug 18 %Chg. Value Traded (QR mn) 315.9 234.6 34.7 Exch. Market Cap. (QR mn) 550,530.7 550,572.1 (0.0) Volume (mn) 10.2 9.7 6.0 Number of Transactions 4,800 4,825 (0.5) Companies Traded 42 41 2.4 Market Breadth 17:23 21:12 – Market Indices Close 1D% WTD% YTD% TTM P/E Total Return 17,551.14 (0.1) (0.2) 22.8 15.0 All Share Index 2,917.81 0.0 0.1 19.0 15.3 Banks 3,538.51 (0.0) (1.5) 31.9 14.4 Industrials 3,229.38 (1.0) 0.9 23.3 17.0 Transportation 2,044.45 0.3 1.3 15.6 12.7 Real Estate 1,915.91 0.8 3.9 0.0 16.3 Insurance 3,215.54 0.5 0.1 (7.6) 30.1 Telecoms 1,035.65 2.1 2.7 (5.7) 40.6 Consumer 6,223.86 (0.5) (1.2) 25.4 13.5 Al Rayan Islamic Index 3,897.75 (0.4) (0.3) 13.9 17.1 GCC Top Gainers ## Exchange Close # 1D% Vol. ‘000 YTD% F. A. Al Hokair Saudi Arabia 26.05 5.0 2,677.6 (14.3) Ooredoo Qatar 73.00 3.5 204.9 (19.6) Bupa Arabia for Coop. Ins. Saudi Arabia 97.00 3.2 221.7 4.3 Union National Bank Abu Dhabi 3.70 2.8 3,017.4 (2.6) DAMAC Properties Dubai 2.26 2.7 488.7 (31.5) GCC Top Losers ## Exchange Close # 1D% Vol. ‘000 YTD% Rabigh Refining & Petro. Saudi Arabia 25.85 (8.2) 7,129.4 57.2 Al Salam Bank-Bahrain Bahrain 0.10 (5.7) 650.0 (13.2) Al Ahli Bank of Kuwait Kuwait 0.31 (4.6) 0.1 8.3 Saudi Cement Co. Saudi Arabia 44.00 (2.4) 102.6 (7.2) Saudi Kayan Petrochem. Saudi Arabia 17.68 (2.3) 6,234.6 65.5 Source: Bloomberg (# in Local Currency) (## GCC Top gainers/losers derived from the S&P GCC Composite Large Mid Cap Index) QSE Top Losers Close* 1D% Vol. ‘000 YTD% Al Meera Consumer Goods Co. 158.60 (2.1) 16.4 9.5 Zad Holding Company 90.00 (2.1) 1.3 22.2 Mesaieed Petrochemical Holding 16.30 (1.8) 544.1 29.5 Qatar Industrial Manuf. Co. 40.40 (1.6) 0.1 (7.6) Industries Qatar 127.00 (1.6) 250.8 30.9 QSE Top Value Trades Close* 1D% Val. ‘000 YTD% QNB Group 175.00 0.6 85,557.1 38.9 Industries Qatar 127.00 (1.6) 32,182.1 30.9 The Commercial Bank 41.30 (0.5) 26,632.5 42.9 Qatar Gas Transport Co. Ltd. 17.40 0.6 24,505.1 8.1 Ezdan Holding Group 10.90 0.9 16,465.4 (9.8) Source: Bloomberg (* in QR) Regional Indices Close 1D% WTD% MTD% YTD% Exch. Val. Traded ($ mn) Exchange Mkt. Cap. ($ mn) P/E** P/B** Dividend Yield Qatar* 9,961.55 (0.1) (0.2) 1.4 16.9 86.54 151,230.8 15.0 1.5 4.4 Dubai 2,948.65 (0.1) (0.9) (0.2) (12.5) 52.34 104,587.2 9.4 1.1 5.7 Abu Dhabi 4,925.61 0.3 2.4 1.4 12.0 62.06 133,210.6 13.0 1.5 4.9 Saudi Arabia 8,210.29 (0.4) (0.5) (1.0) 13.6 1,210.89 520,169.6 17.8 1.8 3.4 Kuwait 4,961.89 0.1 0.3 0.6 2.8 83.78 34,212.2 15.4 0.9 4.1 Oman 4,435.72 (0.3) 2.5 2.3 (13.0) 2.97 18,826.2 9.0 0.9 6.2 Bahrain 1,346.06 (0.2) (0.2) (0.9) 1.1 4.37 20,631.4 1.4 0.9 6.1 Source: Bloomberg, Qatar Stock Exchange, Tadawul, Muscat Securities Market and Dubai Financial Market (** TTM; * Value traded ($ mn) do not include special trades, if any) 9,900 9,950 10,000 10,050 9:30 10:00 10:30 11:00 11:30 12:00 12:30 13:00
- 2. Page 2 of 6 Qatar Market Commentary The QSE Index declined 0.1% to close at 9,961.6. The Industrials and Consumer Goods & Services indices led the losses. The index fell on the back of selling pressure from Qatari and GCC shareholders despite buying support from non-Qatari shareholders. Al Meera Consumer Goods Company and Zad Holding Company were the top losers, falling 2.1% each. Among the top gainers, The Group Islamic Insurance Company gained 4.1%, while Ooredoo was up 3.5%. Volume of shares traded on Wednesday rose by 6.0% to 10.2mn from 9.7mn on Tuesday. Further, as compared to the 30-day moving average of 7.3mn, volume for the day was 39.7% higher. Ezdan Holding Group and Qatar Gas Transport Company Limited were the most active stocks, contributing 14.9% and 13.8% to the total volume, respectively. Source: Qatar Stock Exchange (* as a % of traded value) Earnings Releases, Global Economic Data and Earnings Calendar Earnings Releases Company Market Currency Revenue (mn) 2Q2018 % Change YoY Operating Profit (mn) 2Q2018 % Change YoY Net Profit (mn) 2Q2018 % Change YoY Tabuk Cement Co. Saudi Arabia SR – – -28.3 N/A -36.1 N/A Ash-Sharqiyah Development Co. Saudi Arabia SR – – -1.8 N/A -1.7 N/A Kingdom Holding Co. Saudi Arabia SR – – 619.8 67.7% 242.7 12.2% Allianz Saudi Fransi Cooperative Insurance Co. Saudi Arabia SR 224.8 -1.0% – – 1.7 22.8% Saudi Marketing Co. Saudi Arabia SR – – -7.0 N/A -11.9 N/A Gulf Union Cooperative Insurance Co. Saudi Arabia SR 50.2 -36.5% – – 0.4 -45.1% Middle East Healthcare Co. Saudi Arabia SR – – 31.7 -46.3% 34.3 -44.7% Red Sea International Co. Saudi Arabia SR – – -3.4 N/A -9.8 N/A Al Alamiya for Cooperative Insurance Co. Saudi Arabia SR 56.3 17.1% – – 1.8 64.3% Jarir Marketing Co. Saudi Arabia SR – – 156.4 17.4% 162.6 10.0% Arabian Pipes Co. Saudi Arabia SR – – -0.3 N/A -8.0 N/A Bahrain Duty Free Complex Bahrain BHD 8.8 15.9% 1.5 12.4% 1.9 33.1% Source: Company data, DFM, ADX, MSM, TASI, BHB. Global Economic Data Date Market Source Indicator Period Actual Consensus Previous 08/08 US Mortgage Bankers Association MBA Mortgage Applications 3-August -3.0% – -2.6% 08/08 China National Bureau of Statistics Trade Balance July $28.05bn $38.92bn $41.46bn 08/08 China National Bureau of Statistics Exports YoY July 12.2% 10.0% 11.2% 08/08 China National Bureau of Statistics Imports YoY July 27.3% 16.5% 14.1% Source: Bloomberg (s.a. = seasonally adjusted; n.s.a. = non-seasonally adjusted; w.d.a. = working day adjusted) Earnings Calendar Tickers Company Name Date of reporting 2Q2018 results No. of days remaining Status MRDS Mazaya Qatar Real Estate Development 13-Aug-18 4 Due ZHCD Zad Holding Company 14-Aug-18 5 Due Source: QSE Overall Activity Buy %* Sell %* Net (QR) Qatari Individuals 21.12% 24.83% (11,710,534.13) Qatari Institutions 20.73% 31.36% (33,557,000.83) Qatari 41.85% 56.19% (45,267,534.96) GCC Individuals 0.84% 1.48% (2,011,063.89) GCC Institutions 2.19% 5.65% (10,924,731.86) GCC 3.03% 7.13% (12,935,795.75) Non-Qatari Individuals 8.24% 8.71% (1,491,512.16) Non-Qatari Institutions 46.87% 27.98% 59,694,842.87 Non-Qatari 55.11% 36.69% 58,203,330.71
- 3. Page 3 of 6 News Qatar IQCD reports in-line 2Q2018 with 82.1% YoY increase but 2.1% QoQ decline in net profit – Industries Qatar’s (IQCD) net profit rose 82.1% YoY (but declined 2.1% QoQ) to QR1,241.71mn in 2Q2018, in line with our estimate of QR1,204.48mn (variation of +3.1%). The company’s consolidated revenue, which represents the steel segment, came in at QR1,645.37mn in 2Q2018, which represents an increase of 79.4% YoY (+19.4% QoQ). Steel was again stronger-than-expected with revenue beating our estimate of QR1,308.94mn by 25.7%. EPS increased to QR4.15 in 1H2018 from QR2.66 in 1H2017. According to the company, 1H results are well ahead of the group budget expectations for 2018. Further, improved product prices, stable sales volumes, efficiently managed operating assets base, and continued focus on cost improvements were the driving forces behind its performance. In 1H2018, steel revenue jumped significantly by 49.3% to QR3.02bn, following a combination of moderate improvement in sales volumes and selling prices. On the other hand, on a like-for-like basis, management reporting revenue, assuming proportionate consolidation, was QR8.1bn, up 24% over 1H2017 due to the combined effect of improved prices and volumes versus the previous year. The group’s sales volumes improved moderately on last year, despite a number of planned and unplanned shutdowns in some facilities. Polyethylene sales improved through higher production, as the segment was on an extended unplanned shutdown during 1H2017, specifically during 1Q2017. Recovery in global demand has aided the group’s fertilizer segment, while the sales of steel products have improved due to the change of geographical mix. Product prices across most segments moderately increased versus the comparable period of 2017. Polyethylene prices have started to stabilize, while fuel additive prices have improved notably compared to last year. Increase in raw materials costs and resurgence of demand in some geographies were the key factors those contributed to the increase in the steel prices, IQCD stated. The group’s financial position remains solid, as cash across the group stands at QR10.2bn after paying 2017’s dividend of QR3.0bn, with periodic debt payments amounting to QR0.3bn. Total debt across the group now stands at QR0.2bn, down from QR0.5bn as of December 31, 2017. In July, rating agency Moody’s Investors Service affirmed its ‘A1’ rating for IQCD and changed the outlook to ‘Stable’ from ‘Negative’. We are of the view that these are a strong set of results and bottom- line performance would have been even stronger if the company did not report a loss of QR77.13mn from its steel associates (vs. a QR43.56mn profit in 2Q2017 and a QR21.0mn profit in 1Q2018) along with a substantial increase in selling costs. We expect to revise our 2018 net income estimate upward given strong 1H2018 results. (QNBFS Research, Company releases, Gulf-Times.com) QGMD reports net loss of QR2.17mn in 2Q2018 – Qatari German Company for Medical Devices (QGMD) reported net loss of QR2.17mn in 2Q2018 as compared to net loss of QR2.11mn in 2Q2017 and QR2.23mn in 1Q2018. The company’s revenue came in at QR2.59mn in 2Q2018, which represents an increase of 0.5% YoY (+31.5% QoQ). Loss per share amounted to QR0.38 in 1H2018 as compared to QR0.37 in 1H2017. In 1H2018, QGMD reported net loss of QR4.40mn as compared to net loss of QR4.32mn for the comparable period of the previous year. (QSE) PwC report: Qatar’s sovereign bond of $12bn largest in 2Q2018 – Qatar has issued the highest value of sovereign bond at $12.0bn in 2Q2018, according to a report by PwC Middle East (PwC). The report stated Qatar issued a bond, which consisted of three tranches: a $3.0bn 5-year tranche, a $3.0bn 10-year tranche, and a $6.0bn 30-year tranche. In addition, the government of Saudi Arabia issued a triple-tranche bond total valued at $10.9bn. Led by Qatar and Saudi Arabia, the GCC sovereign bond market witnessed proceeds of $22.9bn in 2Q2018 from its two largest sovereign bond issuers, PwC stated. The $12.0bn sovereign bond issued by Qatar represents the largest placement by an emerging market sovereign so far this year. On the corporate front, debt activity has been relatively slow. However, with the recent recovery in oil prices and improvement in government fiscal deficits, sovereign debt issuances are expected to taper in the latter half of 2018, according to PwC. (Gulf-Times.com) PetroChina, Qatar in advanced talks on LNG supply deals – PetroChina Company Limited (PetroChina) is in advanced discussions with Qatar to purchase liquefied natural gas (LNG) under short and long-term agreements, according to sources. China needs to secure LNG to supply its push to replace coal with cleaner burning natural gas to reduce air pollution. After China started the program last year, China has overtaken South Korea as the world’s second-biggest buyer of LNG. Tying up with Qatar, the world’s biggest LNG producer makes sense as the Middle Eastern country seeks buyers for a planned output expansion. (Zawya) ASEAN to strengthen business ties with Qatar – Embassies of ASEAN member countries in Qatar look forward to further strengthening the partnership and increasing bilateral investments with Qatar, according to Malaysian Ambassador to Qatar HE Dato’ Ahmad Fadil Bin Shamsuddin. Fadil said, “The ASEAN Embassies accredited in Doha namely Brunei, Indonesia, Malaysia, Philippines, Singapore, Thailand and Vietnam look forward to increasing bilateral investments of Southeast Asia and Qatar.” The envoy said the distance that separates ASEAN and GCC has been narrowed down by developments of investment opportunities through high level visits between the two regions. In particular, he highlighted the importance of recent and future visits by Amir HH Sheikh Tamim Bin Hamad Al Thani to Southeast Asia in bolstering partnership between Qatar and ASEAN. (Peninsula Qatar) International US mortgage activity falls to two-and-a-half year low – US mortgage application activity decreased to its lowest in 2-1/2 years last week, as loan requests to refinance an existing home fell to their weakest level since December 2000, according to the Mortgage Bankers Association (MBA). The US based group’s seasonally adjusted index on weekly home loan requests fell 3% to 342.5 in the week ended August 3. This was the lowest reading since 328.6 in the week of January 1, 2016. (Reuters) US cuts 2018 crude oil production growth forecast – US crude oil production in 2018 was expected to grow at a slower rate than
- 4. Page 4 of 6 previously forecast amid lower crude prices according to a monthly US government report. US crude production has climbed dramatically, fuelled largely by increased output from shale formations, but may now rise more slowly as prices drop. Output is expected to rise 1.31mn barrels per day (bpd) to 10.68mn bpd in 2018, lower than last month’s forecast of growth of 1.44mn bpd to 10.79mn, according to the US Energy Information Administration. (Qatar Tribune) Japan’s machinery orders tumble, stoke doubts on capex – Japan’s core machinery orders tumbled in June at the fastest pace in six months, with firms expecting another modest drop in the third quarter in a sign capital expenditure may slow, especially as international trade worries cloud the horizon. The 8.8% fall in core machinery orders, a highly volatile data series regarded as a leading indicator of capital spending, was more than the median estimate for 1.3% decline in a Reuters poll and marked the biggest drop since December 2017. Manufacturers surveyed by the Cabinet Office have forecast that core orders will edge down 0.3% in July-September after 2.2% increase in April-June. (Reuters) China’s July factory inflation slows but consumer prices accelerate – China’s factory price inflation cooled in July, but not as much as expected, amid a wider slowdown in economic growth as China remains locked in a heated trade dispute with the US. However, consumer inflation picked up from the previous month, largely due to rise in non-food prices, official data showed. The July inflation data is the first official reading on the impact on prices from China’s retaliatory tariffs on $34bn of US goods that went into effect on July 6 and apply to a range of products from soybeans, to mixed nuts and whiskey. While policymakers are watching price pressures, the central bank is likely to give priority to policies that help shore up the slowing economy. The producer price index (PPI), a gauge of factory gate inflation, rose 4.6% in July from a year earlier, compared with acceleration to 4.7% in June, according to the National Bureau of Statistics. (Reuters) China to slap additional tariffs on $16bn of US goods – China is slapping additional tariffs of 25% on $16bn worth of US imports from fuel and steel products to autos and medical equipment, the Chinese commerce ministry stated, as the world’s largest economies escalated their trade dispute. The tariffs will be activated on August 23, the ministry stated, the same day that the US plans to begin collecting 25% extra in tariffs on $16bn of Chinese goods. The US published its final list of goods subject to the new tariffs. China’s final list announced differs from an earlier draft it published in June, which included crude oil. The number of categories of goods subject to tariffs rose to 333 from 114 in the June draft, although the total value is unchanged. (Peninsula Qatar) Turkey to continue buying natural gas from Iran despite US sanctions – Turkey will continue to buy natural gas from Iran in line with its long-term supply contract, Turkey’s Energy Minister said, a day after US President, Donald Trump threatened that anyone trading with Iran will not do business with America. NATO member Turkey is dependent on imports for almost all of its energy needs and Iran is a key supplier of Ankara’s natural gas and oil purchases. While the Turkish refiner Tupras has already cut back on oil shipments from Tehran, a complete halt of energy imports would be near impossible. (Reuters) Regional Saudi Arabia’s budget deficit stood at SR41,690mn in 1H2018 – Saudi Arabia’s budget deficit was SR41,690mn in 1H2018 as compared to SR72,728mn in 1H2017, according to Saudi Arabia’s Ministry of Finance. Revenues came in at SR439,851mn as compared to 307,982mn in 1H2017. Expenditures were recorded at SR481,542mn as compared to 380,710mn in 1H2017. (Bloomberg) Saudi Arabia likely to miss its unemployment target – The Saudi Arabian government’s National Transformation Program, a set of development objectives for 2020, is aiming to cut the unemployment rate to 9%, a reduction that would require the creation of at least 700,000 jobs in the next two years, according to Bloomberg Economics. That’s unlikely to be achieved and the government now thinks it’s a tall order as in the 2018 budget statement it projected that joblessness would fall to 10.6% by 2020. Even that forecast is optimistic too, as it requires the creation of around 600,000 jobs, a goal unlikely to be met given the current economic conditions. (Gulf- Times.com) Saudi Aramco to buy Lanxess’ stake for $1.6bn – Saudi Aramco is buying the 50% it doesn’t own in a synthetic-rubber joint venture with Lanxess for $1.6bn, as Saudi Aramco deepens its push into chemicals. The sale of the holding in the Arlanxeo venture is subject to approval from antitrust regulators, with the deal expected to close by the end of the year. The company will use the proceeds to reduce debt. (Bloomberg) Atraba Integrated Holding plans $1bn medical city in Egypt – Saudi Arabia’s Atraba Integrated Holding announced its plan to build an integrated medical city project over a sprawling 500,000 square kilometer area in Egypt at an initial investment of $1bn, according to a report. The project financing and fund company is looking to partner with local players on the project. Chairperson of Atraba Integrated Holding, Fawaz Mohammed Bashraheel said that the project will be set up with the help of a consortium comprising some Egyptian investors. (GulfBase.com) Peru’s exports to the UAE hit $600mn in 2017 – Exports from Peru to the UAE increased from $6mn in 2011 to $600mn in 2017, due to increasing demand from consumers and the ongoing work of the Dubai-based Trade, Tourism and Investment Office of Peru (TTIOP). Since 2016, major UAE businesses such as DP World and Abu Dhabi Investment Authority have made multi-million-Dollar investments in the country’s shipping, logistics and energy sectors due to increase in trade and improving bilateral relations. (GulfBase.com) Oman’s real estate deals hit OMR1.5bn in 1H2018 – Oman’s real estate sector witnessed solid growth in 1H2018, netting OMR1.5bn from a total of 208,966 transactions during 1H2018, according to a report. Out of this figure, a record OMR79mn worth of deals were made in just five days, from July 15 to July 19. The highest number of sales transactions took place in capital Muscat, followed by the governorate of North Al Batinah. At the governorate level, a total of 208,966 real estate transactions were recorded in 1H2018, of which, 39,687
- 5. Page 5 of 6 transactions were registered in capital Muscat followed by 11,169 in Dhofar. (GulfBase.com) CBO issues treasury bills worth OMR42mn – The Central Bank of Oman (CBO) raised OMR42mn by way of allotting treasury bills. The treasury bills are for a maturity period of 28 days, from July 8, 2018 until September 5, 2018. The average accepted price reached 99.843 for every OMR100, and the minimum accepted price arrived at 99.840 per OMR100. Whereas the average discount rate and the average yield reached 2.04692% and 2.05014%, respectively. The interest rate on the Repo operations with CBO is 2.583%, while the discount rate on Treasury Bills Discounting Facility with CBO is 3.333%, for the same period. (GulfBase.com) Salalah Port braces for impact from trade war – Salalah Port warned that an impending trade war between the US and major economic powers, combined with US’ decision to reinstate sanctions against Iran, will negatively impact its operations, both on the Container and General Cargo sides of its business. Salalah Port Services Company’s Chairman, Ahmed Bin Nasser Al Mehrzi said, “The escalating trade war between the US and its closest traditional trading partners coupled with its current international policy decisions in US will impact global GDP growth and thus seaborne trade globally.” (GulfBase.com) Omantel signs MoU with Blockchain Solutions & Services – Oman Telecommunications Company (Omantel) signed a Memorandum of Understanding (MoU) with Blockchain Solutions & Services (BSS) for mutual cooperation between the two companies which include availing the smart solutions offered by BSS in logistics and commercial operations. The MoU comes as part of Omantel’s ongoing efforts in offering smart solutions for digital transformation and laying the groundwork for smart cities’ ICT (Information and Communications Technology) services. (GulfBase.com) SALAM’s net profit narrows to BHD4.1mn in 2Q2018 – Al Salam Bank-Bahrain (SALAM) recorded net profit of BHD4.1mn in 2Q2018 as compared to BHD4.6mn in 2Q2017. Income from financing assets came in at BHD11.1mn as compared to BHD10.8mn in 2Q2017. Total operating income came in at BHD14.2mn as compared to BHD15.1mn in 2Q2017. Total assets stood at BHD1,615.10mn at the end of June 30, 2018 as compared to BHD1,589.23mn at the end of December 31, 2017. Financing assets stood at BHD769.62mn, while placements from customers stood at BHD622.91mn at the end of June 30, 2018. EPS came in flat YoY at BHD0.002 in 2Q2018. (Bahrain Bourse) Investcorp explores investment opportunities in China, India and Saudi Arabia – Investcorp is exploring investment opportunities in China, India and Saudi Arabia, its co-CEO, Rishi Kapoor said. The firm also expects to reach a level of $50bn assets under management within next five to seven years. (Reuters)
- 6. Contacts Saugata Sarkar, CFA, CAIA Shahan Keushgerian Zaid al-Nafoosi, CMT, CFTe Head of Research Senior Research Analyst Senior Research Analyst Tel: (+974) 4476 6534 Tel: (+974) 4476 6509 Tel: (+974) 4476 6535 saugata.sarkar@qnbfs.com.qa shahan.keushgerian@qnbfs.com.qa zaid.alnafoosi@qnbfs.com.qa QNB Financial Services Co. W.L.L. Contact Center: (+974) 4476 6666 PO Box 24025 Doha, Qatar Disclaimer and Copyright Notice: This publication has been prepared by QNB Financial Services Co. W.L.L. (“QNBFS”) a wholly-owned subsidiary of Qatar National Bank (Q.P.S.C.). QNBFS is regulated by the Qatar Financial Markets Authority and the Qatar Exchange. Qatar National Bank (Q.P.S.C.) is regulated by the Qatar Central Bank. This publication expresses the views and opinions of QNBFS at a given time only. It is not an offer, promotion or recommendation to buy or sell securities or other investments, nor is it intended to constitute legal, tax, accounting, or financial advice. QNBFS accepts no liability whatsoever for any direct or indirect losses arising from use of this report. Any investment decision should depend on the individual circumstances of the investor and be based on specifically engaged investment advice. We therefore strongly advise potential investors to seek independent professional advice before making any investment decision. Although the information in this report has been obtained from sources that QNBFS believes to be reliable, we have not independently verified such information and it may not be accurate or complete. QNBFS does not make any representations or warranties as to the accuracy and completeness of the information it may contain, and declines any liability in that respect. For reports dealing with Technical Analysis, expressed opinions and/or recommendations may be different or contrary to the opinions/recommendations of QNBFS Fundamental Research as a result of depending solely on the historical technical data (price and volume). QNBFS reserves the right to amend the views and opinions expressed in this publication at any time. It may also express viewpoints or make investment decisions that differ significantly from, or even contradict, the views and opinions included in this report. This report may not be reproduced in whole or in part without permission from QNBFS. COPYRIGHT: No part of this document may be reproduced without the explicit written permission of QNBFS. Page 6 of 6 Rebased Performance Daily Index Performance Source: Bloomberg Source: Bloomberg Source: Bloomberg Source: Bloomberg (*$ adjusted returns) 50.0 75.0 100.0 125.0 Jul-14 Jul-15 Jul-16 Jul-17 Jul-18 QSE Index S&P Pan Arab S&P GCC (0.4%) (0.1%) 0.1% (0.2%) (0.3%) 0.3% (0.1%) (0.6%) (0.3%) 0.0% 0.3% 0.6% SaudiArabia Qatar Kuwait Bahrain Oman AbuDhabi Dubai Asset/Currency Performance Close ($) 1D% WTD% YTD% Global Indices Performance Close 1D%* WTD%* YTD%* Gold/Ounce 1,213.95 0.2 0.0 (6.8) MSCI World Index 2,166.15 (0.0) 0.5 3.0 Silver/Ounce 15.43 0.3 0.1 (8.9) DJ Industrial 25,583.75 (0.2) 0.5 3.5 Crude Oil (Brent)/Barrel (FM Future) 72.28 (3.2) (1.3) 8.1 S&P 500 2,857.70 (0.0) 0.6 6.9 Crude Oil (WTI)/Barrel (FM Future) 66.94 (3.2) (2.3) 10.8 NASDAQ 100 7,888.33 0.1 1.0 14.3 Natural Gas (Henry Hub)/MMBtu 2.99 1.4 4.5 (3.2) STOXX 600 389.69 (0.2) 0.1 (3.4) LPG Propane (Arab Gulf)/Ton 95.25 (3.3) 0.3 (3.8) DAX 12,633.54 (0.1) 0.1 (5.7) LPG Butane (Arab Gulf)/Ton 100.63 (2.1) (1.8) (7.3) FTSE 100 7,776.65 0.2 0.5 (3.7) Euro 1.16 0.1 0.4 (3.3) CAC 40 5,501.90 (0.3) 0.4 (0.1) Yen 110.98 (0.4) (0.2) (1.5) Nikkei 22,644.31 0.2 0.8 0.9 GBP 1.29 (0.4) (0.9) (4.7) MSCI EM 1,079.73 (0.0) 0.6 (6.8) CHF 1.01 0.2 0.1 (1.9) SHANGHAI SE Composite 2,744.07 (1.3) 0.2 (21.1) AUD 0.74 0.1 0.4 (4.8) HANG SENG 28,359.14 0.4 2.5 (5.7) USD Index 95.09 (0.1) (0.1) 3.2 BSE SENSEX 37,887.56 0.5 0.7 3.5 RUB 65.55 3.2 3.5 13.8 Bovespa 79,151.70 (2.4) (4.0) (8.7) BRL 0.27 (0.6) (1.7) (12.2) RTS 1,113.78 (2.9) (2.7) (3.5) 89.2 86.1 82.1