30 April Daily technical trader
•
0 gefällt mir•248 views

The document provides a technical analysis of the QE Index and key Qatari stocks to consider. It analyzes recent price movements and trends to determine short-term outlooks. The QE Index and most mentioned stocks are seen as experiencing pullbacks or downtrends in the short-term, with the exceptions of Commercial Bank of Qatar and Qatar Insurance which are seen as having upmove potential if they can sustain above certain resistance levels. Technical indicators like RSI and MACD are also referenced for each stock to support the given short-term outlook.

Empfohlen
Weitere ähnliche Inhalte
Was ist angesagt?
Was ist angesagt? (20)
Ähnlich wie 30 April Daily technical trader
Ähnlich wie 30 April Daily technical trader (20)
Mehr von QNB Group
Mehr von QNB Group (20)
Kürzlich hochgeladen
Kürzlich hochgeladen (20)
30 April Daily technical trader
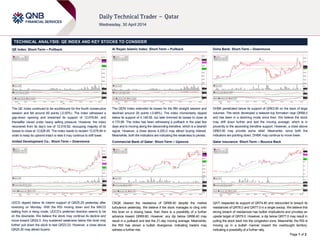
- 1. Page 1 of 2 TECHNICAL ANALYSIS: QE INDEX AND KEY STOCKS TO CONSIDER QE Index: Short-Term – Pullback The QE Index continued to be southbound for the fourth consecutive session and fell around 69 points (-0.55%). The index witnessed a gap-down opening and breached its support of 12,678.84, and thereafter caved under heavy selling pressure. However, the index recovered from its day’s low of 12,516.82, recouping majority of its losses to close at 12,626.95. The index needs to reclaim 12,678.84 in order to keep its uptrend intact or else it may continue to drift lower. United Development Co.: Short-Term – Downmove UDCD dipped below its interim support of QR25.29 yesterday after reversing on Monday. With the RSI moving down and the MACD stalling from a rising mode, UDCD’s preferred direction seems to be on the downside. We believe the stock may continue its decline and move toward QR24.0. Any sustained weakness below this level may further pull down the stock to test QR23.23. However, a close above QR25.30 may attract buyers. Al Rayan Islamic Index: Short-Term – Pullback The QERI Index extended its losses for the fifth straight session and declined around 29 points (-0.68%). The index momentarily dipped below its support of 4,148.08, but later trimmed its losses to close at 4,170.98. The index has been witnessing a pullback in the past few days and is moving along the descending trendline, which is a bearish signal. However, a close above 4,200.0 may attract buying interest. Meanwhile, both the indicators are indicating the weakness to persist. Commercial Bank of Qatar: Short-Term – Upmove CBQK cleared the resistance of QR68.40 despite the market turbulence yesterday. We believe if the stock manages to cling onto this level on a closing basis, then there is a possibility of a further advance toward QR69.80. However, any dip below QR68.40 may result in a pullback and test the 21-day moving average. Meanwhile, the RSI has shown a bullish divergence, indicating traders may witness a further rise. Doha Bank: Short-Term – Downmove DHBK penetrated below its support of QR63.90 on the back of large volumes. The stock developed a tweezer-top formation near QR68.0 and has been in a declining mode since then. We believe the stock may drift down further and test the moving average, which is in proximity to the ascending trendline support. However, a close above QR63.90 may provide some relief. Meanwhile, since both the indicators are pointing down, DHBK may continue to move lower. Qatar Insurance: Short-Term – Bounce Back QATI respected its support of QR74.80 and rebounded to breach its resistances of QR76.0 and QR77.0 in a single swoop. We believe this strong breach of resistances has bullish implications and provides an upside target of QR79.0. However, a dip below QR77.0 may result in pulling the stock back into the congestion zone. Meanwhile, the RSI is moving up in a bullish manner toward the overbought territory, indicating a possibility of a further rally.
- 2. Contacts Saugata Sarkar Keith Whitney Sahbi Kasraoui QNB Financial Services SPC Head of Research Head of Sales Manager - HNWI Contact Center: (+974) 4476 6666 Tel: (+974) 4476 6534 Tel: (+974) 4476 6533 Tel: (+974) 4476 6544 PO Box 24025 saugata.sarkar@qnbfs.com.qa keith.whitney@qnbfs.com.qa sahbi.alkasraoui@qnbfs.com.qa Doha, Qatar DISCLAIMER: This publication has been prepared by QNB Financial Services SPC (“QNBFS”) a wholly-owned subsidiary of Qatar National Bank (“QNB”). QNBFS is regulated by the Qatar Financial Markets Authority and the Qatar Exchange; QNB is regulated by the Qatar Central Bank. This publication expresses the views and opinions of QNBFS at a given time only. It is not an offer, promotion or recommendation to buy or sell securities or other investments, nor is it intended to constitute legal, tax, accounting, or financial advice. We therefore strongly advise potential investors to seek independent professional advice before making any investment decision. Although the information in this report has been obtained from sources that QNBFS believes to be reliable, we have not independently verified such information and it may not be accurate or complete. While this publication has been prepared with the utmost degree of care by our analysts, QNBFS does not make any representations or warranties as to the accuracy and completeness of the information it may contain, and declines any liability in that respect. QNBFS reserves the right to amend the views and opinions expressed in this publication at any time. It may also express viewpoints or make investment decisions that differ significantly from, or even contradict, the views and opinions included in this report. COPYRIGHT: No part of this document may be reproduced without the explicit written permission of QNBFS. Page 2 of 2 *These stocks are today’s suggested ideas Overall Methodology: The charts and descriptions on Page 1 provide an indicative view of the future direction of the equities mentioned. The table on page 2 has been provided to denote historical movements in certain stocks. The historical trend analysis uses 21- and 55- day SMAs for indicating short-term and long-term trends, respectively. Based on these SMAs, the historical direction of the trend is denoted as UP, DOWN or FLAT. Selection of Key Stocks of the Day: Key stocks’ selection is based on our analysis of 19 members of the QE Index (excludes QNBK QD). Analysis includes identifying trends (short-term as well as long-term), patterns and support/resistance levels. Trend Direction: The methods used to determine trend direction are subjective in nature. We use 21-day SMA and 55-day SMA, absolute price movements, price movements relative to SMAs and accurately drawn trend lines and chart patterns to determine the short- and long-term trends. Investment Horizon: The definition of short term and long term depends upon investors’ preferences and their investment objectives. As a rule of thumb, the time horizon for traders/short-term trend is 1-3 weeks while it is 1-3 months for investors/long-term trend. Combining Technical and Fundamental Analysis: Investors can combine technical analysis (TA) with fundamental analysis (FA) to maximize their investment returns. While the “True Value” of stocks could be estimated by FA, the entry and exit timings could be fine tuned using technical analysis to benefit from short-term movements in stock prices. Trading Tactics: The trend direction should be analyzed based on the time-horizon of your investments. In general, investors attempt selling close to resistance levels during a downtrend and attempt buying close to support levels during uptrend. Definitions: 1> Simple Moving Average (SMA): A SMA is the average of the closing price of a security for a given period. 2> RSI (Relative Strength Index): A technical momentum indicator that ranges from 0 to 100 and compares the stock’s recent price movements by evaluating recent gains and losses. Stocks with RSI above 70 could be considered overbought and below 30 could be considered oversold. If the RSI falls below 70, it is a bearish signal. On the other hand, if the RSI rises above 30 it is considered bullish. We use a RSI of 14 days. 3> MACD (Moving Average Convergence Divergence): MACD denotes the relationship between two moving averages, which is used to spot changes in strength, direction, momentum and duration of a stock price trend. The MACD is calculated by subtracting the 26-day exponential moving average (EMA) from the 12-day EMA. A nine-day EMA of the MACD, called the signal line, is also plotted on top of the MACD, functioning as a trigger for buy/sell signals. The MACD line above the signal line provides a positive signal and vice versa. Name (Ticker) Last Close Trend Support Resistance Short Term Long Term First Second First Second Qatar Exchange Index (QE Index) 12,626.95 UP UP 12,600.00 12,513.75 12,678.84 12,768.17 Al Rayan Islamic Index (QERI Index) 4,170.98 UP UP 4,148.08 4,100.00 4,200.00 4,247.34 Banks and Financial Services Banks and Masraf Al Rayan (MARK QD) 47.40 UP UP 45.02 44.15 48.50 51.80 Commercial Bank of Qatar (CBQK QD)* 68.90 UP UP 68.40 67.30 69.80 70.70 Doha Bank (DHBK QD)* 63.20 UP UP 62.00 60.00 63.90 65.70 Qatar Islamic Bank (QIBK QD) 84.90 UP UP 84.70 81.70 87.30 88.50 Qatar International Islamic Bank (QIIK QD) 84.50 UP UP 83.00 80.70 86.10 98.50 Qatar Insurance (QATI QD)* 77.30 UP UP 77.00 76.00 79.00 80.50 Al Khalij Commercial Bank (KCBK QD) 22.23 DOWN FLAT 21.80 21.29 22.49 22.90 Consumer Goods and Services Consumer G Medicare Group (MCGS QD) 85.80 UP UP 85.00 83.40 87.80 90.00 Al Meera Consumer Goods Co. (MERS QD) 184.50 UP UP 183.00 178.50 185.00 187.50 Industrials Industries Qatar (IQCD QD) 176.80 UP FLAT 175.00 173.00 178.30 180.00 Qatar Electricity & Water Co. (QEWS QD) 183.00 FLAT UP 180.00 178.18 184.00 186.00 Gulf International Services (GISS QD) 88.90 DOWN UP 86.60 84.80 90.00 93.00 Qatari Investors Group (QIGD QD) 67.00 UP UP 64.70 61.30 68.40 71.70 Real Estate Barwa Real Estate Co. (BRES QD) 39.00 UP UP 38.40 37.40 39.70 41.40 United Development Co. (UDCD QD)* 24.99 UP UP 24.00 23.23 25.29 25.80 Telecom Ooredoo (ORDS QD) 145.40 FLAT UP 143.00 141.80 148.00 149.00 Vodafone Qatar (VFQS QD) 17.14 UP UP 16.89 16.00 17.99 19.29 Transportat Nakilat (QGTS QD) 23.74 UP UP 22.80 22.50 24.00 24.50 Milaha (QNNS QD) 97.50 UP UP 95.10 93.00 98.30 100.10