Web Form Automation for Bonterra Impact Management (fka Social Solutions Apri...
Six sigma cmm levels style design 2 powerpoint ppt slides.
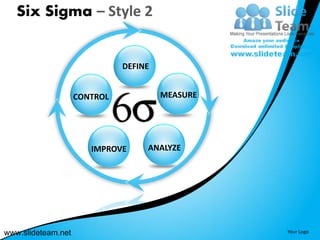
1. Six Sigma – Style 2
DEFINE
CONTROL MEASURE
IMPROVE ANALYZE
www.slideteam.net Your Logo
2. Six Sigma – Style 2
Stage 1
• Your Text Goes here
DEFINE • Download this awesome
diagram
• Bring your presentation to life
• Capture your audience’s
CONTROL MEASURE
attention
• All images are 100% editable
in powerpoint
• Your Text Goes here
• Download this awesome
diagram
IMPROVE ANALYZE
• All images are 100% editable
in powerpoint
• Your Text Goes here
www.slideteam.net Your Logo
3. Six Sigma – Style 2
Stage 2
• Your Text Goes here
DEFINE • Download this awesome
diagram
• Bring your presentation to life
• Capture your audience’s
CONTROL MEASURE
attention
• All images are 100% editable
in powerpoint
• Your Text Goes here
• Download this awesome
diagram
IMPROVE ANALYZE
• All images are 100% editable
in powerpoint
• Your Text Goes here
www.slideteam.net Your Logo
4. Six Sigma – Style 2
Stage 3
• Your Text Goes here
DEFINE • Download this awesome
diagram
• Bring your presentation to life
• Capture your audience’s
CONTROL MEASURE
attention
• All images are 100% editable
in powerpoint
• Your Text Goes here
• Download this awesome
diagram
IMPROVE ANALYZE
• All images are 100% editable
in powerpoint
• Your Text Goes here
www.slideteam.net Your Logo
5. Six Sigma – Style 2
Stage 4
• Your Text Goes here
DEFINE • Download this awesome
diagram
• Bring your presentation to life
• Capture your audience’s
CONTROL MEASURE
attention
• All images are 100% editable
in powerpoint
• Your Text Goes here
• Download this awesome
diagram
IMPROVE ANALYZE
• All images are 100% editable
in powerpoint
• Your Text Goes here
www.slideteam.net Your Logo
6. Six Sigma – Style 2
Stage 5
• Your Text Goes here
DEFINE • Download this awesome
diagram
• Bring your presentation to life
• Capture your audience’s
CONTROL MEASURE
attention
• All images are 100% editable
in powerpoint
• Your Text Goes here
• Download this awesome
diagram
IMPROVE ANALYZE
• All images are 100% editable
in powerpoint
• Your Text Goes here
www.slideteam.net Your Logo
7. Six Sigma – Style 2
Statistical Measure of Variations
Y
www.slideteam.net X Your Logo
8. All images are 100% editable in Powerpoint
“Change color, size and orientation of any icon to your liking”
www.slideteam.net
9. Ungrouping the object
2
1
3
1. Right click the object.
2. Choose Group and then Ungroup.
3. Click beside the object and drag the arrow over it.
www.slideteam.net
10. Edit Color
2 3
1
1. Select the shape to change the color and Right click the object( click any object which you
want to change color)
2. Choose Format Shape in the dialog box.
3. Choose “Fill” in the Format Shape box then “Solid” or “Gradient” depending on the
appearance of the object. Change colour as shown in the picture.
www.slideteam.net