26. 26
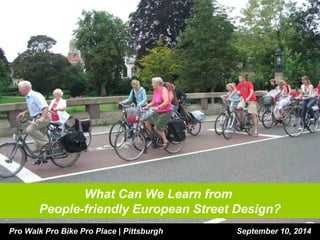
Planning and Designing for Cyclists
Headline Principle:
Accessibility
and
Advantage
27. Invisible Infrastructure
refers to the idea that:
“Invisible infrastructure” refers to all sustainable
transport policies, practices, and physical measures
which contribute to a walk/bike-friendly environment
but are not walk/bike-specific, such as:
- traffic calming
- land use policies
- congestion charging
- pricing parking
28. Taming the Automobile
“What do we do about the car?”
Get these “right” ...
- Density
- Proximity
- Mix of uses
- Transportation Options
“... and the car drops out of the equation.”
Gordon Price,
former member of
Vancouver City
Council
29. Area, Population, and Density
Country or
state
Population
density
(/km2)
Area (km2) Population
Netherlands 393 41,526 16,866,900
Belgium 337 30,510 11,007,020
United
256 243,610 62,262,000
Kingdom
Germany 233 357,021 81,799,600
Denmark 125 43,094 5,368,854
France 111 547,030 63,601,002
Scotland (UK) 68 78,387 5,313,600
Lithuania 55 65,200 3,601,138
Sweden 20 449,964 9,515,744
31. Per Capita CO^2 emissions
Country Annual CO^2 Per Capita
emissions
% of world
emissions (kt)[7] total
Lithuania 13561 4.378 0.04%
France 361273 5.556 1.07%
China 8286892 6.195 24.65%
European Union 3709765 7.351 11.04%
United Kingdom 493505 7.863 1.47%
Denmark 46303 8.346 0.14%
Germany 745384 9.115 2.22%
Belgium 108947 9.977 0.32%
Netherlands 182078 10.958 0.54%
United States 5433057 17.564 16.16%
32. Current Account Balance (CAB)
Rank Country CAB
(billion US
dollars)
Year
1 China 213.8 2012
2 Germany 208.1 2012
7 Netherlands 70.92 2011
13 Sweden 38.29 2011
18 Denmark 22.1 2011
35 Belgium 4.7 2011
127 Lithuania -1.225 2011
188 France -57.2 2012
191 United
Kingdom
-93.6 2012
192 United States -440.4 2012
33. Bicycle use (share of trips)
Netherlands 27%
Sweden 13%
Denmark * 17%
Germany (1989) 12%
France – Grenoble 5%
France - Lyon 2%
Great Britain * 2%
Source: Hydén et al, 1999
* Trips longer than 500 meters
34. Car Ownership (per capita)
Global Rank Country Motor vehicles per
1000 people
19 France 578
20 Germany 572
22 Lithuania 560
23 Belgium 559
27 Netherlands 528
29 Sweden 520
30 United Kingdom 519
Source: World Bank, 2010
42. Hull
- 26% of the road network covered with
20mph zones, which resulted in
- 56% casualty reduction
- 90% death/serious injury reduction
- Spent $9 million
- Estimated savings of $70 million
- To cover 60%, need to spend $22 million
- Cycling split: 1% to 11%
- “You can do amazing things by traffic
calming your city!”
64. Photo: Tom Bertulis
Intermodal facility showing easy underground access from train station to bus station
with Cycle Track approach, Leuven, Belgium
65. Cycle Chicane at blind corner
Leuven, Belgium
Photo: Tom Bertulis
66. Can Dutch infrastructure be replicated in the US or
are they culturally and geographically too different?
67. The North Sea flood of 1953 (2,500 fatalities) had
a major impact on the psyche of the Dutch people
68. Dutch system of government: the “Polder Model”
There are three useful aspects to the Dutch polder model:
(1) Objective: The sense that some things are so important that
blocking action for the sake of ideology is unconscionable.
(2) Compromise: Upholding the idea that coming together over
differences is in fact the key to success, not the barrier to it.
(3) Consensus: The ability of leaders to get everyone in the
same room and insist upon working things through. “In the
absence of action, it's the sea for us all, metaphorically.”
* The "informateur" in Dutch politics is the
person whose sole job it is to create
agreement, bring the parties together to
form a governing consensus.
For more info, see Crosscut.com: The Dutch have a cure for 'Seattle Process'
70. A Tale of Two Cities: Rijswijk and Delft
Source: NEU Netherlands Wiki, 2011
71. A Tale of Two Cities: Rijswijk and Delft
Source: NEU Netherlands Wiki, 2011
72. Percentage of all trips by bicycle
ROLE OF THE BICYCLE
Bicycle use, all trips (not to be confused w/
the commonly used “commute trips”)
(municipalities > 100,000 population)
Zwolle 37 % Amsterdam 25 %
Groningen 36 % Haarlem 25 %
Leiden 36 % Maastricht 21 %
Apeldoorn 32 % Haarlemmermeer 20 %
Enschede 32 % The Hague 20 %
Utrecht 30 % Almere 19 %
Nijmegen 29 % Rotterdam 15 %
73. Key Design Issues
o Street connectivity, planning factors (the right combination
of density, mix, proximity and transportation choices)
o Street crossings: desire lines, crosswalks, medians, over
and underpasses
o Pedestrian-friendly intersections: geometry, turning radii,
curb bulbs, crosswalk placement
o Signals: European signals vs US signals
o Road diets/Right-sizing: popular in
some areas
o Sidewalk Design
81. Speed Hump with no signing to minimise visual clutter, they proactively install humps rather than reactively
Amsterdam, Netherlands
Photo: Tom Bertulis
94. Groningen city center is enclosed by a ring road (shown). Nearly every street within the ring road consists of
contra flow lanes on one way streets such as in this photo, making Groningen among the top cycling city in
Europe in terms of the “A&A” Double Pillars of Advantage (over cars) and Accessibility (for cyclists)
Groningen, Netherlands
Photo: Tom Bertulis
117. Cycle lane through Bus Stop – note island for pick up & drop off to reduce ped-bike conflicts
Enschede, Netherlands
Photo: Tom Bertulis
118. Shared space roundabout– note that the height of the water increases with the volume of traffic (there were few cars on this day)
Dratchen, Netherlands
Photo: Tom Bertulis
119. Family cycling at roundabout
Dratchen, Netherlands
Photo: Tom Bertulis
133. A Green Wave (“Gron Bolge”) sign along a bicycle route showing the “timed” bicycle speed of the traffic signals
Odense, Denmark
Photo: Tom Bertulis
134. Speed readout for cyclists along corridor with traffic signals synchronised for bicycle traffic
Odense, Denmark
Photo: Tom Bertulis
136. Cycle Counter – nearly 7,000 cyclists had passed that spot so far that day
Odense, Denmark
Photo: Tom Bertulis
137. Sweden
- I met with Trafikverket, aka the Swedish national transport agency.
They're the agency that implements Vision Zero in Sweden.
- They told me that it was only when they included hospital data
nationwide that they could see the true extent of bicycle crashes,
finally bringing bicycle safety to the forefront of the safety agenda.
- Take away: advocate to include hospital data in your community,
not just police reports.
167. Cycling km vs fatality rates per km cycled
Cycling kilometres Killed cyclists per
per person per day 100 million kms
Great Britain 0.1 6.0
Italy 0.2 11.0
Austria 0.4 6.8
Norway 0.4 3.0
Switzerland 0.5 3.7
Finland 0.7 5.0
Germany 0.8 3.6
Sweden 0.9 1.8
Denmark 1.7 2.3
The Netherlands 2.5 1.6
Source: Faculty of Spatial Sciences 2003
168. ECF Ranking the top 20 euro biking countries
Tied for 1st
Denmark
Netherlands
3rd Sweden
5th Germany
6th Belgium
10th UK
11th France
20th Lithuania (just above Portugal
and Spain)
Source: European Cyclists' Federation
169. Some take away points ...
1. Don't build undivided 4-lane roads;
2. Raise side streets where possible;
3. Use median islands to improve ped safety;
– 4. Unmarked contraflow bike facilities are safe
and common in European experience;
– 5. Build “modified mini-roundabouts,” Glasgow-style,
they have tremendous safety benefits;
– 6. Experiment with centerline removal and
advisory bike lanes to increase comfort levels;
– 7. Advocate to include hospital crash data;
8. Try “protected intersections.”