OTT Video Platform Infographic
•
0 gefällt mir•561 views

Infographic dealing with the requirements and other aspects of running an OTT Video service - showing a cross-section of relevant dimensions from technology to video delivery to revenue related aspects in video management.
Empfohlen

Empfohlen
Weitere ähnliche Inhalte
Was ist angesagt?
Was ist angesagt? (20)
Andere mochten auch
Andere mochten auch (9)
Ähnlich wie OTT Video Platform Infographic
Ähnlich wie OTT Video Platform Infographic (20)
Mehr von Petr Nemec
Mehr von Petr Nemec (7)
Kürzlich hochgeladen
Kürzlich hochgeladen (20)
OTT Video Platform Infographic
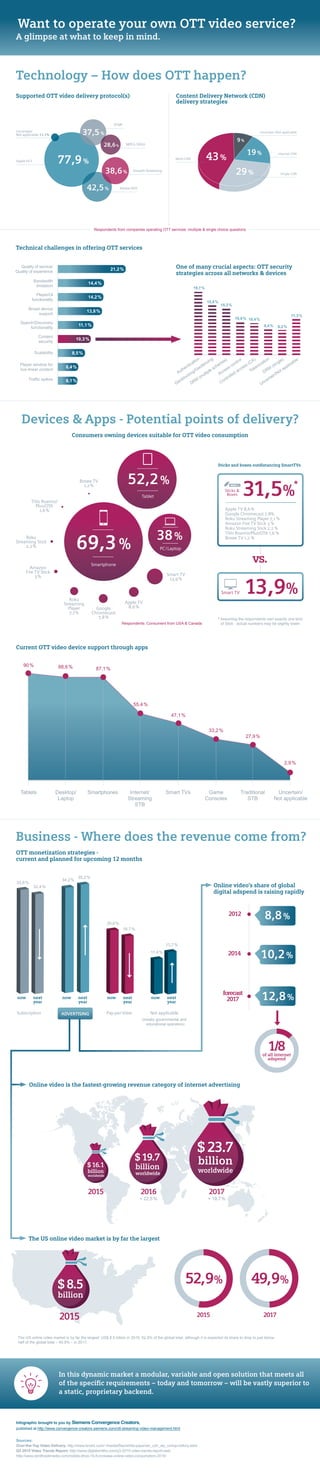
- 1. Want to operate your own OTT video service? Consumers owning devices suitable for OTT video consumption Current OTT video device support through apps OTT monetization strategies - current and planned for upcoming 12 months Online video's share of global digital adspend is raising rapidly Online video is the fastest-growing revenue category of internet advertising The US online video market is by far the largest now now now nownext year next year next year next year A glimpse at what to keep in mind. Devices & Apps - Potential points of delivery? Business - Where does the revenue come from? Subscription Pay-per-View Not applicable (mostly governmental and educational operators) 33,8 % 32,4 % 34,2 % 35,2 % 20,6 % 18,7 % 11,4 % 13,7 % $ 8.5 billion $ 16.1 billion worldwide $ 19.7 billion worldwide $ 23.7 billion worldwide 2015 2015 2015 2017 2016 2017 2012 2014 forecast 2017 8,8 % 10,2 % 12,8 % 1/8of all internet adspend 52,9% 49,9% + 22,5 % + 19,7 % The US online video market is by far the largest: US$ 8.5 billion in 2015, 52.9% of the global total, although it is expected its share to drop to just below half of the global total – 49.9% – in 2017. Technology – How does OTT happen? Smart TV 13,9 % Smart TV Sticks & Boxes Apple TV 8,6 % Apple TV 8,6 % Google Chromecast 7,8% Roku Streaming Player 7,1 % Amazon Fire TV Stick 3 % Roku Streaming Stick 2,2 % TiVo Roamio/Plus/OTA 1,6 % Boxee TV 1,2 % Google Chromecast 7,8 % Roku Streaming Player 7,1 % Amazon Fire TV Stick 3 % Roku Streaming Stick 2,2 % TiVo Roamio/ Plus/OTA 1,6 % Boxee TV 1,2 % 13,9% 31,5% * vs. 69,3 % Smartphone 52,2 % Tablet 38 % PC / Laptop * Assuming the respondents own exactly one kind of Stick - actual numbers may be slightly lower. Supported OTT video delivery protocol(s) Content Delivery Network (CDN) delivery strategies RTMP MPEG-DASH Smooth Streaming Adobe HDS Apple HLS Uncertain/ Not applicable 11,1% 77,9 % Uncertain /Not applicable Single CDN Internal CDN Multi-CDN 9 % 19 % 29 % 43 % 37,5 % 38,6 % 42,5 % 28,6 % ADVERTISING Respondents from companies operating OTT services -multiple & single choice questions Respondents: Consumers from USA & Canada Sticks and boxes outdistancing SmartTVs In this dynamic market a modular, variable and open solution that meets all of the specific requirements – today and tomorrow – will be vastly superior to a static, proprietary backend. Infographic brought to you by Siemens Convergence Creators, published at http://www.convergence-creators.siemens.com/ott-streaming-video-management.html One of many crucial aspects: OTT security strategies across all networks & devices Quality of service/ Quality of experience Bandwidth limitation Player/UI functionality Broad device support Search/Discovery functionality Content security Player window for live linear content Scalability Traffic spikes 21,2 % 14,4 % 14,2 % 13,8 % 11,1 % 10,3 % 8,5 % 6,4 % 6,1 % Authentication Geoblocking/Geofencing DRM (multiple schemes) Access control Controlled access (CA) Tokenization DRM (single) Uncertain/Not applicable Technical challenges in offering OTT services 19,7 % 15,8 % 15,3 % 10,8 % 10,4 % 8,4 % 8,2 % 11,3 % Tablets 90 % 88,6 % 87,1 % 55,4 % 47,1 % 33,2 % 27,9 % 2,9 % Desktop/ Laptop Internet/ Streaming STB Smart TVs Game Consoles Traditional STB Uncertain/ Not applicable Smartphones