Business guide on carbon emission redution and sustainability
CE EEB Submission PD 18 3 15r2a
1. The Circular Economy – a Plan for Europe
Response to European Environment Bureau on the New Circular
Economy Package (updated).
Paul Dumble MSc MCIWM MIEMA CEnv
Waste Systems Specialist
(Twitter: @PaulDumble)
Scotland, United Kingdom
6 April 2015
2. Page 2 of 15
The Author
Paul Dumble is a Chartered Environmentalist and Chartered Waste Manager who has built up his
career since graduating in Chemistry at Leeds University in 1976 and following an early career path
in research, development and production of supply chain products. After obtaining Master’s Degree
in Waste Management in 1997 at the University of Central Lancashire, he was able to follow a
second career in waste and environmental management.
Career highlights include in the period (2008-2011) the design and planning of the World Class
Nadafa programme in the Emirate of Abu Dhabi which set up an electronic duty of care system for
all waste types, a live GIS based waste vehicle tracking system and a tariff system based on the
activity and size of waste producers. Within 3 weeks of implementation fly tipping in the Emirate had
been reduced by over 95% with an additional 4+ million tonnes of waste being received at
authorised waste sites in the Emirate over the next twelve months. Paul is a waste infrastructure
planner and in 2012 submitted a revised US$25 billion plan to another Middle East country to
recover 100% of the procurement costs through adoption of concepts including the circular
economy, recycling and remanufacturing.
Paul also acted as a technical author within the Freight Team coordinating the production of the
London Freight Plan from sector specialists in the period of 2005-2008, compiling a plan for the
Capital based on multimodal sustainable distribution and servicing and making individual
contributions as an expert in waste and utility transport.
Utilising his qualifications and skills in training and development, he lead a team with the
Environment Agency and NGO Groundwork in 1998 in the development of a waste minimisation
training board game - Eliminate which was published in partnership with the WWF in 2000
supporting the development of the principles of the 3R’s - Reduce, Reuse, Recycle within and
benefiting multi-sector SME companies.
Paul can be contacted through Twitter @PaulDumble or his LinkedIn account at
http://uk.linkedin.com/pub/paul-dumble/4/790/823 or on +44 775 899 7644.
The value in waste is in its embodied and embedded energy.
Energy security can be accomplished by switching to low carbon and renewable energy sources.
Resource security risk can be improved and minimised by making the circular economy work in
significantly reducing unsustainable virgin raw material extraction and
excessive virgin raw material use
The remanufacturing sector must take a proportion of the market share currently occupied by
principally virgin raw material manufacturers
Poverty is symptom of unsustainable growth
3. Page 3 of 15
Response to European Environment Bureau on the New Circular
Economy Package.
Introduction
This paper responds to a discussion on the new Circular Economic Package on Twitter -
@PaulDumble; @ResourcesCount; @PBarczak; @Green_Europe. Issues raise included market,
planning, logistics, growth and reduce measures….. (March 8, 2015).
This is not a critique of the detailed actions on waste management that the EEB have put forward.
However, this is an attempt to put the proposed Circular Economic Package into a wider policy
driven strategic framework that will deliver the necessary reduction in virgin raw material usage and
increase in recycling and remanufacturing activities.
Linking Climate Change Policy to Strategic Circular Economic Considerations
Growth in population levels has occurred mainly in our urban centres since the start of the industrial
development in 1750 from a previously and largely agrarian society that provided the labour for the
increased productivity. Growth models and plans (socio economic) particularly large cities such as
London, Paris and Berlin are based on this principle. In terms of global population the limit is
estimated to be about 10 billion based on this (1) and a number of other sustainability limits
including those related to resource and biodiversity being exceeded (2). From UN figures the world is
expected to reach this limit in the period 2050 to 2100 (3). Further, each billion people has added
about 18 (±4) ppm of CO2 to the atmosphere since 1951 (4) with the current level being about or
above 400ppm (March 2015).
4. Page 4 of 15
It is UK policy to reduce anthropogenic greenhouse gas emissions to 80% of 1990 levels by 2050 (5),
equivalent to a global emission level of about 7.6GtCO2eq per year and a radiative forcing level below
zero Wm-2
- from charts in (6)(7). To achieve this we must significantly increase the level of energy
efficiency in our use of fossil fuels and we must also increase the amount of renewable and low
carbon energy to largely replace fossil fuel sources. An illustration of the scale of intervention
required globally is shown in Figure 1 above, at significantly reduced emission levels that could start
to stabilise or reduce global temperature rises (8).
Whilst the levels of intervention are significant they still require urgent implementation. The
population issue is critical and will no doubt receive appropriate policy intervention elsewhere.
However, it is important to have a model or plan that can work under different scenarios and
provide some flexibility to what is an issue affecting human survival.
Energy efficiency impacts on all aspects of waste management and an illustration of this is shown in
Figure 2 in relation to population growth or contraction, the supply chain and within the wider
energy context that will drive necessary interventions (8).
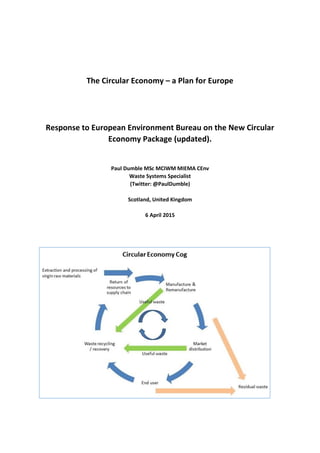
Breaking this down to issues that affect waste management and resource circles provides us with
the illustrative inventory shown Figure 3 below.
5. Page 5 of 15
In doing this we have established a direct link between energy efficiency, renewable energy up take
and resource efficiency providing the strategic frameworks for the circular economy package.
Emission savings can be directly related to energy efficiency measures and increased adoption of
renewable energy and low carbon sources providing a consistent and integrated approach on
resource efficiency, the circular economy and Climate Change.
We now need to establish where the emission savings will come from and how to use this basis for
valuing waste based on energy savings within the supply chain.
Valuing waste based on energy
We wish to value a waste type based on its embodied energy EEwt. The embodied energy includes
transport, process and thermodynamic energy in the waste that has been used from the extraction
of the raw material from the ground to the point at which it becomes a waste with the end user.
Let us define the embodied energy at the point at which a waste can be returned to the supply chain
as a raw material as EErmt.
Where: EErmt < EEwt (1)
The supply chain is illustrated in Figure 4 shown below.
6. Page 6 of 15
If the energy (as fuel and power) expended in the collection, treatment and transport of the waste
and the conversion into a suitable raw material is greater than EErmt then usually it will take more
energy to use the waste as a substitute raw material for the virgin raw material. However, even if
this is the case there is the embedded enthalpy energy contained within the waste which would be
lost manifestly as emissions if it was disposed of. So from this point of view, the last benefit to be
extracted from the waste is in the recovery of its thermodynamic value (e.g. as carbon, oil.
flammable gas or power).
So we can write an equation setting the conditions for the recovery of the waste as a fuel or energy
𝑅𝐸
𝐸𝐸 𝑟𝑚𝑡
≥ 1 (2)
Where
RE = Remanufacturing Energy made up of E collection and transport + Eprocess. Units: Mj/kg. Where the
energy E is made up of fuel and or power sources.
So from a re-manufacturing point of view the ideal situation would be described as the following
equation;
𝑅𝐸
𝐸𝐸 𝑟𝑚𝑡
< 1 (3)
Currently this is decided on economic factors which moves the recovery (as energy) within the
bounds of equation (3) and remanufacturing generally only takes place with wastes satisfying the
requirements set out in equation 4.
𝑅𝐸
𝐸𝐸 𝑟𝑚𝑡
≪ 1 (4)
To gain the necessary energy efficiencies from waste treatment processes required to stabilise
global temperature rises then equation (3) should become the norm and only waste satisfying the
criteria of equation (2) should be used for energy recovery or thermal conversion processes. Such a
limitation that may include a prioritisation in favour of capability for storage or capture of carbon
may favour for example processes such as pyrolysis and anaerobic digestion over incineration.
Calorific values in the range of 10-14 Mj/kg are preferred for municipal waste where incineration
processes are applied. The minimum thermal incineration process specification is normally around
8Mj/Kg for waste feedstock. This indicates that there could be up to 20% to 40% or more of the
municipal waste (in terms of surplus calorific value) available for treatment to provide materials for
7. Page 7 of 15
remanufacturing purposes. The savings in remanufacturing the waste would include the CO2eq
emitted should the waste have been incinerated or disposed to landfill.
This aspect will become far more significant as plastic supplies decrease with the anticipated future
managed decline of the oil and gas sector by 2070 (6). The criteria in (3) may affect the commercial
viability of many of the thermal treatment processes – however, incineration process will become
simply a treatment process to eliminate emissions of methane and other damaging greenhouse
gases from the landfilling of untreated waste.
It should also be noted that through the adoption of best practices and/or emerging technologies, a
waste satisfying the requirements of equation (2) could with such interventions including
improvements in transport logistics, location of treatment centres and treatment technologies
lowering process energy requirements, be transformed into a situation where equation (3) could
apply. This transition could make the waste suitable as a potential remanufacturing material.
Modelling of circular economy emission savings
Modelling has been undertaken on known waste characterisations, estimates of embedded and
embodied energies and the implementation of prospective waste treatment and remanufacturing
infrastructure changes for countries in Middle and Far East, to calculate annual country emission
savings that could be made from municipal solid waste (MSW) and commercial and trade wastes.
The figures calculated by the model do not include renewable energy usage or contributions. This is
considered below in the next section of this report dealing with the market. The impact of a
permanently established remanufacturing sector is likely to increase emission savings further due to
recyclables being circulated many times, facilitating a further reduction in demand for virgin
materials. Table 1 below shows estimates for the model for two countries based on urban data from
China and country data from the Emirate of Abu Dhabi.
The Emirate Abu Dhabi has very high energy usage per capita (9) which has been reflected in the
lower than expected annual country emission savings shown in Table 1. For the estimates for China,
the waste arising characterisation is from 2002 and the Annual Country Emission Savings given is
likely to higher than calculated by the model.
The higher recycling rates in the European Union and energy rich waste characterisation would
indicate country emission savings for MSW (only) to be in the region of 2- 4%. The integration of
commercial and trade wastes into the circular economy could add a further 2 to 3 times this value
with likely country emission savings in the range of 4 to 12% across Member States in the European
Union.
8. Page 8 of 15
Market
To create the necessary remanufacturing infrastructure we need to create a regulatory value within
the supply chain cost and pricing structures. A similar approach is used in for example the
introduction of landfill taxes where a regulatory cost is introduced to create market incentives for
the recovery and treatment of waste or the adoption of regulatory or market systems to trade
emissions or credits related to producer responsibility of climate change regulation.
The charge shown in equation (5) utilises equations (2) and (3) and relates the charge to energy lost
or gained, the material recycled and the current market value of the raw material lost. So the
disposal and treatment charge would be calculated as follows;
𝑅𝐸
𝐸𝐸 𝑟𝑚𝑡
𝑥 (1 − 𝑅𝑅) 𝑛
𝑥 𝑀 = C (5)
Where
n ≥ 1 and this is the market softening factor (see next section below)
C= Charge for waste treatment and disposal
RR = recycling rate expressed as fraction of the quantity of waste recycled divided by the
total waste of that type collected.
M = Market price of the virgin material (its formulated raw material price*) at the re-entry
point into supply chain of the recycled waste as a raw material.
*The formulated raw material (FRM) price would be made up of the costs of the various components
of the plastic including the polymer, plasticisers, additives and fillers such as talc and pigments. Each
component being considered as virgin materials. The designation of formulated raw materials may
also include assembled products or components (ARM) where segregation or separation of recyclables
cannot be accomplished through simple mechanical methods.
How the Virgin Raw Material Charge might be used by Governments
This charge may replace disposal charges and taxes such as landfill tax, producer responsibility and
some permitting fees. However, Governments might choose to utilise this charge to help stabilise
and consolidate macro-economic inflation (quantitative easing) by reducing borrowing and paying
off fiscal deficits.
Basis of the Virgin Raw Material Charge
This charge is essentially be made for value lost as result of disposal or loss of the virgin raw material
and would be made directly to the manufacturer. The use of the charge C would provide a financial
incentive to
Increase the recycling rate or
Design out unnecessary material used,
and contribute to and work with the remanufacturer and supply chain stakeholders to enable
The reduction of supply chain energy impacts on the manufacturing process
To build in a mechanism related to annual emissions, rewarding supply chain energy efficiency and a
switch to renewable energy sources, equation (5) would be modified as follows;
9. Page 9 of 15
𝑅𝐸
𝐸𝐸 𝑟𝑚𝑡
𝑥 (1 − 𝑅𝑅) 𝑛
𝑥 𝑀 𝑥
1−𝑅 𝑤
𝑊
= 𝐶𝑣𝑚 (6)
Where
Cvm = the Virgin Material Charge
Rw = the fraction of renewable energy (as fuel or power) divided by total fuel and energy
(renewable and fossil fuel).
W = Manufacturer’s Warranty period in years
Equation (6) relates warranty period to the anticipated lifetime of the product and by use of such a
relationship
1
𝑊
, manufacturers will be incentivised to extend warrant periods and to provide ongoing
maintenance within their business models. For fast moving consumer goods (FMCG), W measured in
years may relate to the shelf life of the product. By including the renewable energy Rw fraction, this
effectively discounts the Virgin Raw Material Charge Cvm.
Equation (6) links directly to global energy and emissions is through a near linear scalar vector
relationship
𝑓(𝑒, 𝑎. 𝑏. 𝑐) = 𝑒1 𝑥 𝑎1 𝑥 𝑏1 𝑥 𝑐1 + 𝑒2 𝑥 𝑎2 𝑥 𝑏2 𝑥 𝑐2 + ⋯ 𝑒 𝑛 𝑥 𝑎 𝑛 𝑥 𝑏 𝑛 𝑥 𝑐 𝑛 (7)
Where e = annual emissions (GtCO2eq), a = energy efficiency, b = renewable energy, c = population
change (each expressed as a fraction) - See Figure 1 at start of this report. The energy efficiency
fraction a1relates to
𝑅𝐸
𝐸𝐸 𝑟𝑚𝑡
and the renewable energy fraction bn directly relates to Rw in equation (6).
This provides us with a direct link of climate change emissions and sustainable development
principles requiring “development that meets the needs of the present without compromising the
ability of future generations to meet their own needs” (Bruntland Commission Report, 1987).
Estimated Impact of Virgin Material Charge on laptop computer
So for a laptop (average mass about 1.5kg) with an ARM price of say €30/ kilo = €30,000/ tonne, a
recycling rate of 50%, market softening factor n=1 and remanufacturing energy ratio
𝑅𝐸
𝐸𝐸 𝑟𝑚𝑡
of 0.9,
with a warranty of 1 year may and utilising 30% of is supply chain energy from renewable sources
(Rw) would have a Virgin Raw Material Charge that would increase the ARM price by 22.68%. If a two
year warranty was applied this would ARM price increase would reduce to 11.34% - though the
warranty period would need to be verified by market use and other supporting data. Increasing the
effective warranty period would in essence lead to a reduction in the virgin material charge.
Reducing the virgin material charge further – Designing out waste
By light weighting products, increasing recycling rates, increase use of renewable energy sources and
increasing product lifetimes, manufacturers would be able to eliminate the use of unnecessary raw
materials and reducing further the price impact on end users. This equation provides an economic
tool to designers considering the whole life cycle of the product and method to reduce material
resource consumption.
10. Page 10 of 15
Imported goods
For imported goods the charge would be calculated in the same way with importers providing data
pertinent to the transport and process energy and other factors included in equation (6). Whilst in
some cases the cost of raw materials may be lower, the additional energy from the transport of
imported goods within
𝑅𝐸
𝐸𝐸 𝑟𝑚𝑡
will increase the Virgin Raw Material Charge and this may discourage
imports of FMCG with short product lifetimes.
Food products
Whilst food products due their short product lifecycle would not be included in this scheme. Though
modification of equation (6) could be undertaken to reflect the general principles incorporated.
Market intervention
Using these equations we can now intervene in the market pricing of virgin raw materials through
the virgin material charge Cvm proposed in equation (6). This charge will be used to develop and fund
a public private sector network of remanufacturing, waste recovery and recycling networks and
disposal costs.
Further certain materials such as rare earths or precious metals used in for example electronic circuit
boards, essential materials such a phosphates or any materials being used unsustainably would need
to be prioritised for recycling and return to the supply chain.
Anticipated Market Reaction
Market reaction to the charge is likely to be seen in the form of an attempt by virgin raw material
producers to increase volumes effecting a decrease in prices (and formulated costs or raw
materials). Dependant on the cost base of the producer this will drive out those that are less
competitive from the market place, gaining market share and restore price albeit at much lower
level. A similar approach is currently being applied by oil and gas producers (OPEC) to drive out
higher cost competition. This approach may also damage fledgling renewable energy developments
(in 2015) which the new charge in contrast will promote and encourage.
However manufacturers are likely to adopt design policies to minimise the impact of the virgin raw
material on their products through raw material reduction and increased recycling measures that
will involve investment in increased energy efficiency measures and renewable power and fuel
supplies,
Unfortunately, there is likely to be created a black market in purely virgin material and goods for
some of those able to afford the increased costs – a deviant scenario that I think will follow along the
lines of the poachers in Africa that have persecuted established species to extinction.
Softening the Market Introduction of the Virgin Raw Material Charge Cvm
A market softening factor (n) has been included in the equation (6) to enable Member States to plan
to introduce the charge and minimising adverse impacts on their economy. The Member State given
advanced notice can establish the best attainable baseline conditions for their own economy and
provide a transition plan within the required timescale that will still encourage waste and resource
best practices and the development of remanufacturing facilities.
Using n=1, the price increase impact may be severe to manufacturers in terms of a formulated raw
material price increase that could be greater than 20 - 25%. Such an initial impact would reflect on
11. Page 11 of 15
consumer prices adversely, though this price increase is likely to be reduced significantly as result of
free market adaption and adjustments to existing tax measures discussed above. By increasing the
value of n, where n>1 in equation (6) and W=1, the impact is softened more significantly at the lower
middle to higher recycling levels as illustrated in in Figure 5. The prices are based formulated or
assembled raw material costs (FRM or ARM) though for this exercise the same %FRM price increases
would occur across for the whole price range of formulated or assembled raw materials.
The market softening impact set at n=2 based on modest recycling rates (20 to 40%) is likely to
reduce increases in formulated raw material prices to the level of 10-20%. However, this softening
factor will need to return to n=1 by or at the end of the transition period, so that the raw material
prices will be maintained at a higher level to stimulate ongoing reductions in virgin raw material
usage. With raw material reduction strategies even a modest reduction of 10% to 20% could return
prices to their previous levels, so manufacturers based in Member States will be incentivised to
effect these changes, prior to implementation of the charge.
In energy terms, the charge could be applied to fossil fuels at about 85% to 100% as these fuels are
almost entirely converted into emissions through the combustion process. However, the capture of
fugitive emissions in the supply chain and increase in energy efficiency could be used to offset part
of the increase in price within the supply chain and encourage intervention by producers.
One consequence of the virgin raw material charge would be emergence of new breed of locally
based resource efficient SME companies entirely run on renewable energy sources that would be
able to compete with the larger companies hindered by fossil fuel commitments and restoring the
natural balance to the economy unfairly removed by monopolistic practices. Though ongoing supply
chain fossil fuel use of by manufacturers of renewable energy generating plant or suppliers of this
energy would make it unlikely that 100% renewable energy could be achieved and this needs to be
reflected in the calculation of Rw.
12. Page 12 of 15
Remanufacturing
Economically this plan would encourage the production of goods made mainly or almost entirely
from recycled materials. It is unlikely even in such circumstances that that the recycling rate – or
reuse of recycled material - would be 100%. The available recycled material would be limited by the
maximum levels at which virgin producers would be able to utilise recyclable materials (this would
be mandatory) and maintain the necessary quality of material required to fulfil the product function
and purpose. Products with 100% virgin material might still be manufactured but only for products
such as those regulated under necessary and strict health or hygiene standards.
It is estimated that the remanufacturing market may represent about 20 to 40% of the recyclable
waste stream, though much of this will be made up of mixed or composite materials that is likely to
be used for example in novel construction, engineering or furniture product designs based on my
practical experience in assessing new businesses utilising wastes for a sovereign fund in Abu Dhabi
(2009-2011).
Public procurement and planning
The costs raised by this charge will be used to develop and fund a public sector/ private network of
waste remanufacturing, recovery and recycling networks and disposal costs. This charge could
replace landfill tax and other charges made under producer responsibility and other related schemes
Non-domestic waste producers would still have to pay final treatment and disposal costs. However
Governments may view this a means of circulating money from the private sector back into public
finances, so after provisional investment in the necessary treatment and remanufacturing
infrastructure, the money could be used to address fiscal borrowing and deficits.
All necessary remanufacturing, recycling, treatment and disposal schemes would be funded by the
public sector from the Virgin Material Charge with the private sector procuring equity and a share of
profits generated from remanufacturing and recycling schemes. Figure 4 shows an illustration of
how public sector procurement programme incorporating such arrangements could be designed to
drive and support the necessary investment for the new remanufacturing and recycling facilities.
13. Page 13 of 15
This procurement model that was first proposed in 2012 to a country in the Middle East as of part of
a plan to recover 100% of the procurement costs, maintenance and operational costs for the
Government over a 25 year period.
In this model, essential waste treatment processes would cover currently unviable but necessary
waste segregation, separation and treatment to achieve quality criteria for return wastes as raw
materials to manufacturers and remanufacturers. Residual wastes from these essential processes
would supply value added remanufacturing processes utilising mixed or low quality recyclables.
All producers under this plan would have a legal duty to plan and design manufacturing processes
(and product) with sufficient capacity to utilise supply chain product waste generated as it is
technically viable to do so and to contribute (possibly as private equity) to waste recovery ventures
to cover any deficiencies. Thus manufacturers would become more proactive in the recycling and
recovery of wastes and provide the impetus or market driver to ensure that virgin material
production and usage would only be based on absolute need.
This would require considerable liaison and co-ordination with raw material and virgin material
suppliers and would certainly lead to a reduction in quantities of virgin material extracted, processed
and used for this purpose. A beneficial impact would be to reduce stress on virgin raw material
supply chains in periods of growth.
The likely impact without taking into account impacts of these measures would be increase in
product prices up to say 25%. However, raw material consumption may drop by a similar amount
effectively reducing the amount of unnecessary or surplus virgin materials in the supply chain with a
net impact of reducing this increase to 10% to 15% with market softening measures adding to this
decrease in any transition period. Further given warning of such action manufacturers would look at
increasing their renewable energy contribution of their supply chains and seek to maximise
reductions in fossil fuel sourced fuel and power to gain market advantage (as discussed above).
In the development of remanufacturing processes there may be further energy savings through
technological interventions to be gained from the reductions in energy used in remanufacturing. The
energy available for remanufacturing ∆EErm is shown by equation (7)
EEwt - EErmt = ∆EErm (7)
Possibly there could be tax incentives or disincentives provided to remanufacturing activities at an
appropriate level to reflect suitable levels of market penetration, renewable energy utilised, any
losses of quality and of course any use of virgin materials. This fiscal intervention could provide a
mechanism to further reduce the increased cost impact on consumers.
So overall whilst initially there may be a rise in product costs and inflation, once established the
impacts of such a change will reap socio economic and environmental benefits that can only be
dreamed of. By providing an appropriate implementation timetable with transition periods to
Member States, the plan could be phased in over a period of 5 to 10 years (being fully implemented
by 2030).
Any implementation of such a programme would require studies to verify costs, prices and market
reaction, so that safeguards to consumers can be put in place with a possible soft market measures
(discussed above) and a phased transition period being used to alleviate problems that may arise.
14. Page 14 of 15
Investment in remanufacturing
In terms of an investment fund based on 611 million tonnes (EU28, 2010) of waste from other
economic activities and household sources, the virgin material charge could initially raise after
recovering existing costs for existing taxes (landfill, producer responsibility, etc.) recycling, treatment
and disposal about €150billion per annum across Europe for investment in new remanufacturing. In
the UK this could generate about €25+ billion per annum for investment (estimate €15 billion for
MSW only). Whilst this income will gradually reduce with time as raw material reduction, renewable
and energy efficiency schemes gain momentum, equity funding from other private sectors sources
could match this sum (up to €150 billion) increasing the rate of divestment from equity investors
such as sovereign funds and oil and gas companies - winding down their operations, focusing their
investments away from their core business and reallocating staff.
Further it is expected that the structure of the procurement proposed above incorporating joint
venture arrangements will recover most of the investment by Governments in the new treatment
and recycling infrastructure over a 25 to 30 year period.
This might herald some merger activity with major waste management players exercising ongoing
management and control over waste arisings. The scale of the intervention makes this the
equivalent in the UK of more than one Crossrail or High Speed Rail project every year for at least the
first 10 years. That level of investment will fuel significant economic growth and a mechanism for
consolidation for raw material extractors and producers.
There are plenty of remanufacturing opportunities out there. I remember being in Abu Dhabi
assessing great new business ideas utilising waste for a Sovereign fund in the period 2009 to 2011. It
is for the market to identify and design suitable products for remanufacture and coordinate the
needs and obligations that will arise from this proposed intervention with the innovators of these
new technologies. Governments need to do what they are supposed to do and provide the socio
economic frameworks to smooth this significant intervention that will change everything their
populations are used to. Get this right and the world will start to address its greatest challenge.
In this plan there will be created something similar to the Global Marshall Plan proposed in an article
by Naomi Klein - bit.ly/EnnjKc, #keepitinthe ground, #divest
Global dissemination
Ideally this should be implemented in full coordination with a global treaty involving the EU, North
America, China and Russia as a minimum and coordinated through GAT negotiations to eliminate
any bias of subsidy arguments or import levies that may arise. The benefits to all countries including
the USA. Russia and China is in having a market mechanism to start to reign in fiscal borrowing and
deficits. I am sure most other countries in the world would follow a multilateral lead by such parties.
References:
(1) Edward O. Wilson. The Future of Life, Alfred A. Knopf, 2002, ISBN: 0679450785, 9780679450788
(2) Donella H. Meadows, Gary. Meadows, Jorgen Randers, and William W. Behrens III. (1972).
The Limits to Growth. New York: Universe Books. ISBN 0-87663-165-0
(3) United Nations, Department of Economic and Social Affairs, Population Division (2011). World
Population Prospects: The 2010 Revision, Volume II: Demographic Profiles. ST/ESA/SER.A/317. at
http://esa.un.org/wpp/Documentation/WPP%202010%20publications.htm
(4) Chart from data at: Sato, R., (2012): Forcings in GISS Climate Model, Goddard Institute for Space
Studies, published at http://data.giss.nasa.gov/modelforce/,
http://data.giss.nasa.gov/modelforce/ghgases/Fig1A.ext.txt. (Last Modified 19/12/2012), and US
15. Page 15 of 15
Department of Commerce (2015): Data at
http://www.census.gov/population/international/data/worldpop/table_population.php
(5) Climate Change Act, Chapter 27. The Stationery Office Limited, HMSO, UK
(6) Myles R. A. et al., (2014); IPCC Fifth Assessment Report, Climate change Synthesis report, Longer
Report, IPCC at http://ipcc.ch/pdf/assessment-report/ar5/syr/SYR_AR5_LONGERREPORT.pdf
accessed and saved 3/11/2014
(7) Sato, R., (2012): Forcings in GISS Climate Model, Goddard Institute for Space Studies, published at
http://data.giss.nasa.gov/modelforce/, http://data.giss.nasa.gov/modelforce/ghgases/Fig1A.ext.txt.
(Last Modified 19/12/2012).
(8) Dumble, P., (2015): Reversing Climate Change – a Plan, at
https://www.linkedin.com/today/post/article/reversing-climate-change-plan-paul-
dumble?trk=prof-post (posted 18/2/2015)
(9) Greenhouse gas inventory for Abu Dhabi Emirate, Inventory results Executive Summary December
2012, Environment Agency - Abu Dhabi, at www.ead.ae/wp-content/.../03/AD-Greenhouse-gas-
inventory-Eng.pdf accessed 17/3/2012.