The sustainability of trading profits has always been questioned. Volatility has returned to pre-crisis levels and, absent more disruption, the size of the opportunity will shrink.
See this week's edition of EY Price Point
1. The week in review
Price Point Weekly
Global oil and gas market update
17 August 2020
Andy Brogan
EY Global Oil & Gas Leader
+44 20 7951 7009
abrogan@uk.ey.com
Derek Leith
EY Global Oil & Gas
Tax Leader
+44 12 2465 3246
dleith@uk.ey.com
John Hartung
EY Americas Oil & Gas
SaT Leader
+1 713 751 2114
john.hartung@parthenon.com
Jeff Williams
EY Global Oil & Gas
Advisory Leader
+1 713 750 5916
jeff.williams@ey.com
Gary Donald
EY Global Oil & Gas
Assurance Leader
+44 20 7951 7518
gdonald@uk.ey.com
The week ahead
For the most part, the market has sifted through the aftermath of Q2 and companies have reconciled their balance sheets to the potential long-term impacts of
the COVID-19 pandemic and energy transition. Attention will focus now on the standard questions about demand restoration, production, storage balance,
refinery utilization and other matters tied to supply-demand balance. LNG demand and natural gas production will be of particular interest. Hot weather has
already shown the potential to move the markets. OPEC members’ compliance with production agreements, stable US production and steadily increasing refinery
utilization are positive signs, but the markets have yet to see past the horizon to a point where inventories return to normal and the markets reckon with the
fallout from the crash in upstream investment.
This was a week of continued stability, with even strength in oil and gas commodity markets. Despite the spread of COVID-
19 in the US and Latin America (stable, but at 150,000 new cases per day), traders seem confident in economic recovery
and energy demand restoration. Oil prices barely moved. In some circles, speculation is growing that underinvestment
upstream could lead to tight supplies and price spikes once the inventories built in the early stages of the crisis have
cleared. Henry Hub natural gas built on the strength of last week’s remarkable run. September gas future prices are now
13% higher than early March and 39% higher than late June, when the full impact of the collapse in global LNG trade was
being felt. The rise in gas prices comes as US gas storage continues to build at above average rates. Last week, injections
totaled 58 BCF compared with a five-year average of 44 BCF and a year-ago injection of 51 BCF. Apparently, the market
sees signs of hope in the decline in LNG cargo cancellations, the recent heat wave in the US, and increases in power
demand around the world. In the intermediate term, it is inevitable that reduced drilling in oil-focused shale basins will
impact associated gas production. According to the EIA Drilling Productivity report, about 30% of shale gas production
comes from oil-focused regions where production from a typical well falls by 40% in a year and the number of working rigs
has fallen by 70% since March.
Commodities
Oil 1%
Natural Gas 7%
Equities
IOC 1%
NA Independent 0%
Intl Independent 0%
OFS -1%
S&P 500 0%
5.1 9.1
25.1
59.6
16.4
8.8
-14.2
Jan Feb March April May June July
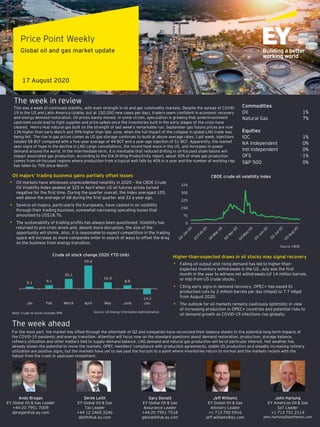
Crude oil stock change 2020 YTD (mb)
Source: US Energy Information Administration
Higher-than-expected draws in oil stocks may signal recovery
• Falling oil output and rising demand has led to higher-than-
expected inventory withdrawals in the US. July was the first
month in the year to witness net withdrawals (of 14 million barrels
or mb) from US crude stocks.
• Citing early signs in demand recovery, OPEC+ has eased its
production cuts by 2 million barrels per day (mbpd) to 7.7 mbpd
from August 2020.
• The outlook for oil markets remains cautiously optimistic in view
of increasing production in OPEC+ countries and potential risks to
oil demand growth as COVID-19 infections rise globally.Note: Crude oil stocks includes SPR
0
75
150
225
300
375
CBOE crude oil volatility index
Source: CBOE
Oil majors’ trading business gains partially offset losses
• Oil markets have witnessed unprecedented volatility in 2020 – the CBOE Crude
Oil Volatility Index peaked at 325 in April when US oil futures prices turned
negative for the first time. During the quarter overall, the index averaged 105,
well above the average of 68 during the first quarter and 33 a year ago.
• Several oil majors, particularly the Europeans, have cashed in on volatility
through their trading business, somewhat narrowing operating losses that
amounted to US$18.7b.
• The sustainability of trading profits has always been questioned. Volatility has
returned to pre-crisis levels and, absent more disruption, the size of the
opportunity will shrink. Also, it is reasonable to expect competition in the trading
space will increase as more companies enter in search of ways to offset the drag
on the business from energy transition.