How to analyze java garbage collection logs using gc viewer
•
3 gefällt mir•1,744 views

In this tutorial we will explore how we can generate Java garbage collection logs. Then we will examine how we can use GCViewer to analyze the garbage collection logs. First we will introduce the graphical method of examining the logs, and later we will explore how we can use command line to generate the report as a csv file.

Empfohlen
Empfohlen
Weitere ähnliche Inhalte
Kürzlich hochgeladen
Kürzlich hochgeladen (20)
Empfohlen
Empfohlen (20)
How to analyze java garbage collection logs using gc viewer
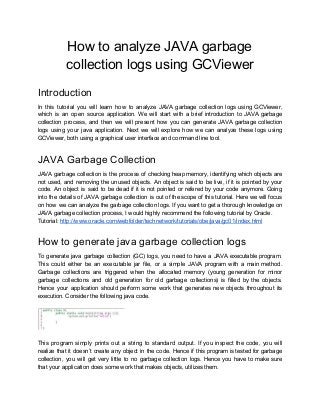
- 1. How to analyze JAVA garbage collection logs using GCViewer Introduction In this tutorial you will learn how to analyze JAVA garbage collection logs using GCViewer, which is an open source application. We will start with a brief introduction to JAVA garbage collection process, and then we will present how you can generate JAVA garbage collection logs using your java application. Next we will explore how we can analyze these logs using GCViewer, both using a graphical user interface and command line tool. JAVA Garbage Collection JAVA garbage collection is the process of checking heap memory, identifying which objects are not used, and removing the unused objects. An object is said to be live, if it is pointed by your code. An object is said to be dead if it is not pointed or refered by your code anymore. Going into the details of JAVA garbage collection is out of the scope of this tutorial. Here we will focus on how we can analyze the garbage collection logs. If you want to get a thorough knowledge on JAVA garbage collection process, I would highly recommend the following tutorial by Oracle. Tutorial: http://www.oracle.com/webfolder/technetwork/tutorials/obe/java/gc01/index.html How to generate java garbage collection logs To generate java garbage collection (GC) logs, you need to have a JAVA executable program. This could either be an executable jar file, or a simple JAVA program with a main method. Garbage collections are triggered when the allocated memory (young generation for minor garbage collections and old generation for old garbage collections) is filled by the objects. Hence your application should perform some work that generates new objects throughout its execution. Consider the following java code. This program simply prints out a string to standard output. If you inspect the code, you will realize that it doesn’t create any object in the code. Hence if this program is tested for garbage collection, you will get very little to no garbage collection logs. Hence you have to make sure that your application does some work that makes objects, utilizes them.
- 2. If you plan to use a server application, then you have to send requests to that server either manually (which is not recommended), or using Jmeter. Following tutorial will give an insight on how to setup a server with a Jmeter sending requests in a periodic manner. Tutorial: https://www.slideshare.net/PasinduTennage/how-to-automate-jmeter-performance-tests Alright. Now we have an executable program or a jar file. JAVA has the option of setting the heap size of JAVA virtual machine. This heap size determines how much memory is allocated for the JAVA program. So you might question; what is the impact of heap size? Well. If you make the heap size small, your memory will be filled very quickly, which will trigger many number of GC logs. Since we are going to analyze GC logs, it is better if we have many number of such events. For this test, we will use a heap size of 100m. If your application crashes by giving out of memory exception, increase the memory to a higher value. Assume you have a JAVA file with the name MyProgram.java. Run: /jdk-path/bin/java -Xms100m -Xmx100m -Xloggc:/path/to/log/GCLog.txt -verbose:gc -XX:+PrintGCDateStamps -XX:+GARBAGE_COLLECTOR /path/program/MyProgram.java If you have an executable jar file with the name MyJAR.jar Run: /jdk-path//bin/java -Xloggc:/path/to/log/GCLog.txt -verbose:gc -XX:+PrintGCDateStamps -XX:+GARBAGE_COLLECTOR -Xms100m -Xmx100m -jar /path/to/jar/MyJAR.jar You can use different values for GARBAGE_COLLECTOR depending on the garbage collector you are planning to use. Some examples are; 1. UseSerialGC 2. UseG1GC 3. UseParallelGC 4. UseConcMarkSweepGC Run the program for few minutes. Make sure that you send requests to the server if it is a web application. After few minutes terminate the application. Now you should see a file named GClogs.txt in the path you specified. If you don’t see such file, then your application does not generate enough objects to fill the allocated memory. In that case rerun the application for a long time and send more requests if it is a server application.
- 3. Generated GC log file should have the following format. Note that the actual format may vary depending on the type of collector you used. GCViewer GCViewer is an open source product which is used to analyze the GCLogs. It can be used either in command line or GUI. In this tutorial I will show you both approaches. Clone or download (https://github.com/PasinduTennage/GCViewer.git) and run “mvn clean install” in the develop branch. An executable jar file will be generated in /target directory. Run “java -jar gcviewer-1.36-SNAPSHOT.jar”. If the build is successful, following window should appear.
- 4. How to analyze report using GUI mode Click File > Open File Choose GCLog.txt The output window should be similar to following. Ya hoooo!!! Now you can see the summary of your GC report. There are several results shown in this window under three different tabs; Summary, memory, pause. Since the result are self explanatory, I will describe only the most important ones here. Summary Tab Total heap: Total heap allocated for JVM Accumulated pauses: Time spent for all the minor GCs Throughput: Ratio of time spent for actual program execution to time spent for GC. Higher the value of this parameter, better the performance of the application.
- 5. Pause Tab Min/Max pause: Minimum pause (usually a minor GC) and the maximum pause. Accumulated full GC: Total time spent for major garbage collections How to analyze report using command line Now let’s look how we can get these results in the form of a csv file, which we can use for analysis. Open a command prompt and type java -jar path/to/gcviewer-1.36-SNAPSHOT.jar path/to/GCLog.txt /path/to/output.csv The output should be similar to this. Now the generated csv file should look like this.
- 6. Conclusion In this tutorial we explored how we can generate Java garbage collection logs. Then we examined how we can use GCViewer to analyze the garbage collection logs. First we introduced the graphical method of examining the logs, and later we explored how we can use command line to generate the report as a csv file.