
Empfohlen
Weitere ähnliche Inhalte
Was ist angesagt?
Was ist angesagt? (20)
Ähnlich wie Balance sheet projection
Ähnlich wie Balance sheet projection (20)
Kürzlich hochgeladen
Kürzlich hochgeladen (20)
Balance sheet projection
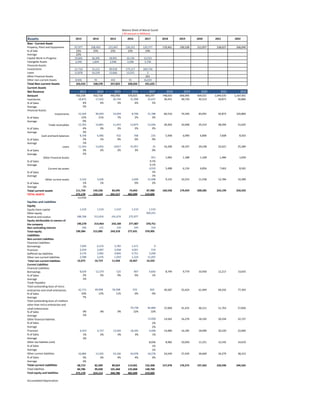
- 1. Balance Sheet of Maruti Suzuki ( All amount in Millions) Assets 2013 2014 2015 2016 2017 2018 2019 2020 2021 2022 Non - Current Asset Property, Plant and Equipmemt 97,977 108,493 121,947 126,251 129,377 170,461 190,528 212,957 238,027 266,049 % of Sale 23% 25% 25% 22% 19% Average 23% Capital Work-in-Progress 19,665 26,395 18,901 10,134 12,523 Intangible Assets 2,240 1,844 2,948 3,508 3,730 Financial Assets: Investments 21,710 15,212 99,918 175,117 269,718 Loans 12,878 16,539 13,666 13,555 3 Other Financial Assets 241 Other non-current Assets 8,946 95 442 91 16,033 Total Non-current Assets 163,416 168,578 257,822 328,656 431,625 Current Assets Net Revenue 2013 2014 2015 2016 2017 2018 2019 2020 2021 2022 Amount 432,159 432,718 492,950 570,615 669,247 748,033 836,093 934,521 1,044,535 1,167,501 Inventories 18,872 17,632 26,744 31,998 32,637 36,431 40,720 45,513 50,871 56,860 % of Sales 4% 4% 5% 6% 5% Average 5% Financial Assets: Investments 52,504 90,059 33,059 8,748 21,788 66,510 74,340 83,091 92,873 103,806 % of Sales 12% 21% 7% 2% 3% Average 9% Trade receivables 15,355 14,891 11,443 13,873 12,026 20,263 22,648 25,314 28,294 31,625 % of Sales 4% 3% 2% 2% 2% Average 3% Cash and bank balances 8,148 6,486 432 768 235 5,448 6,090 6,806 7,608 8,503 % of Sales 2% 1% 0% 0% 0% Average 1% Loans 11,343 12,832 12017 15,957 25 16,200 18,107 20,238 22,621 25,284 % of Sales 3% 3% 2% 3% 0% Average 2% Other Financial Assets 951 1,063 1,188 1,328 1,484 1,659 % of Sales 0.1% Average 0.1% Current tax assets 4,910 5,488 6,134 6,856 7,663 8,565 % of Sales 1% Average 1% Other current assets 5,532 3,636 2,699 15,408 9,155 10,233 11,438 12,784 14,289 % of Sales 1% 1% 0% 2% Average 1% Total current assets 111,754 145,536 83,695 74,043 87,980 160,558 179,459 200,585 224,199 250,592 TOTAL ASSETS 275,170 314,114 341,517 402,699 519,605 111754 Equities and Liabilities Equity Equity share capital 1,510 1,510 1,510 1,510 1,510 Other equity 369,241 Reserve and surplus 188,768 213,454 241,674 275,977 Equity attributable to owners of the company 190,278 214,964 243,184 277,487 370,751 Non controlling interest 106 121 134 144 154 Total equity 190,384 215,085 243,318 277,631 370,905 Liabilities Non-current Liabilities Financial Liabilities: Borrowings 7,049 6,274 2,783 1,471 0 Provision 2,259 2,007 2,958 3,021 219 Deffered tax liabilities 4,176 5,962 4,844 4,751 5,058 Other non-current liabilities 2,588 2,476 1,059 1,224 11,055 Total non-current liabilities 16,072 16,719 11,644 10,467 16,332 Current Liabilities Financial Liabilities Borrowings 8,639 12,379 525 907 4,836 8,749 9,779 10,930 12,217 13,655 % of Sales 2% 3% 0% 0% 1% Average 1% Trade Payables: Total outstanding dues of micro enterprises and small enterprises 42,772 49,998 56,568 533 832 49,587 55,424 61,949 69,242 77,393 % of Sales 10% 12% 11% 0% 0% Average 7% Total outstanding dues of creditors other than micro enterprises and small enterprsises 70,738 82,860 37,069 41,433 46,311 51,763 57,856 % of Sales 0% 0% 0% 12% 12% Average 5% Other financial liabiities 13,028 14,562 16,276 18,192 20,334 22,727 % of Sales 2% Average 2% Provision 6,419 6,727 13,565 18,345 4,498 14,480 16,185 18,090 20,220 22,600 % of Sales 1% 2% 3% 3% 1% Average 2% Other tax liabilites (net) 8,036 8,982 10,039 11,221 12,542 14,019 % of Sales 1% Average 1% Other current liabilities 10,884 13,205 19,166 24,078 18,278 24,549 27,439 30,669 34,279 38,315 % of Sales 3% 3% 4% 4% 3% Average 3% Total current Liabilities 68,714 82,309 89,824 114,601 132,368 157,978 176,575 197,362 220,596 246,565 Total liabilities 84,786 99,028 101,468 125,068 148,700 Total equity and liabilities 275,170 314,113 344,786 402,699 519,605 Accumalated Depreciation