
![Subject
Property
National Mall and
Monumental Landmarks
Verizon Center/7th Street
Entertainment Corridor
Hines City Center
(Under Construction)
Federal Triangle/Trump’s Post
Office Hotel (Planned)
Union
Station
Introduction Site Context Project Overview Financing Strategy Return Analysis Conclusion
[Site Location and Surrounding Uses]](data:image/gif;base64,R0lGODlhAQABAIAAAAAAAP///yH5BAEAAAAALAAAAAABAAEAAAIBRAA7)
Empfohlen
Empfohlen
Weitere ähnliche Inhalte
Ähnlich wie MIT Competition PPT
Ähnlich wie MIT Competition PPT (20)
Kürzlich hochgeladen
Kürzlich hochgeladen (20)
MIT Competition PPT
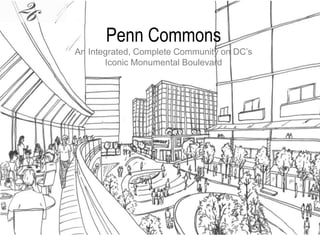
- 1. Penn Commons An Integrated, Complete Community on DC’s Iconic Monumental Boulevard
- 2. Subject Property National Mall and Monumental Landmarks Verizon Center/7th Street Entertainment Corridor Hines City Center (Under Construction) Federal Triangle/Trump’s Post Office Hotel (Planned) Union Station Introduction Site Context Project Overview Financing Strategy Return Analysis Conclusion [Site Location and Surrounding Uses]
- 3. Introduction Site Context Project Overview Financing Strategy Return Analysis Conclusion 0 1 2 3 4 5 6 7 8 2013 Q1 2013 Q2 2013 Q3 2013 Q4 2014 Q1 2014 Q2 Space Scheduled to be Available (Million SF) OFFICEHOTEL MULTIFAMILY RETAIL Class A Ground-Up Office is rare in downtown DC, especially east of the White House The nearest grocery store serving the community is a 22 minute walk away Emerging micro-unit concept highly desired by young professionals Demand for hotel space on the National Mall remains strong 200 250 300 350 2010 2011 2012 2013 2014 2015 Average Daily Rate (Historical and Projected) 4% 5% 5% 6% 6% 7% 7% 8% 8% 9% 9% Vacancy in Downtown DC 0 1000 2000 3000 4000 5000 6000 7000 8000 2011 2012 2013 2014 2015 2016 Change in Supply vs. Change in Demand
- 4. Introduction Site Context Project Overview Financing Strategy Return Analysis Conclusion Link Downtown with the National Mall Create a Vibrant Mixed Use Development, Particularly Supplying Additional Housing in the Downtown DC Area Enhance Public Space and Pedestrian Walkability by Reducing Block Scale Construct D Street, the Paper Street Running East to West Provide a Commemorative Public Space [Master Plan Recommendations]
- 5. Introduction Site Context Project Overview Financing Strategy Return Analysis Conclusion [Proposal] Residential Multifamily (Including Micro-Units) Signature Office Space Hotel in Prime DC Location
- 6. Introduction Site Context Project Overview Financing Strategy Return Analysis Conclusion [Project Connectivity] Retail Connections Programmed Public Space Connections
- 7. Introduction Site Context Project Overview Financing Strategy Return Analysis Conclusion Northern Anchor – Grocery Store Draws Locals Southern Anchor – Hoover Tower Draws Tourists D Street Pedestrian Street Archway Design Allows 160 Foot Height Public Space Allows for Seasonal Events Capital Bikeshare Station Near Metro Use of Crowdsourcing for Small Retail [Big Ideas]
- 8. Introduction Site Context Project Overview Financing Strategy Return Analysis Conclusion Micro-Units 135,108 Sq Ft 359 Units 328 Market 31 Affordable Units Multifamily 699,676 Sq Ft 879 Units 805Market 74 Affordable Units Hotel 214,291 Sq Ft 225 Keys 20,495 Sq Ft Meeting Space Office 672,937 Sq Ft Retail 147,885 Sq Ft 1,796,841 Total Sq Ft [Stacking Plan]
- 9. [Entitlements Strategy] Existing Zoning Proposed Zoning C-4/DD D-6-B-1 10.0 FAR (Min 2.0 FAR Residential) 8.5 Nonresidential FAR; No Cap on Residential 10% Affordable Housing Set-Aside 8% Affordable Housing Set-Aside 160 ft/110 ft Heights 160 ft/110 ft Heights Parking: 1 per 4 Resi DUs 1 per 1,800 Office sf 1 per 8 Hotel Keys 1 per 3,000 Retail sf (25% Reduction Due to Metro Proximity) No Minimum Parking Requirements Introduction Site Context Project Overview Financing Strategy Return Analysis Conclusion Strategy: Seek entitlements just before FBI vacates space. Proposed DC Zoning Regulations should be adopted and will provide beneficial requirements (No parking, higher FAR, lower set- aside)
- 10. 2013 2014 2015 2016 2017 2018 2019 2020 2021 2022 2023 Q 1 Q 2 Q 3 Q 4 Q 1 Q 2 Q 3 Q 4 Q 1 Q 2 Q 3 Q 4 Q 1 Q 2 Q 3 Q 4 Q 1 Q 2 Q 3 Q 4 Q 1 Q 2 Q 3 Q 4 Q 1 Q 2 Q 3 Q 4 Q 1 Q 2 Q 3 Q 4 Q 1 Q 2 Q 3 Q 4 Q 1 Q 2 Q 3 Q 4 Q 1 Q 2 Q 3 Q 4 [Project Schedule] Equity Raise Buy Lease Existing Building to FBI Begin Architecture and Engineering Feasibility Secure Debt Lease Office, Retail, Residential; Secure Hotel Flag and Operator, Crowdsourcing Demolition and Construction Open and Stable Sale Entitlements Introduction Site Context Project Overview Financing Strategy Return Analysis Conclusion
- 11. Introduction Site Context Project Overview Financing Strategy Return Analysis Conclusion 1. Team 26 will serve as developer and will provide 10 percent of the equity 2. Partner with a sovereign wealth fund or pension fund to provide the remaining 90 percent of the equity 3. Together, we will seek debt financing commitment of 65percent of total project costs at a 5.5 percent interest rate [Deal Structure]
- 12. [Development Costs] Introduction Site Context Project Overview Financing Strategy Return Analysis Conclusion
- 13. Introduction Site Context Project Overview Financing Strategy Return Analysis Conclusion Project Cash Flowlow and Sensitivity Analysis [Cash Flow] Summary of Project Cash flow Year 1 Year 2 Year 3 Year 4 Year 5 Year 6 Year 7 Year 8 Year 9 Year 10 2014 2015 2016 2017 2018 2019 2020 2021 2022 2023 Acquisition Price -$110,000,000 Development Cost (Less Rent) -$40,619,644 -$17,450,447 -$33,117,411 -$148,836,162 -$274,171,877 -$141,002,680 Building 1 $2,020,294 $5,782,963 $5,931,758 $6,084,401 Building 2 -$4,246,515 $5,789,818 $11,979,182 $12,412,309 Building 3 -$14,175,231 $11,354,178 $17,031,035 $20,128,966 Building 4 $1,632,259 $19,842,620 $24,377,859 $24,996,684 Building 4 Hotel $11,085,868 $11,929,736 $12,399,268 $13,175,747 Reversion (less cost of sale) $1,280,263,964 NCF -$150,619,644 -$17,450,447 -$33,117,411 -$148,836,162 -$274,171,877 -$141,002,680 -$3,683,325 $54,699,315 $71,719,102 $1,357,062,070 NPV $697,460,960 IRR 11.6% Owner Cash Flow Year 1 Year 2 Year 3 Year 4 Year 5 Year 6 Year 7 Year 8 Year 9 Year 10 2014 2015 2016 2017 2018 2019 2020 2021 2022 2023 Acquisition Price -$110,000,000 Development Cost (Less Rent) -$40,619,644 -$17,450,447 -$33,117,411 -$72,984,375 $0 $0 Building 1 $2,020,294 $5,782,963 $5,931,758 $6,084,401 Building 2 -$4,246,515 $5,789,818 $11,979,182 $12,412,309 Building 3 -$14,175,231 $11,354,178 $17,031,035 $20,128,966 Building 4 $1,632,259 $19,842,620 $24,377,859 $24,996,684 Building 4 Hotel $11,085,868 $11,929,736 $12,399,268 $13,175,747 Debt Service -$29,848,493 -$29,848,493 -$29,848,493 -$29,848,493 Mortgage Repayment -$519,104,233 Reversion $1,280,263,964 NCF -$150,619,644 -$17,450,447 -$33,117,411 -$72,984,375 $0 $0 -$33,531,819 $24,850,821 $41,870,609 $808,109,343 NPV $555,460,257 IRR 15.0%
- 14. Introduction Site Context Project Overview Financing Strategy Return Analysis Conclusion [Returns and Waterfall]
- 15. Penn Commons An Integrated, Complete Community on DC’s Iconic Monumental Boulevard Introduction Site Context Project Overview Financing Strategy Return Analysis Conclusion