Call girls In Rana Pratap Bagh {Delhi ↫8447779280↬Escort Service (Delhi)
March 2013 Housing Sales Statistics
1. March 2013
Area Delimited by Entire OK State MLS -
Single-Family Property Type
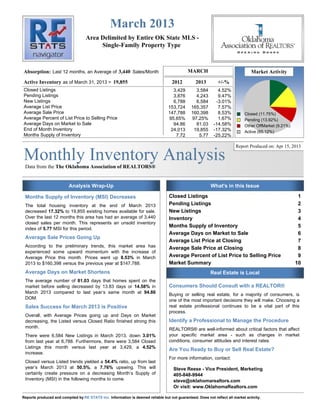
Absorption: Last 12 months, an Average of 3,440 Sales/Month MARCH Market Activity
Active Inventory as of March 31, 2013 = 19,855 2012 2013 +/-%
Closed Listings 3,429 3,584 4.52%
Pending Listings 3,876 4,243 9.47%
New Listings 6,788 6,584 -3.01%
Average List Price 153,724 165,357 7.57%
Average Sale Price 147,788 160,398 8.53% Closed (11.75%)
Average Percent of List Price to Selling Price 95.65% 97.25% 1.67% Pending (13.92%)
Average Days on Market to Sale 94.86 81.03 -14.58% Other OffMarket (9.21%)
End of Month Inventory 24,013 19,855 -17.32% Active (65.12%)
Months Supply of Inventory 7.72 5.77 -25.22%
Report Produced on: Apr 15, 2013
Monthly Inventory Analysis
Data from the The Oklahoma Association of REALTORS®
Analysis Wrap-Up What's in this Issue
Months Supply of Inventory (MSI) Decreases Closed Listings 1
The total housing inventory at the end of March 2013 Pending Listings 2
decreased 17.32% to 19,855 existing homes available for sale. New Listings 3
Over the last 12 months this area has had an average of 3,440 Inventory 4
closed sales per month. This represents an unsold inventory
Months Supply of Inventory 5
index of 5.77 MSI for this period.
Average Days on Market to Sale 6
Average Sale Prices Going Up
Average List Price at Closing 7
According to the preliminary trends, this market area has Average Sale Price at Closing 8
experienced some upward momentum with the increase of
Average Price this month. Prices went up 8.53% in March Average Percent of List Price to Selling Price 9
2013 to $160,398 versus the previous year at $147,788. Market Summary 10
Average Days on Market Shortens Real Estate is Local
The average number of 81.03 days that homes spent on the
market before selling decreased by 13.83 days or 14.58% in Consumers Should Consult with a REALTOR®
March 2013 compared to last year’s same month at 94.86 Buying or selling real estate, for a majority of consumers, is
DOM. one of the most important decisions they will make. Choosing a
Sales Success for March 2013 is Positive real estate professional continues to be a vital part of this
process.
Overall, with Average Prices going up and Days on Market
decreasing, the Listed versus Closed Ratio finished strong this Identify a Professional to Manage the Procedure
month. REALTORS® are well-informed about critical factors that affect
There were 6,584 New Listings in March 2013, down 3.01% your specific market area - such as changes in market
from last year at 6,788. Furthermore, there were 3,584 Closed conditions, consumer attitudes and interest rates.
Listings this month versus last year at 3,429, a 4.52%
Are You Ready to Buy or Sell Real Estate?
increase.
For more information, contact:
Closed versus Listed trends yielded a 54.4% ratio, up from last
year’s March 2013 at 50.5%, a 7.76% upswing. This will Steve Reese - Vice President, Marketing
certainly create pressure on a decreasing Month’s Supply of 405-848-9944
Inventory (MSI) in the following months to come. steve@oklahomarealtors.com
Or visit: www.OklahomaRealtors.com
Reports produced and compiled by RE STATS Inc. Information is deemed reliable but not guaranteed. Does not reflect all market activity.
2. Monthly Inventory Analysis
Data from the The Oklahoma Association of
REALTORS®
March 2013
Closed Sales as of Apr 12, 2013
Closed Listings Report Produced on: Apr 15, 2013
Area Delimited by Entire OK State MLS - Single-Family Property Type
MARCH YEAR TO DATE (YTD)
2009 2010 2011 2012 2013 2009 2010 2011 2012 2013
3,429 3,584 8,480 8,801
3,332
3,068 7,349 7,262
2,812 6,942
1 Year 1 Year
+4.52% +3.79%
2 Year 2 Year
+27.45% +26.78%
5 YEAR MARKET ACTIVITY TRENDS 5yr MAR AVG = 3,245 3 MONTHS
5,000 High J 2,497
Jul 2009 = 4,128 A
4,000
Low N
3,000 Jan 2010 = 1,728 F 2,720
E
Closed Listings
2,000 Closed Listings
this B 8.93%
1,000 month at 3,584,
above the 5 yr MAR M 3,584
A
0
Jun 2009 Dec 2009 Jun 2010 Dec 2010 Jun 2011 Dec 2011 Jun 2012 Dec 2012 average of 3,245 R 31.76%
CLOSED LISTINGS & BEDROOMS DISTRIBUTION BY PRICE
Distribution of Closed Listings by Price Range % AVDOM 2 Beds 3 Beds 4 Beds 5 Beds+
$25,000
and less 149 4.16% 80.8 79 59 9 2
$25,001
$75,000 636 17.75% 85.9 180 392 58 6
$75,001
$100,000 396 11.05% 78.7 102 260 31 3
$100,001
Contact an experienced REALTOR
Ready to Buy or Sell Real Estate?
$150,000 902 25.17% 79.0 145 651 102 4
$150,001
$200,000 660 18.42% 79.8 102 364 183 11
$200,001
$275,000 460 12.83% 83.8 67 190 184 19
$275,001
and up 381 10.63% 78.9 30 85 222 44
Total Closed Units: 3,584 81.0 705 2001 789 89
Total Closed Volume: 574,865,244 84.05M 269.09M 188.52M 33.21M
Average Closed Price: $160,398 $119,216 $134,478 $238,930 $373,157
Reports produced and compiled by RE STATS Inc. Information is deemed reliable but not guaranteed. Does not reflect all market activity. pp. 1
Steve Reese 405-848-9944 steve@oklahomarealtors.com
3. Monthly Inventory Analysis
Data from the The Oklahoma Association of
REALTORS®
March 2013
Pending Listings as of Apr 12, 2013
Pending Listings Report Produced on: Apr 15, 2013
Area Delimited by Entire OK State MLS - Single-Family Property Type
MARCH YEAR TO DATE (YTD)
2009 2010 2011 2012 2013 2009 2010 2011 2012 2013
4,173 4,243 11,540
3,876 10,412
3,622 9,587
3,342 8,897 8,588
1 Year 1 Year
+9.47% +10.83%
2 Year 2 Year
+17.15% +34.37%
5 YEAR MARKET ACTIVITY TRENDS 5yr MAR AVG = 3,851 3 MONTHS
5,000 High J 3,511
Apr 2010 = 4,963 A
4,000
Low N
3,000 Dec 2009 = 2,048 F 3,786
E
Pending Listings
2,000 Pending Listingsthis B 7.83%
1,000 month at 4,243,
above the 5 yr MAR M 4,243
A
0
Jun 2009 Dec 2009 Jun 2010 Dec 2010 Jun 2011 Dec 2011 Jun 2012 Dec 2012 average of 3,851 R 12.07%
PENDING LISTINGS & BEDROOMS DISTRIBUTION BY PRICE
Distribution of Pending Listings by Price Range % AVDOM 2 Beds 3 Beds 4 Beds 5 Beds+
$25,000
and less 156 3.68% 60.9 64 78 11 3
$25,001
$75,000 663 15.63% 78.8 222 364 71 6
$75,001
$100,000 439 10.35% 88.6 98 297 43 1
$100,001
Contact an experienced REALTOR
Ready to Buy or Sell Real Estate?
$150,000 1,147 27.03% 68.2 176 827 138 6
$150,001
$200,000 809 19.07% 79.7 116 491 191 11
$200,001
$275,000 566 13.34% 71.6 59 229 255 23
$275,001
and up 463 10.91% 72.9 40 127 231 65
Total Pending Units: 4,243 81.7 775 2413 940 115
Total Pending Volume: 700,489,986 93.02M 340.58M 219.35M 47.54M
Average Listing Price: $161,251 $120,026 $141,144 $233,349 $413,416
Reports produced and compiled by RE STATS Inc. Information is deemed reliable but not guaranteed. Does not reflect all market activity. pp. 2
Steve Reese 405-848-9944 steve@oklahomarealtors.com
4. Monthly Inventory Analysis
Data from the The Oklahoma Association of
REALTORS®
March 2013
New Listings as of Apr 12, 2013
New Listings Report Produced on: Apr 15, 2013
Area Delimited by Entire OK State MLS - Single-Family Property Type
MARCH YEAR TO DATE (YTD)
2009 2010 2011 2012 2013 2009 2010 2011 2012 2013
7,638 18,666
7,042 18,116 18,048
6,788 6,584 17,000
6,030 16,522
1 Year 1 Year
-3.01% -3.31%
2 Year 2 Year
-6.50% +6.16%
5 YEAR MARKET ACTIVITY TRENDS 5yr MAR AVG = 6,816 3 MONTHS
8,000 High J 5,957
7,000 Apr 2010 = 7,848 A
6,000 Low N
5,000 Dec 2012 = 3,711 F 5,507
4,000 E
New Listings
3,000 New Listings this B -7.55%
2,000 month at 6,584,
1,000 below the 5 yr MAR M 6,584
A
0
Jun 2009 Dec 2009 Jun 2010 Dec 2010 Jun 2011 Dec 2011 Jun 2012 Dec 2012 average of 6,816 R 19.56%
NEW LISTINGS & BEDROOMS DISTRIBUTION BY PRICE
Distribution of New Listings by Price Range % 2 Beds 3 Beds 4 Beds 5 Beds+
$50,000
and less 574 8.72% 287 254 29 4
$50,001
$75,000 607 9.22% 234 324 45 4
$75,001
$100,000 715 10.86% 183 476 53 3
$100,001
Contact an experienced REALTOR
Ready to Buy or Sell Real Estate?
$175,000 2,223 33.76% 368 1,474 361 20
$175,001
$225,000 886 13.46% 122 447 296 21
$225,001
$325,000 887 13.47% 116 296 419 56
$325,001
and up 692 10.51% 72 151 339 130
Total New Listed Units: 6,584 1382 3422 1542 238
Total New Listed Volume: 1,250,417,394 194.17M 514.33M 412.87M 129.05M
Average New Listed Listing Price: $186,389 $140,502 $150,300 $267,748 $542,232
Reports produced and compiled by RE STATS Inc. Information is deemed reliable but not guaranteed. Does not reflect all market activity. pp. 3
Steve Reese 405-848-9944 steve@oklahomarealtors.com
5. Monthly Inventory Analysis
Data from the The Oklahoma Association of
REALTORS®
March 2013
Active Inventory as of Apr 12, 2013
Active Inventory Report Produced on: Apr 15, 2013
Area Delimited by Entire OK State MLS - Single-Family Property Type
END OF MARCH ACTIVE DURING MARCH
2009 2010 2011 2012 2013 2009 2010 2011 2012 2013
24,906 24,003 31,308 30,487
22,072 21,963 28,038 28,307
19,855 26,907
1 Year 1 Year
-17.28% -11.74%
2 Year 2 Year
-20.28% -14.06%
5 YEAR MARKET ACTIVITY TRENDS 5yr MAR AVG = 22,560 3 MONTHS
Active Inventory
30,000 High J 20,948
Jul 2011 = 27,596 A
Low N
20,000
Mar 2013 = 19,855 F 20,336
E
10,000
Inventory this B -2.92%
month at 19,855,
below the 5 yr MAR M 19,855
A
0
Jun 2009 Dec 2009 Jun 2010 Dec 2010 Jun 2011 Dec 2011 Jun 2012 Dec 2012 average of 22,560 R -2.37%
INVENTORY & BEDROOMS DISTRIBUTION BY PRICE
Distribution of Inventory by Price Range % AVDOM 2 Beds 3 Beds 4 Beds 5 Beds+
$50,000
and less 1,831 9.22% 132.6 1,005 721 96 9
$50,001
$75,000 2,080 10.48% 119.5 796 1,126 138 20
$75,001
$100,000 2,426 12.22% 114.9 677 1,492 239 18
$100,001
Contact an experienced REALTOR
Ready to Buy or Sell Real Estate?
$175,000 6,037 30.41% 104.8 1,222 3,801 936 78
$175,001
$225,000 2,432 12.25% 104.6 382 1,167 818 65
$225,001
$350,000 2,873 14.47% 105.1 424 977 1,271 201
$350,001
and up 2,176 10.96% 124.0 216 460 1,025 475
Total Active Inventory by Units: 19,855 112.3 4,722 9,744 4,523 866
Total Active Inventory by Volume: 3,973,907,483 641.80M 1.53B 1.29B 509.19M
Average Active Inventory Listing Price: $200,146 $135,916 $156,966 $285,970 $587,983
Reports produced and compiled by RE STATS Inc. Information is deemed reliable but not guaranteed. Does not reflect all market activity. pp. 4
Steve Reese 405-848-9944 steve@oklahomarealtors.com
6. Monthly Inventory Analysis
Data from the The Oklahoma Association of
REALTORS®
March 2013
Active Inventory as of Apr 12, 2013
Months Supply of Inventory Report Produced on: Apr 15, 2013
Area Delimited by Entire OK State MLS - Single-Family Property Type
MSI FOR MARCH INDICATORS FOR MARCH 2013
2009 2010 2011 2012 2013 Inventory Closed Absorption MSI MSI %
8.7 41,279
7.7 5.8 17.325%
6.7 6.8 19,855
5.8
1 Year 3,440
End of Closed Average Months Percent
-25.19% Month Last Closed per Supply Months
2 Year Active 12 Month over of Supply of
-33.41% Inventory Months 12 Months Inventory Inventory
5 YEAR MARKET ACTIVITY TRENDS 5yr MAR AVG = 7.1 3 MONTHS
10 High J 6.1
9 Jun 2011 = 9.9 A
8
Low N
7
6 Mar 2013 = 5.8 F 5.9
5 E
Months Supply
4 Months Supply this B -2.89%
3
2 month at 5.8,
1 below the 5 yr MAR M 5.8
A
0
Jun 2009 Dec 2009 Jun 2010 Dec 2010 Jun 2011 Dec 2011 Jun 2012 Dec 2012 average of 7.1 R -2.73%
MONTHS SUPPLY & BEDROOMS DISTRIBUTION BY PRICE
Distribution of Active Inventory by Price Range and MSI % MSI 2 Beds 3 Beds 4 Beds 5 Beds+
$50,000
and less 1,831 9.22% 4.2 5.5 3.3 3.2 2.4
$50,001
$80,000 2,645 13.32% 6.7 8.0 6.1 5.9 8.1
$80,001
$110,000 2,576 12.97% 5.6 6.5 5.2 6.5 6.6
$110,001
Contact an experienced REALTOR
Ready to Buy or Sell Real Estate?
$170,000 5,039 25.38% 4.9 5.8 4.6 4.8 8.6
$170,001
$240,000 3,272 16.48% 5.7 7.0 5.6 5.2 6.8
$240,001
$370,000 2,504 12.61% 6.7 8.5 7.2 5.8 7.9
$370,001
and up 1,988 10.01% 12.4 18.9 13.8 10.6 14.0
MSI: 5.8 6.7 5.2 5.9 9.7
Total Active Inventory: 19,855 4,722 9,744 4,523 866
Reports produced and compiled by RE STATS Inc. Information is deemed reliable but not guaranteed. Does not reflect all market activity. pp. 5
Steve Reese 405-848-9944 steve@oklahomarealtors.com
7. Monthly Inventory Analysis
Data from the The Oklahoma Association of
REALTORS®
March 2013
Closed Sales as of Apr 12, 2013
Average Days on Market to Sale Report Produced on: Apr 15, 2013
Area Delimited by Entire OK State MLS - Single-Family Property Type
MARCH YEAR TO DATE (YTD)
2009 2010 2011 2012 2013 2009 2010 2011 2012 2013
98 95 96 94
91 91
82 81 84 83
1 Year 1 Year
-14.58% -11.32%
2 Year 2 Year
-16.91% -13.27%
5 YEAR MARKET ACTIVITY TRENDS 5yr MAR AVG = 89 3 MONTHS
Average Days on Market
100 High J 82
90 Mar 2011 = 98 A
80
Low N
70
60 May 2010 = 74 F 87
50 E
40 Average DOM this B 6.43%
30
20 month at 81,
10 below the 5 yr MAR M 81
A
0
Jun 2009 Dec 2009 Jun 2010 Dec 2010 Jun 2011 Dec 2011 Jun 2012 Dec 2012 average of 89 R -7.27%
AVERAGE DOM OF CLOSED SALES & BEDROOMS DISTRIBUTION BY PRICE
Distribution of Average Days on Market to Sale by Price Range % AVDOM 2 Beds 3 Beds 4 Beds 5 Beds+
$25,000
and less 149 4.16% 80.8 101.8 54.2 81.1 36.0
$25,001
$75,000 636 17.75% 85.9 84.2 80.2 123.7 139.2
$75,001
$100,000 396 11.05% 78.7 95.4 74.6 57.0 97.7
$100,001
Contact an experienced REALTOR
Ready to Buy or Sell Real Estate?
$150,000 902 25.17% 79.0 89.1 76.4 81.1 97.5
$150,001
$200,000 660 18.42% 79.8 115.3 70.6 72.0 183.8
$200,001
$275,000 460 12.83% 83.8 114.7 81.0 70.8 129.9
$275,001
and up 381 10.63% 78.9 107.9 81.7 72.2 88.2
Average Closed DOM: 81.0 97.2 75.8 76.3 111.9
Total Closed Units: 3,584 705 2001 789 89
Total Closed Volume: 574,865,244 84.05M 269.09M 188.52M 33.21M
Reports produced and compiled by RE STATS Inc. Information is deemed reliable but not guaranteed. Does not reflect all market activity. pp. 6
Steve Reese 405-848-9944 steve@oklahomarealtors.com
8. Monthly Inventory Analysis
Data from the The Oklahoma Association of
REALTORS®
March 2013
Closed Sales as of Apr 12, 2013
Average List Price at Closing Report Produced on: Apr 15, 2013
Area Delimited by Entire OK State MLS - Single-Family Property Type
MARCH YEAR TO DATE (YTD)
2009 2010 2011 2012 2013 2009 2010 2011 2012 2013
165,357 161,312
153,724 147,585 148,779
143,341 144,139 146,591 142,521 143,389
1 Year 1 Year
+7.57% +8.42%
2 Year 2 Year
+12.80% +9.30%
5 YEAR MARKET ACTIVITY TRENDS 5yr MAR AVG = 151K 3 MONTHS
Average List Price
200,000 High J 154,515
Nov 2012 = 168,351 A
Low N
Jan 2010 = 139,108 F 162,221
100,000 E
Average LPrice this B 4.99%
month at 165,357,
above the 5 yr MAR M 165,357
A
0
Jun 2009 Dec 2009 Jun 2010 Dec 2010 Jun 2011 Dec 2011 Jun 2012 Dec 2012 average of 150,630 R 1.93%
AVERAGE LIST PRICE OF CLOSED SALES & BEDROOMS DISTRIBUTION BY PRICE
Distribution of Average List Price at Closing by Price Range % AVL$ 2 Beds 3 Beds 4 Beds 5 Beds+
$25,000
and less 136 3.79% 17,389 18,636 21,002 19,228 18,950
$25,001
$75,000 610 17.02% 52,173 51,946 55,561 54,546 59,383
$75,001
$100,000 401 11.19% 89,296 92,562 91,109 93,465 90,800
$100,001
Contact an experienced REALTOR
Ready to Buy or Sell Real Estate?
$150,000 901 25.14% 128,311 130,531 129,573 135,626 126,296
$150,001
$200,000 675 18.83% 175,474 180,397 175,687 177,908 187,927
$200,001
$275,000 459 12.81% 236,636 235,880 236,860 243,594 242,101
$275,001
and up 402 11.22% 447,693 455,221 439,604 432,594 611,087
Average List Price: $165,357 $123,478 $138,620 $245,225 $390,188
Total Closed Units: 3,584 705 2001 789 89
Total List Volume: 592,639,844 87.05M 277.38M 193.48M 34.73M
Reports produced and compiled by RE STATS Inc. Information is deemed reliable but not guaranteed. Does not reflect all market activity. pp. 7
Steve Reese 405-848-9944 steve@oklahomarealtors.com
9. Monthly Inventory Analysis
Data from the The Oklahoma Association of
REALTORS®
March 2013
Closed Sales as of Apr 12, 2013
Average Sold Price at Closing Report Produced on: Apr 15, 2013
Area Delimited by Entire OK State MLS - Single-Family Property Type
MARCH YEAR TO DATE (YTD)
2009 2010 2011 2012 2013 2009 2010 2011 2012 2013
160,398 155,939
147,788 141,244 142,908
138,071 138,974 140,216 137,125 137,935
1 Year 1 Year
+8.53% +9.12%
2 Year 2 Year
+14.39% +10.40%
5 YEAR MARKET ACTIVITY TRENDS 5yr MAR AVG = 145K 3 MONTHS
Average Sold Price
200,000 High J 149,510
Nov 2012 = 162,778 A
Low N
Jan 2010 = 133,466 F 155,965
100,000 E
Average SPrice this B 4.32%
month at 160,398,
above the 5 yr MAR M 160,398
A
0
Jun 2009 Dec 2009 Jun 2010 Dec 2010 Jun 2011 Dec 2011 Jun 2012 Dec 2012 average of 145,089 R 2.84%
AVERAGE SOLD PRICE OF CLOSED SALES & BEDROOMS DISTRIBUTION BY PRICE
Distribution of Average Sold Price at Closing by Price Range % AVS$ 2 Beds 3 Beds 4 Beds 5 Beds+
$25,000
and less 149 4.16% 17,085 16,438 17,919 17,526 16,000
$25,001
$75,000 636 17.75% 50,886 48,801 51,868 50,660 51,483
$75,001
$100,000 396 11.05% 88,351 88,335 88,264 89,314 86,467
$100,001
Contact an experienced REALTOR
Ready to Buy or Sell Real Estate?
$150,000 902 25.17% 126,904 126,061 126,378 131,685 121,246
$150,001
$200,000 660 18.42% 173,787 174,835 172,626 174,909 183,831
$200,001
$275,000 460 12.83% 235,404 233,139 231,965 239,446 238,641
$275,001
and up 381 10.63% 439,675 440,740 418,494 419,607 581,121
Average Closed Price: $160,398 $119,216 $134,478 $238,930 $373,157
Total Closed Units: 3,584 705 2001 789 89
Total Closed Volume: 574,865,244 84.05M 269.09M 188.52M 33.21M
Reports produced and compiled by RE STATS Inc. Information is deemed reliable but not guaranteed. Does not reflect all market activity. pp. 8
Steve Reese 405-848-9944 steve@oklahomarealtors.com
10. Monthly Inventory Analysis
Data from the The Oklahoma Association of
REALTORS®
March 2013
Closed Sales as of Apr 12, 2013
Average Percent of List Price to Selling Price Report Produced on: Apr 15, 2013
Area Delimited by Entire OK State MLS - Single-Family Property Type
MARCH YEAR TO DATE (YTD)
2009 2010 2011 2012 2013 2009 2010 2011 2012 2013
97.25% 96.62%
96.48% 96.06%
95.74% 95.63% 95.65% 95.57% 95.43% 95.56%
1 Year 1 Year
+1.67% +1.11%
2 Year 2 Year
+1.69% +1.24%
5 YEAR MARKET ACTIVITY TRENDS 5yr MAR AVG=96.15% 3 MONTHS
Average List/Sell Price
98 High J 96.46%
Mar 2013 = 97.25% A
Low N
97
Jan 2011 = 95.15% F 95.92%
E
96
Average List/Sell this B -0.56%
month at 97.25%,
above the 5 yr MAR M 97.25%
A
95
Jun 2009 Dec 2009 Jun 2010 Dec 2010 Jun 2011 Dec 2011 Jun 2012 Dec 2012 average of 96.15% R 1.38%
AVERAGE L/S% OF CLOSED SALES & BEDROOMS DISTRIBUTION BY PRICE
Distribution of $avgmed L/S % by Price Range % AVL/S% 2 Beds 3 Beds 4 Beds 5 Beds+
$25,000
and less 149 4.16% 91.61% 93.27% 89.46% 92.61% 84.65%
$25,001
$75,000 636 17.75% 96.16% 94.34% 94.70%112.43% 89.12%
$75,001
$100,000 396 11.05% 96.85% 95.76% 97.32% 96.68% 95.04%
$100,001
Contact an experienced REALTOR
Ready to Buy or Sell Real Estate?
$150,000 902 25.17% 97.81% 96.69% 98.11% 97.56% 96.32%
$150,001
$200,000 660 18.42% 98.17% 97.14% 98.36% 98.37% 98.23%
$200,001
$275,000 460 12.83% 98.66% 101.08% 98.10% 98.35% 98.60%
$275,001
and up 381 10.63% 97.08% 96.64% 96.14% 97.63% 96.39%
Average List/Sell Ratio: 97.30% 96.05% 97.04% 98.95% 96.28%
Total Closed Units: 3,584 705 2001 789 89
Total Closed Volume: 574,865,244 84.05M 269.09M 188.52M 33.21M
Reports produced and compiled by RE STATS Inc. Information is deemed reliable but not guaranteed. Does not reflect all market activity. pp. 9
Steve Reese 405-848-9944 steve@oklahomarealtors.com
11. Monthly Inventory Analysis
Data from the The Oklahoma Association of
REALTORS®
March 2013
Inventory as of Apr 12, 2013
Market Summary Report Produced on: Apr 15, 2013
Area Delimited by Entire OK State MLS - Single-Family Property Type
Inventory Inventory Market Activity Market Activity
New Listings Closed Sales
6,584 = 24.45% 3,584 = 11.75%
Start Inventory Pending Sales
20,342 4,243 = 13.92%
Total Inventory
Other Off Market
Units 2,809 = 9.21%
26,926
Volume Active Inventory
$5,221,358,569 19,855 = 65.12%
Absorption: Last 12 months, an Average of 3,440 Sales/Month MARCH Year To Date
Active Inventory as of March 31, 2013 = 19,855 2012 2013 +/-% 2012 2013 +/-%
Closed Sales 3,429 3,584 4.52% 8,480 8,801 3.79%
Pending Sales 3,876 4,243 9.47% 10,412 11,540 10.83%
New Listings 6,788 6,584 -3.01% 18,666 18,048 -3.31%
Average List Price 153,724 165,357 7.57% 148,779 161,312 8.42%
Average Sale Price 147,788 160,398 8.53% 142,908 155,939 9.12%
Average Percent of List Price to Selling Price 95.65% 97.25% 1.67% 95.56% 96.62% 1.11%
Average Days on Market to Sale 94.86 81.03 -14.58% 93.93 83.30 -11.32%
Monthly Inventory 24,013 19,855 -17.32% 24,013 19,855 -17.32%
Months Supply of Inventory 7.72 5.77 -25.22% 7.72 5.77 -25.22%
2012 2012
MARCH MARKET 2013 AVERAGE PRICES 2013
New Listings Pending Listings List Price Sale Price
6,788 6,584 165,357
160,398
4,243 153,724
3,876 147,788
-3.01% +9.47% +7.57% +8.53%
2012 2012
INVENTORY 2013 AVERAGE L/S% & DOM 2013
Active Inventory Monthly Supply of Inventory % of List to Sale Price Days on Market to Sale
24,013 7.72 97.25% 94.86
19,855 5.77 95.65% 81.03
-17.32% -25.22% +1.67% -14.58%
Reports produced and compiled by RE STATS Inc. Information is deemed reliable but not guaranteed. Does not reflect all market activity. pp. 10
Steve Reese 405-848-9944 steve@oklahomarealtors.com