SlideShare ist ein Scribd-Unternehmen logo
1 von 11
Downloaden Sie, um offline zu lesen
April 2012
                                   Area Delimited by Entire OK State MLS -
                                  Condo/Town, Single-Family Property Type


Absorption: Last 12 months, an Average of 3,025 Sales/Month                                   APRIL                              Market Activity
Active Inventory as of April 30, 2012 = 21,388                                      2011          2012        +/-%
Closed Listings                                                                     3,089        3,306        7.02%
Pending Listings                                                                    3,272        4,206       28.55%
New Listings                                                                        6,782        6,682       -1.47%
Average List Price                                                                151,978      158,352        4.19%
Average Sale Price                                                                145,765      153,190        5.09%          Closed (10.53%)
Average Percent of List Price to Selling Price                                    95.69%       96.99%         1.36%          Pending (13.39%)
Average Days on Market to Sale                                                      90.60        80.69      -10.94%          Other OffMarket (7.98%)
End of Month Inventory                                                             24,892       21,388      -14.08%          Active (68.10%)
Months Supply of Inventory                                                           9.19         7.07      -23.07%

                                                                                                                        Report Produced on: May 15, 2012

Monthly Inventory Analysis
 Data from the The Oklahoma Association of REALTORS®


                          Analysis Wrap-Up                                                                What's in this Issue

 Months Supply of Inventory (MSI) Decreases                                        Closed Listings                                                      1
 The total housing inventory at the end of April 2012 decreased                    Pending Listings                                                     2
 14.08% to 21,388 existing homes available for sale. Over the                      New Listings                                                         3
 last 12 months this area has had an average of 3,025 closed                       Inventory                                                            4
 sales per month. This represents an unsold inventory index of
                                                                                   Months Supply of Inventory                                           5
 7.07 MSI for this period.
                                                                                   Average Days on Market to Sale                                       6
 Average Sale Prices Going Up
                                                                                   Average List Price at Closing                                        7
 According to the preliminary trends, this market area has                         Average Sale Price at Closing                                        8
 experienced some upward momentum with the increase of
 Average Price this month. Prices went up 5.09% in April 2012                      Average Percent of List Price to Selling Price                       9
 to $153,190 versus the previous year at $145,765.                                 Market Summary                                                      10
 Average Days on Market Shortens                                                                          Real Estate is Local
 The average number of 80.69 days that homes spent on the
 market before selling decreased by 9.91 days or 10.94% in                         Consumers Should Consult with a REALTOR®
 April 2012 compared to last year’s same month at 90.60 DOM.                       Buying or selling real estate, for a majority of consumers, is
 Sales Success for April 2012 is Positive                                          one of the most important decisions they will make. Choosing a
                                                                                   real estate professional continues to be a vital part of this
 Overall, with Average Prices going up and Days on Market                          process.
 decreasing, the Listed versus Closed Ratio finished strong this
 month.                                                                            Identify a Professional to Manage the Procedure
 There were 6,682 New Listings in April 2012, down 1.47% from                      REALTORS® are well-informed about critical factors that affect
 last year at 6,782. Furthermore, there were 3,306 Closed                          your specific market area - such as changes in market
 Listings this month versus last year at 3,089, a 7.02%                            conditions, consumer attitudes and interest rates.
 increase.
                                                                                   Are You Ready to Buy or Sell Real Estate?
 Closed versus Listed trends yielded a 49.5% ratio, up from last                   For more information, contact:
 year’s April 2012 at 45.5%, a 8.63% upswing. This will certainly
 create pressure on a decreasing Month’s Supply of Inventory                         Steve Reese - Vice President, Marketing
 (MSI) in the following months to come.                                              405-848-9944
                                                                                     steve@oklahomarealtors.com
                                                                                     Or visit: www.OklahomaRealtors.com

Reports produced and compiled by RE STATS Inc. Information is deemed reliable but not guaranteed. Does not reflect all market activity.
Monthly Inventory Analysis
                                                         Data from the The Oklahoma Association of
                                                         REALTORS®

                                                                           April 2012
                                                         Closed Sales as of May 12, 2012

Closed Listings                                                                                                                  Report Produced on: May 15, 2012
Area Delimited by Entire OK State MLS - Condo/Town, Single-Family Property Type

                                                         APRIL                                                               YEAR TO DATE (YTD)
              2008                          2009          2010          2011          2012               2008          2009         2010        2011            2012

                                                          3,786                                         11,860                                                  11,489
            3,477                                                                    3,306                                         10,873
                                            2,995                       3,089                                        10,108                     9,802
                                                                                     1 Year                                                                  1 Year
                                                                                    +7.02%                                                                  +17.21%
                                                                                     2 Year                                                                  2 Year
                                                                                    -12.68%                                                                 +5.67%


                                                          5 YEAR MARKET ACTIVITY TRENDS                                          5yr APR AVG = 3,331     3 MONTHS

                                          5,000                                                                                   High                 F 2,638
                                                                                                                                  Jul 2008 = 4,045     E
                                          4,000
                                                                                                                                  Low                  B
                                          3,000                                                                                   Jan 2010 = 1,694     M 3,308
                                                                                                                                                       A
   Closed Listings


                                          2,000                                                                                   Closed Listings
                                                                                                                                                this   R 25.40%
                                          1,000                                                                                   month at 3,306,
                                                                                                                                  below the 5 yr APR A 3,306
                                                                                                                                                     P
                                             0
                                                   Jun 2008 Dec 2008 Jun 2009 Dec 2009 Jun 2010 Dec 2010 Jun 2011 Dec 2011        average of 3,331   R -0.06%


                                                                  CLOSED LISTINGS & BEDROOMS DISTRIBUTION BY PRICE
                                             Distribution of Closed Listings by Price Range                  %       AVDOM         2 Beds   3 Beds     4 Beds    5 Beds+

                                        $25,000
                                        and less           154                                              4.66%       75.5          75       69           8            2

                                        $25,001
                                        $75,000            602                                            18.21%        81.8        180       359         59             4

                                        $75,001
                                        $100,000           372                                            11.25%        82.5          83      251         34             4

                                        $100,001
    Contact an experienced REALTOR
    Ready to Buy or Sell Real Estate?


                                        $150,000           934                                            28.25%        75.2        145       669        113             7

                                        $150,001
                                        $175,000           317                                              9.59%       83.2          52      181         77             7

                                        $175,001
                                        $250,000           523                                            15.82%        79.0          61      228        211           23

                                        $250,001
                                         and up            404                                            12.22%        92.2          22      102        233           47

                                        Total Closed Units:             3,306                                           80.7          618     1859      735       94
                                        Total Closed Volume:      506,446,010                                                      64.62M 238.53M 167.65M     35.64M
                                        Average Closed Price:       $153,190                                                     $104,567 $128,313 $228,088 $379,198

Reports produced and compiled by RE STATS Inc. Information is deemed reliable but not guaranteed. Does not reflect all market activity.                             pp. 1

Steve Reese                                                                                       405-848-9944                 steve@oklahomarealtors.com
Monthly Inventory Analysis
                                                          Data from the The Oklahoma Association of
                                                          REALTORS®

                                                                            April 2012
                                                          Pending Listings as of May 12, 2012

Pending Listings                                                                                                                  Report Produced on: May 15, 2012
Area Delimited by Entire OK State MLS - Condo/Town, Single-Family Property Type

                                                          APRIL                                                               YEAR TO DATE (YTD)
              2008                           2009          2010          2011          2012               2008          2009         2010        2011            2012

                                                           4,843                                                                    14,258                       14,557
                                                                                      4,206              13,887
            3,967
                                            3,548                        3,272                                        12,216                    11,626
                                                                                      1 Year                                                                  1 Year
                                                                                     +28.55%                                                                 +25.21%
                                                                                      2 Year                                                                  2 Year
                                                                                     -13.15%                                                                 +2.10%


                                                           5 YEAR MARKET ACTIVITY TRENDS                                          5yr APR AVG = 3,967     3 MONTHS

                                          5,000                                                                                    High                 F 3,348
                                                                                                                                   Apr 2010 = 4,843     E
                                          4,000
                                                                                                                                   Low                  B
                                          3,000                                                                                    Dec 2009 = 1,999     M 3,897
                                                                                                                                                        A
   Pending Listings


                                          2,000                                                                                    Pending Listingsthis R 16.40%
                                          1,000                                                                                    month at 4,206,
                                                                                                                                   above the 5 yr APR A 4,206
                                                                                                                                                        P
                                              0
                                                    Jun 2008 Dec 2008 Jun 2009 Dec 2009 Jun 2010 Dec 2010 Jun 2011 Dec 2011        average of 3,967     R 7.93%


                                                                   PENDING LISTINGS & BEDROOMS DISTRIBUTION BY PRICE
                                             Distribution of Pending Listings by Price Range                  %       AVDOM         2 Beds   3 Beds     4 Beds    5 Beds+

                                        $25,000
                                        and less            143                                              3.40%       52.9          56       75         11             1

                                        $25,001
                                        $75,000             704                                            16.74%        76.4        234       402         64             4

                                        $75,001
                                        $100,000            530                                            12.60%        72.4        128       352         44             6

                                        $100,001
    Contact an experienced REALTOR
    Ready to Buy or Sell Real Estate?


                                        $150,000         1,036                                             24.63%        65.8        177       717        139             3

                                        $150,001
                                        $200,000            766                                            18.21%        79.3        115       427        212           12

                                        $200,001
                                        $275,000            506                                            12.03%        68.4          69      179        239           19

                                        $275,001
                                         and up             521                                            12.39%        92.0          50      135        268           68

                                        Total Pending Units:             4,206                                           77.4          829     2287      977      113
                                        Total Pending Volume:      717,599,373                                                     120.53M 311.20M 231.09M     54.78M
                                        Average Listing Price:       $161,941                                                     $145,390 $136,072 $236,534 $484,783

Reports produced and compiled by RE STATS Inc. Information is deemed reliable but not guaranteed. Does not reflect all market activity.                              pp. 2

Steve Reese                                                                                        405-848-9944                 steve@oklahomarealtors.com
Monthly Inventory Analysis
                                                         Data from the The Oklahoma Association of
                                                         REALTORS®

                                                                             April 2012
                                                         New Listings as of May 12, 2012

New Listings                                                                                                                     Report Produced on: May 15, 2012
Area Delimited by Entire OK State MLS - Condo/Town, Single-Family Property Type

                                                         APRIL                                                               YEAR TO DATE (YTD)
             2008                           2009          2010             2011         2012             2008          2009         2010        2011            2012

                                                          7,696                                         25,186                     25,423                       24,801
           6,868                                                        6,782          6,682                                                   23,596
                                           5,904                                                                     22,044
                                                                                       1 Year                                                                   1 Year
                                                                                       -1.47%                                                                   +5.11%
                                                                                       2 Year                                                                   2 Year
                                                                                      -13.18%                                                                   -2.45%


                                                          5 YEAR MARKET ACTIVITY TRENDS                                          5yr APR AVG = 6,786     3 MONTHS

                                         8,000                                                                                    High                 F 5,566
                                         7,000                                                                                    Apr 2010 = 7,696     E
                                         6,000                                                                                    Low                  B
                                         5,000                                                                                    Dec 2008 = 3,532     M 6,560
                                         4,000                                                                                                         A
   New Listings


                                         3,000                                                                                    New Listings this    R 17.86%
                                         2,000                                                                                    month at 6,682,
                                         1,000                                                                                    below the 5 yr APR A 6,682
                                                                                                                                                     P
                                             0
                                                   Jun 2008 Dec 2008 Jun 2009 Dec 2009 Jun 2010 Dec 2010 Jun 2011 Dec 2011        average of 6,786   R 1.86%


                                                                    NEW LISTINGS & BEDROOMS DISTRIBUTION BY PRICE
                                            Distribution of New Listings by Price Range                      %                     2 Beds   3 Beds     4 Beds    5 Beds+

                                       $50,000
                                       and less            627                                              9.38%                   278       299         43             7

                                       $50,001
                                       $75,000             632                                              9.46%                   228       362         34             8

                                       $75,001
                                       $100,000            759                                            11.36%                    214       475         63             7

                                       $100,001
   Contact an experienced REALTOR
   Ready to Buy or Sell Real Estate?


                                       $150,000         1,698                                             25.41%                    293     1,191        206             8

                                       $150,001
                                       $225,000         1,437                                             21.51%                    211       781        414           31

                                       $225,001
                                       $325,000            806                                            12.06%                      84      301        385           36

                                       $325,001
                                        and up             723                                            10.82%                      69      165        354        135

                                       Total New Listed Units:                            6,682                                      1377     3574     1499      232
                                       Total New Listed Volume:                   1,253,794,133                                   173.28M 531.63M 408.77M 140.11M
                                       Average New Listed Listing Price:              $205,389                                   $125,838 $148,750 $272,696 $603,930

Reports produced and compiled by RE STATS Inc. Information is deemed reliable but not guaranteed. Does not reflect all market activity.                             pp. 3

Steve Reese                                                                                       405-848-9944                 steve@oklahomarealtors.com
Monthly Inventory Analysis
                                                          Data from the The Oklahoma Association of
                                                          REALTORS®

                                                                             April 2012
                                                          Active Inventory as of May 12, 2012

Active Inventory                                                                                                                   Report Produced on: May 15, 2012
Area Delimited by Entire OK State MLS - Condo/Town, Single-Family Property Type

                                                     END OF APRIL                                                          ACTIVE DURING APRIL
              2008                           2009          2010           2011          2012              2008          2009          2010        2011             2012

                                                                         24,882                                                                  30,776
       22,894                                                                                            28,711                      28,778                        28,067
                                            21,381        21,906                      21,388                           27,292
                                                                                       1 Year                                                                      1 Year
                                                                                      -14.04%                                                                      -8.80%
                                                                                       2 Year                                                                      2 Year
                                                                                       -2.36%                                                                      -2.47%


                                                            5 YEAR MARKET ACTIVITY TRENDS                                          5yr APR AVG = 22,490     3 MONTHS
   Active Inventory


                                           30,000                                                                                   High                  F 21,489
                                                                                                                                    Jul 2011 = 26,410     E
                                                                                                                                    Low                   B
                                           20,000
                                                                                                                                    Jan 2008 = 19,517     M 21,389
                                                                                                                                                          A
                                           10,000
                                                                                                                                    Inventory this        R -0.47%
                                                                                                                                    month at 21,388,
                                                                                                                                    below the 5 yr APR A 21,388
                                                                                                                                                       P
                                               0
                                                     Jun 2008 Dec 2008 Jun 2009 Dec 2009 Jun 2010 Dec 2010 Jun 2011 Dec 2011        average of 22,490 R -0.00%


                                                                        INVENTORY & BEDROOMS DISTRIBUTION BY PRICE
                                             Distribution of Inventory by Price Range                          %      AVDOM          2 Beds   3 Beds      4 Beds    5 Beds+

                                        $50,000
                                        and less         1,912                                               8.94%      114.6         993       791         108           20

                                         $50,001
                                         $75,000         2,283                                              10.67%      110.7         868     1,265         126           24

                                        $75,001
                                        $100,000         2,584                                              12.08%      103.3         755     1,567         233           29

                                        $100,001
    Contact an experienced REALTOR
    Ready to Buy or Sell Real Estate?


                                        $150,000         4,769                                              22.30%        91.8        852     3,252         630           35

                                        $150,001
                                        $225,000         4,416                                              20.65%        93.0        690     2,367       1,257        102

                                        $225,001
                                        $350,000         3,199                                              14.96%        99.9        413     1,128       1,449        209

                                        $350,001
                                         and up          2,225                                              10.40%      115.5         229       471       1,035        490

                                        Total Active Inventory by Units:                       21,388                    101.2        4,800   10,841    4,838     909
                                        Total Active Inventory by Volume:               4,211,411,809                               630.41M    1.68B    1.38B 522.36M
                                        Average Active Inventory Listing Price:             $196,905                               $131,334 $155,167 $284,515 $574,655

Reports produced and compiled by RE STATS Inc. Information is deemed reliable but not guaranteed. Does not reflect all market activity.                                pp. 4

Steve Reese                                                                                         405-848-9944                 steve@oklahomarealtors.com
Monthly Inventory Analysis
                                                         Data from the The Oklahoma Association of
                                                         REALTORS®

                                                                           April 2012
                                                         Active Inventory as of May 12, 2012

Months Supply of Inventory                                                                                                       Report Produced on: May 15, 2012
Area Delimited by Entire OK State MLS - Condo/Town, Single-Family Property Type

                                                    MSI FOR APRIL                                                  INDICATORS FOR APRIL 2012
             2008                            2009         2010         2011             2012           Inventory   Closed        Absorption        MSI            MSI %

                                                                        9.2                                        36,303
                                                                                                                                                   7.1        14.145%
                                             6.9           6.9                          7.1             21,388
                    6.4
                                                                                     1 Year                                         3,025
                                                                                                         End of    Closed          Average       Months        Percent
                                                                                    -23.04%              Month      Last          Closed per     Supply        Months
                                                                                     2 Year              Active      12           Month over        of        Supply of
                                                                                    +2.68%             Inventory   Months         12 Months     Inventory     Inventory


                                                          5 YEAR MARKET ACTIVITY TRENDS                                           5yr APR AVG = 7.3        3 MONTHS

                                        10                                                                                        High                   F 7.3
                                         9                                                                                        Jun 2011 = 9.9         E
                                         8
                                                                                                                                  Low                    B
                                         7
                                         6                                                                                        Jan 2008 = 5.4         M 7.1
                                         5                                                                                                               A
   Months Supply


                                         4                                                                                        Months Supply this     R -2.10%
                                         3
                                         2                                                                                        month at 7.1,
                                         1                                                                                        below the 5 yr APR A 7.1
                                                                                                                                                     P
                                         0
                                               Jun 2008 Dec 2008 Jun 2009 Dec 2009 Jun 2010 Dec 2010 Jun 2011 Dec 2011            average of 7.3     R -0.60%


                                                                  MONTHS SUPPLY & BEDROOMS DISTRIBUTION BY PRICE
                                             Distribution of Active Inventory by Price Range and MSI        %       MSI            2 Beds   3 Beds       4 Beds    5 Beds+

                                       $50,000
                                       and less         1,912                                              8.94%         4.4         5.5        3.6         3.6       6.2

                                       $50,001
                                       $80,000          2,871                                             13.42%         7.4         9.7        6.7         5.4       9.3

                                       $80,001
                                       $110,000         2,755                                             12.88%         6.6         8.0        6.1         6.8      10.2

                                       $110,001
   Contact an experienced REALTOR
   Ready to Buy or Sell Real Estate?


                                       $170,000         5,636                                             26.35%         6.3         7.0        6.1         6.1       5.9

                                       $170,001
                                       $240,000         3,357                                             15.70%         7.2         8.8        7.5         6.2       7.4

                                       $240,001
                                       $360,000         2,728                                             12.75%         9.7        12.7       10.6         8.7       9.3

                                       $360,001
                                        and up          2,129                                              9.95%     15.8           22.9       16.9       13.5       18.6


                                       MSI:                                       7.1                                                 7.8   6.4             7.4      11.5
                                       Total Active Inventory:                21,388                                               4,800 10,841          4,838        909

Reports produced and compiled by RE STATS Inc. Information is deemed reliable but not guaranteed. Does not reflect all market activity.                               pp. 5

Steve Reese                                                                                      405-848-9944                  steve@oklahomarealtors.com
Monthly Inventory Analysis
                                                         Data from the The Oklahoma Association of
                                                         REALTORS®

                                                                           April 2012
                                                         Closed Sales as of May 12, 2012

Average Days on Market to Sale                                                                                                Report Produced on: May 15, 2012
Area Delimited by Entire OK State MLS - Condo/Town, Single-Family Property Type

                                                         APRIL                                                            YEAR TO DATE (YTD)
              2008                            2009        2010         2011         2012               2008         2009         2010          2011              2012

                                                                         91                                                                       92
                                               86                                                       86           87                                           88
                       79                                                             81
                                                            73                                                                     78
                                                                                    1 Year                                                                    1 Year
                                                                                   -10.94%                                                                    -4.86%
                                                                                    2 Year                                                                    2 Year
                                                                                   +10.69%                                                                   +12.18%


                                                          5 YEAR MARKET ACTIVITY TRENDS                                         5yr APR AVG = 82         3 MONTHS
   Average Days on Market


                                        100                                                                                    High                     F 91
                                         90                                                                                    Feb 2011 = 95            E
                                         80
                                                                                                                               Low                      B
                                         70
                                         60                                                                                    May 2010 = 70            M 92
                                         50                                                                                                             A
                                         40                                                                                    Average DOM this         R 0.55%
                                         30
                                         20                                                                                    month at 81,
                                         10                                                                                    below the 5 yr APR A 81
                                                                                                                                                  P
                                          0
                                                Jun 2008 Dec 2008 Jun 2009 Dec 2009 Jun 2010 Dec 2010 Jun 2011 Dec 2011        average of 82      R -12.09%


                                                       AVERAGE DOM OF CLOSED SALES & BEDROOMS DISTRIBUTION BY PRICE
                                              Distribution of Average Days on Market to Sale by Price Range %     AVDOM         2 Beds   3 Beds        4 Beds     5 Beds+

                                        $25,000
                                        and less           154                                            4.66%       75.5       89.0     64.5          52.0        38.5

                                        $25,001
                                        $75,000            602                                          18.21%        81.8       94.7     75.0          81.1      122.8

                                        $75,001
                                        $100,000           372                                          11.25%        82.5       97.5     77.5          86.6        53.5

                                        $100,001
    Contact an experienced REALTOR
    Ready to Buy or Sell Real Estate?


                                        $150,000           934                                          28.25%        75.2       87.0     72.3          76.6        86.0

                                        $150,001
                                        $175,000           317                                            9.59%       83.2       90.8     80.5          84.0        87.7

                                        $175,001
                                        $250,000           523                                          15.82%        79.0       86.4     74.2          81.7        81.0

                                        $250,001
                                         and up            404                                          12.22%        92.2      139.7     91.1          81.7      123.9

                                        Average Closed DOM:             80.7                                                     93.0       75.3         81.0      103.0
                                        Total Closed Units:            3,306                                                       618      1859           735         94
                                        Total Closed Volume:     506,446,010                                                    64.62M   238.53M       167.65M     35.64M

Reports produced and compiled by RE STATS Inc. Information is deemed reliable but not guaranteed. Does not reflect all market activity.                                pp. 6

Steve Reese                                                                                      405-848-9944               steve@oklahomarealtors.com
Monthly Inventory Analysis
                                                          Data from the The Oklahoma Association of
                                                          REALTORS®

                                                                             April 2012
                                                          Closed Sales as of May 12, 2012

Average List Price at Closing                                                                                                       Report Produced on: May 15, 2012
Area Delimited by Entire OK State MLS - Condo/Town, Single-Family Property Type

                                                          APRIL                                                                 YEAR TO DATE (YTD)
              2008                           2009             2010        2011          2012                2008         2009          2010         2011           2012

                                                                                      158,352                                                                  152,454
                                                                         151,978                                                                   150,006
                                                                                                         145,887                      144,358
   145,183                                 145,025       145,150                                                       143,277
                                                                                      1 Year                                                                       1 Year
                                                                                      +4.19%                                                                       +1.63%
                                                                                      2 Year                                                                       2 Year
                                                                                      +9.10%                                                                       +5.61%


                                                              5 YEAR MARKET ACTIVITY TRENDS                                         5yr APR AVG = 149K       3 MONTHS
   Average List Price


                                           200,000                                                                                   High                  F 149,802
                                                                                                                                     Jun 2008 = 164,437    E
                                                                                                                                     Low                   B
                                                                                                                                     Nov 2008 = 136,250  M 155,439
                                           100,000                                                                                                       A
                                                                                                                                     Average LPrice this R 3.76%
                                                                                                                                     month at 158,352,
                                                                                                                                     above the 5 yr APR A 158,352
                                                                                                                                                         P
                                                0
                                                      Jun 2008 Dec 2008 Jun 2009 Dec 2009 Jun 2010 Dec 2010 Jun 2011 Dec 2011        average of 149,138 R 1.87%


                                                     AVERAGE LIST PRICE OF CLOSED SALES & BEDROOMS DISTRIBUTION BY PRICE
                                             Distribution of Average List Price at Closing by Price Range       %        AVL$         2 Beds    3 Beds    4 Beds    5 Beds+

                                        $25,000
                                        and less              129                                              3.90%     17,988       21,363    20,117    22,250     29,200

                                         $25,001
                                         $75,000              586                                             17.73%     52,116       54,478    55,154    55,778     56,975

                                        $75,001
                                        $100,000              380                                             11.49%     89,142       92,303    92,141    94,744     86,400

                                        $100,001
    Contact an experienced REALTOR
    Ready to Buy or Sell Real Estate?


                                        $150,000              937                                             28.34% 127,907        131,672 128,613 130,089 141,214

                                        $150,001
                                        $175,000              305                                              9.23% 163,752        164,364 166,625 167,461 167,757

                                        $175,001
                                        $250,000              542                                             16.39% 209,137        210,981 209,833 217,093 222,264

                                        $250,001
                                         and up               427                                             12.92% 406,629        365,450 366,950 397,908 625,394


                                        Average List Price:            $158,352                                                     $109,415 $132,215 $235,107 $396,812
                                        Total Closed Units:                3,306                                                         618     1859      735       94
                                        Total List Volume:           523,510,697                                                      67.62M 245.79M 172.80M     37.30M

Reports produced and compiled by RE STATS Inc. Information is deemed reliable but not guaranteed. Does not reflect all market activity.                                pp. 7

Steve Reese                                                                                          405-848-9944                 steve@oklahomarealtors.com
Monthly Inventory Analysis
                                                          Data from the The Oklahoma Association of
                                                          REALTORS®

                                                                             April 2012
                                                          Closed Sales as of May 12, 2012

Average Sold Price at Closing                                                                                                       Report Produced on: May 15, 2012
Area Delimited by Entire OK State MLS - Condo/Town, Single-Family Property Type

                                                          APRIL                                                                 YEAR TO DATE (YTD)
              2008                          2009           2010          2011           2012               2008          2009          2010         2011           2012

                                                                                      153,190                                                                  146,799
                                                                       145,765                                                                     143,675
                                                                                                         141,345
   141,161                                 139,945       140,414                                                       137,995        139,176
                                                                                      1 Year                                                                       1 Year
                                                                                      +5.09%                                                                       +2.17%
                                                                                      2 Year                                                                       2 Year
                                                                                      +9.10%                                                                       +5.48%


                                                           5 YEAR MARKET ACTIVITY TRENDS                                            5yr APR AVG = 144K       3 MONTHS
   Average Sold Price


                                           200,000                                                                                   High                  F 144,105
                                                                                                                                     Jun 2008 = 159,237    E
                                                                                                                                     Low                   B
                                                                                                                                     Nov 2008 = 131,526  M 149,449
                                           100,000                                                                                                       A
                                                                                                                                     Average SPrice this R 3.71%
                                                                                                                                     month at 153,190,
                                                                                                                                     above the 5 yr APR A 153,190
                                                                                                                                                         P
                                                0
                                                      Jun 2008 Dec 2008 Jun 2009 Dec 2009 Jun 2010 Dec 2010 Jun 2011 Dec 2011        average of 144,095 R 2.50%


                                                     AVERAGE SOLD PRICE OF CLOSED SALES & BEDROOMS DISTRIBUTION BY PRICE
                                             Distribution of Average Sold Price at Closing by Price Range       %        AVS$         2 Beds    3 Beds    4 Beds    5 Beds+

                                        $25,000
                                        and less            154                                                4.66%     17,940       17,942    17,615    19,390     23,250

                                        $25,001
                                        $75,000             602                                               18.21%     51,918       50,905    52,727    50,301     48,750

                                        $75,001
                                        $100,000            372                                               11.25%     88,411       87,530    88,572    89,289     89,100

                                        $100,001
    Contact an experienced REALTOR
    Ready to Buy or Sell Real Estate?


                                        $150,000            934                                               28.25% 126,255        127,265 125,807 127,158 133,550

                                        $150,001
                                        $175,000            317                                                9.59% 162,771        160,884 162,791 164,001 162,721

                                        $175,001
                                        $250,000            523                                               15.82% 208,763        204,918 205,169 212,826 217,311

                                        $250,001
                                         and up             404                                               12.22% 398,110        342,259 350,480 384,477 595,205


                                        Average Closed Price:        $153,190                                                       $104,567 $128,313 $228,088 $379,198
                                        Total Closed Units:              3,306                                                           618     1859      735       94
                                        Total Closed Volume:       506,446,010                                                        64.62M 238.53M 167.65M     35.64M

Reports produced and compiled by RE STATS Inc. Information is deemed reliable but not guaranteed. Does not reflect all market activity.                                pp. 8

Steve Reese                                                                                          405-848-9944                 steve@oklahomarealtors.com
Monthly Inventory Analysis
                                                          Data from the The Oklahoma Association of
                                                          REALTORS®

                                                                            April 2012
                                                          Closed Sales as of May 12, 2012

Average Percent of List Price to Selling Price                                                                                 Report Produced on: May 15, 2012
Area Delimited by Entire OK State MLS - Condo/Town, Single-Family Property Type

                                                          APRIL                                                            YEAR TO DATE (YTD)
              2008                            2009          2010        2011          2012              2008         2009         2010          2011            2012

     96.92%                                               96.76%                    96.99%            96.64%
                                                                                                                                 96.36%
                                              96.20%                                                                                                          96.05%
                                                                       95.69%                                      95.77%                     95.58%
                                                                                   1 Year                                                                     1 Year
                                                                                    +1.36%                                                                    +0.49%
                                                                                   2 Year                                                                     2 Year
                                                                                    +0.24%                                                                    -0.33%


                                                            5 YEAR MARKET ACTIVITY TRENDS                                      5yr APR AVG=96.51%       3 MONTHS
   Average List/Sell Price


                                         98                                                                                    High                    F 95.80%
                                                                                                                               May 2008 = 97.15%       E
                                                                                                                               Low                     B
                                         97
                                                                                                                               Jan 2011 = 95.22%      M 95.79%
                                                                                                                                                      A
                                         96
                                                                                                                               Average List/Sell this R -0.01%
                                                                                                                               month at 96.99%,
                                                                                                                                above the 5 yr APR A 96.99%
                                                                                                                                                      P
                                         95
                                                 Jun 2008 Dec 2008 Jun 2009 Dec 2009 Jun 2010 Dec 2010 Jun 2011 Dec 2011       average of 96.51% R 1.25%


                                                        AVERAGE L/S% OF CLOSED SALES & BEDROOMS DISTRIBUTION BY PRICE
                                               Distribution of $avgmed L/S % by Price Range                 %      AVL/S%        2 Beds    3 Beds    4 Beds      5 Beds+

                                        $25,000
                                        and less            154                                            4.66% 88.70% 87.01% 90.69% 88.78% 82.95%

                                         $25,001
                                         $75,000            602                                          18.21% 96.48% 94.02% 98.41% 92.84% 87.03%

                                        $75,001
                                        $100,000            372                                          11.25% 96.39% 95.31% 96.74% 95.59%103.79%

                                        $100,001
    Contact an experienced REALTOR
    Ready to Buy or Sell Real Estate?


                                        $150,000            934                                          28.25% 98.16% 97.04% 97.90%101.42% 94.56%

                                        $150,001
                                        $175,000            317                                            9.59% 97.92% 98.05% 97.87% 98.02% 96.98%

                                        $175,001
                                        $250,000            523                                          15.82% 97.93% 97.38% 97.90% 98.11% 97.94%

                                        $250,001
                                         and up             404                                          12.22% 96.84% 94.79% 96.49% 97.22% 96.67%

                                        Average List/Sell Ratio:       97.00%                                                    94.75%     97.49%    97.69%     96.45%
                                        Total Closed Units:              3,306                                                       618      1859        735         94
                                        Total Closed Volume:       506,446,010                                                   64.62M    238.53M   167.65M     35.64M

Reports produced and compiled by RE STATS Inc. Information is deemed reliable but not guaranteed. Does not reflect all market activity.                             pp. 9

Steve Reese                                                                                       405-848-9944               steve@oklahomarealtors.com
Monthly Inventory Analysis
                                  Data from the The Oklahoma Association of
                                  REALTORS®

                                                      April 2012
                                  Inventory as of May 12, 2012

Market Summary                                                                                                  Report Produced on: May 15, 2012
Area Delimited by Entire OK State MLS - Condo/Town, Single-Family Property Type


                   Inventory                              Inventory                Market Activity                          Market Activity
                                                              New Listings                Closed Sales
                                                            6,682 = 23.81%               3,306 = 10.53%
                                                            Start Inventory               Pending Sales
                                                                21,386                   4,206 = 13.39%
                                                            Total Inventory
                                                                                        Other Off Market
                                                                Units                    2,507 = 7.98%
                                                               28,068
                                                               Volume                   Active Inventory
                                                           $5,400,084,226               21,388 = 68.10%


Absorption: Last 12 months, an Average of 3,025 Sales/Month                                    APRIL                               Year To Date

Active Inventory as of April 30, 2012 = 21,388                                      2011          2012        +/-%         2011           2012        +/-%
Closed Sales                                                                        3,089        3,306        7.02%         9,802          11,489     17.21%
Pending Sales                                                                       3,272        4,206       28.55%        11,626          14,557     25.21%
New Listings                                                                        6,782        6,682       -1.47%        23,596          24,801      5.11%
Average List Price                                                                151,978      158,352        4.19%       150,006         152,454      1.63%
Average Sale Price                                                                145,765      153,190        5.09%       143,675         146,799      2.17%
Average Percent of List Price to Selling Price                                    95.69%       96.99%         1.36%       95.58%          96.05%       0.49%
Average Days on Market to Sale                                                      90.60        80.69      -10.94%         92.35           87.86     -4.86%
Monthly Inventory                                                                  24,892       21,388      -14.08%        24,892          21,388    -14.08%
Months Supply of Inventory                                                           9.19         7.07      -23.07%          9.19            7.07    -23.07%

                                                                         2011                                                                             2011
                             APRIL MARKET                                2012                              AVERAGE PRICES                                 2012

      New Listings                                Pending Listings                          List Price                                Sale Price

     6,782          6,682                                                                          158,352
                                                                                    151,978                                                      153,190
                                                                 4,206
                                                  3,272                                                                           145,765


                    -1.47%                                      +28.55%                             +4.19%                                          +5.09%

                                                                         2011                                                                             2011
                              INVENTORY                                  2012                          AVERAGE L/S% & DOM                                 2012

      Active Inventory                  Monthly Supply of Inventory                % of List to Sale Price                   Days on Market to Sale

    24,892                                         9.19                                            96.99%                          90.60

                   21,388                                         7.07              95.69%                                                          80.69


                   -14.08%                                      -23.07%                             +1.36%                                          -10.94%

Reports produced and compiled by RE STATS Inc. Information is deemed reliable but not guaranteed. Does not reflect all market activity.                  pp. 10

Steve Reese                                                                     405-848-9944                 steve@oklahomarealtors.com

Weitere ähnliche Inhalte

Kürzlich hochgeladen

Provident Solitaire Park Square Kanakapura Road, Bangalore E- Brochure.pdf
Provident Solitaire Park Square Kanakapura Road, Bangalore E- Brochure.pdfProvident Solitaire Park Square Kanakapura Road, Bangalore E- Brochure.pdf
Provident Solitaire Park Square Kanakapura Road, Bangalore E- Brochure.pdffaheemali990101
 
Ajmera Prive at Juhu, Mumbai E-Brochure.pdf
Ajmera Prive at Juhu, Mumbai  E-Brochure.pdfAjmera Prive at Juhu, Mumbai  E-Brochure.pdf
Ajmera Prive at Juhu, Mumbai E-Brochure.pdfManishSaxena95
 
Brigade Neopolis Kokapet, Hyderabad E- Brochure
Brigade Neopolis Kokapet, Hyderabad E- BrochureBrigade Neopolis Kokapet, Hyderabad E- Brochure
Brigade Neopolis Kokapet, Hyderabad E- Brochurefaheemali990101
 
MADHUGIRI FARM LAND BROCHURES (11)_compressed (1).pdf
MADHUGIRI FARM LAND BROCHURES (11)_compressed (1).pdfMADHUGIRI FARM LAND BROCHURES (11)_compressed (1).pdf
MADHUGIRI FARM LAND BROCHURES (11)_compressed (1).pdfknoxdigital1
 
Sobha Aranya Sector 80 Gurgaon E- Brochure.pdf
Sobha Aranya Sector 80 Gurgaon E- Brochure.pdfSobha Aranya Sector 80 Gurgaon E- Brochure.pdf
Sobha Aranya Sector 80 Gurgaon E- Brochure.pdffaheemali990101
 
Dynamic Netsoft A leader In Property management Software
Dynamic Netsoft A leader In Property management SoftwareDynamic Netsoft A leader In Property management Software
Dynamic Netsoft A leader In Property management SoftwareDynamic Netsoft
 
Prestige Sector 94 at Noida E Brochure.pdf
Prestige Sector 94 at Noida E Brochure.pdfPrestige Sector 94 at Noida E Brochure.pdf
Prestige Sector 94 at Noida E Brochure.pdfsarak0han45400
 
Call Girls in Inderpuri Delhi 💯Call Us 🔝8264348440🔝
Call Girls in Inderpuri Delhi 💯Call Us 🔝8264348440🔝Call Girls in Inderpuri Delhi 💯Call Us 🔝8264348440🔝
Call Girls in Inderpuri Delhi 💯Call Us 🔝8264348440🔝soniya singh
 
SVN Live 4.22.24 Weekly Property Broadcast
SVN Live 4.22.24 Weekly Property BroadcastSVN Live 4.22.24 Weekly Property Broadcast
SVN Live 4.22.24 Weekly Property BroadcastSVN International Corp.
 
Rustomjee The Panorama At Pali Hill, Bandra West, Mumbai - Brochure.pdf
Rustomjee The Panorama At Pali Hill, Bandra West, Mumbai - Brochure.pdfRustomjee The Panorama At Pali Hill, Bandra West, Mumbai - Brochure.pdf
Rustomjee The Panorama At Pali Hill, Bandra West, Mumbai - Brochure.pdfmonikasharma630
 
The Importance of Parks and Recreation Areas in Reliaable Developers Plot Dev...
The Importance of Parks and Recreation Areas in Reliaable Developers Plot Dev...The Importance of Parks and Recreation Areas in Reliaable Developers Plot Dev...
The Importance of Parks and Recreation Areas in Reliaable Developers Plot Dev...Reliaable Developers
 
Eco-Efficient Living: Redefining Sustainability through Leech's Green Design ...
Eco-Efficient Living: Redefining Sustainability through Leech's Green Design ...Eco-Efficient Living: Redefining Sustainability through Leech's Green Design ...
Eco-Efficient Living: Redefining Sustainability through Leech's Green Design ...Newman George Leech
 
Namrata 7 Plumeria Drive Pimpri Chinchwad Pune Brochure.pdf
Namrata 7 Plumeria Drive Pimpri Chinchwad Pune Brochure.pdfNamrata 7 Plumeria Drive Pimpri Chinchwad Pune Brochure.pdf
Namrata 7 Plumeria Drive Pimpri Chinchwad Pune Brochure.pdfPrachiRudram
 
How to Navigate the Eviction Process in Pennsylvania: A Landlord's Guide
How to Navigate the Eviction Process in Pennsylvania: A Landlord's GuideHow to Navigate the Eviction Process in Pennsylvania: A Landlord's Guide
How to Navigate the Eviction Process in Pennsylvania: A Landlord's GuideezLandlordForms
 
83770-87607 ۞Call Girls In Near The Park Hotel (Cp) Delhi
83770-87607 ۞Call Girls In Near The Park Hotel (Cp) Delhi83770-87607 ۞Call Girls In Near The Park Hotel (Cp) Delhi
83770-87607 ۞Call Girls In Near The Park Hotel (Cp) Delhidollysharma2066
 
Experion Elements Sector 45 Noida_Brochure.pdf.pdf
Experion Elements Sector 45 Noida_Brochure.pdf.pdfExperion Elements Sector 45 Noida_Brochure.pdf.pdf
Experion Elements Sector 45 Noida_Brochure.pdf.pdfkratirudram
 
Managed Farmland Brochures to get more in
Managed Farmland Brochures to get more inManaged Farmland Brochures to get more in
Managed Farmland Brochures to get more inknoxdigital1
 
Prestige Rainbow Waters Raidurgam, Gachibowli Hyderabad E- Brochure.pdf
Prestige Rainbow Waters Raidurgam, Gachibowli Hyderabad E- Brochure.pdfPrestige Rainbow Waters Raidurgam, Gachibowli Hyderabad E- Brochure.pdf
Prestige Rainbow Waters Raidurgam, Gachibowli Hyderabad E- Brochure.pdffaheemali990101
 

Kürzlich hochgeladen (20)

Provident Solitaire Park Square Kanakapura Road, Bangalore E- Brochure.pdf
Provident Solitaire Park Square Kanakapura Road, Bangalore E- Brochure.pdfProvident Solitaire Park Square Kanakapura Road, Bangalore E- Brochure.pdf
Provident Solitaire Park Square Kanakapura Road, Bangalore E- Brochure.pdf
 
Ajmera Prive at Juhu, Mumbai E-Brochure.pdf
Ajmera Prive at Juhu, Mumbai  E-Brochure.pdfAjmera Prive at Juhu, Mumbai  E-Brochure.pdf
Ajmera Prive at Juhu, Mumbai E-Brochure.pdf
 
Brigade Neopolis Kokapet, Hyderabad E- Brochure
Brigade Neopolis Kokapet, Hyderabad E- BrochureBrigade Neopolis Kokapet, Hyderabad E- Brochure
Brigade Neopolis Kokapet, Hyderabad E- Brochure
 
MADHUGIRI FARM LAND BROCHURES (11)_compressed (1).pdf
MADHUGIRI FARM LAND BROCHURES (11)_compressed (1).pdfMADHUGIRI FARM LAND BROCHURES (11)_compressed (1).pdf
MADHUGIRI FARM LAND BROCHURES (11)_compressed (1).pdf
 
Sobha Aranya Sector 80 Gurgaon E- Brochure.pdf
Sobha Aranya Sector 80 Gurgaon E- Brochure.pdfSobha Aranya Sector 80 Gurgaon E- Brochure.pdf
Sobha Aranya Sector 80 Gurgaon E- Brochure.pdf
 
Dynamic Netsoft A leader In Property management Software
Dynamic Netsoft A leader In Property management SoftwareDynamic Netsoft A leader In Property management Software
Dynamic Netsoft A leader In Property management Software
 
Prestige Sector 94 at Noida E Brochure.pdf
Prestige Sector 94 at Noida E Brochure.pdfPrestige Sector 94 at Noida E Brochure.pdf
Prestige Sector 94 at Noida E Brochure.pdf
 
Call Girls in Inderpuri Delhi 💯Call Us 🔝8264348440🔝
Call Girls in Inderpuri Delhi 💯Call Us 🔝8264348440🔝Call Girls in Inderpuri Delhi 💯Call Us 🔝8264348440🔝
Call Girls in Inderpuri Delhi 💯Call Us 🔝8264348440🔝
 
SVN Live 4.22.24 Weekly Property Broadcast
SVN Live 4.22.24 Weekly Property BroadcastSVN Live 4.22.24 Weekly Property Broadcast
SVN Live 4.22.24 Weekly Property Broadcast
 
Rustomjee The Panorama At Pali Hill, Bandra West, Mumbai - Brochure.pdf
Rustomjee The Panorama At Pali Hill, Bandra West, Mumbai - Brochure.pdfRustomjee The Panorama At Pali Hill, Bandra West, Mumbai - Brochure.pdf
Rustomjee The Panorama At Pali Hill, Bandra West, Mumbai - Brochure.pdf
 
The Importance of Parks and Recreation Areas in Reliaable Developers Plot Dev...
The Importance of Parks and Recreation Areas in Reliaable Developers Plot Dev...The Importance of Parks and Recreation Areas in Reliaable Developers Plot Dev...
The Importance of Parks and Recreation Areas in Reliaable Developers Plot Dev...
 
Eco-Efficient Living: Redefining Sustainability through Leech's Green Design ...
Eco-Efficient Living: Redefining Sustainability through Leech's Green Design ...Eco-Efficient Living: Redefining Sustainability through Leech's Green Design ...
Eco-Efficient Living: Redefining Sustainability through Leech's Green Design ...
 
Namrata 7 Plumeria Drive Pimpri Chinchwad Pune Brochure.pdf
Namrata 7 Plumeria Drive Pimpri Chinchwad Pune Brochure.pdfNamrata 7 Plumeria Drive Pimpri Chinchwad Pune Brochure.pdf
Namrata 7 Plumeria Drive Pimpri Chinchwad Pune Brochure.pdf
 
How to Navigate the Eviction Process in Pennsylvania: A Landlord's Guide
How to Navigate the Eviction Process in Pennsylvania: A Landlord's GuideHow to Navigate the Eviction Process in Pennsylvania: A Landlord's Guide
How to Navigate the Eviction Process in Pennsylvania: A Landlord's Guide
 
9953056974 Low Rate Call Girls In Saket, Delhi NCR
9953056974 Low Rate Call Girls In Saket, Delhi NCR9953056974 Low Rate Call Girls In Saket, Delhi NCR
9953056974 Low Rate Call Girls In Saket, Delhi NCR
 
83770-87607 ۞Call Girls In Near The Park Hotel (Cp) Delhi
83770-87607 ۞Call Girls In Near The Park Hotel (Cp) Delhi83770-87607 ۞Call Girls In Near The Park Hotel (Cp) Delhi
83770-87607 ۞Call Girls In Near The Park Hotel (Cp) Delhi
 
Hot call girls in Moti Bagh🔝 9953056974 🔝 escort Service
Hot call girls in Moti Bagh🔝 9953056974 🔝 escort ServiceHot call girls in Moti Bagh🔝 9953056974 🔝 escort Service
Hot call girls in Moti Bagh🔝 9953056974 🔝 escort Service
 
Experion Elements Sector 45 Noida_Brochure.pdf.pdf
Experion Elements Sector 45 Noida_Brochure.pdf.pdfExperion Elements Sector 45 Noida_Brochure.pdf.pdf
Experion Elements Sector 45 Noida_Brochure.pdf.pdf
 
Managed Farmland Brochures to get more in
Managed Farmland Brochures to get more inManaged Farmland Brochures to get more in
Managed Farmland Brochures to get more in
 
Prestige Rainbow Waters Raidurgam, Gachibowli Hyderabad E- Brochure.pdf
Prestige Rainbow Waters Raidurgam, Gachibowli Hyderabad E- Brochure.pdfPrestige Rainbow Waters Raidurgam, Gachibowli Hyderabad E- Brochure.pdf
Prestige Rainbow Waters Raidurgam, Gachibowli Hyderabad E- Brochure.pdf
 

Empfohlen

2024 State of Marketing Report – by Hubspot
2024 State of Marketing Report – by Hubspot2024 State of Marketing Report – by Hubspot
2024 State of Marketing Report – by HubspotMarius Sescu
 
Everything You Need To Know About ChatGPT
Everything You Need To Know About ChatGPTEverything You Need To Know About ChatGPT
Everything You Need To Know About ChatGPTExpeed Software
 
Product Design Trends in 2024 | Teenage Engineerings
Product Design Trends in 2024 | Teenage EngineeringsProduct Design Trends in 2024 | Teenage Engineerings
Product Design Trends in 2024 | Teenage EngineeringsPixeldarts
 
How Race, Age and Gender Shape Attitudes Towards Mental Health
How Race, Age and Gender Shape Attitudes Towards Mental HealthHow Race, Age and Gender Shape Attitudes Towards Mental Health
How Race, Age and Gender Shape Attitudes Towards Mental HealthThinkNow
 
AI Trends in Creative Operations 2024 by Artwork Flow.pdf
AI Trends in Creative Operations 2024 by Artwork Flow.pdfAI Trends in Creative Operations 2024 by Artwork Flow.pdf
AI Trends in Creative Operations 2024 by Artwork Flow.pdfmarketingartwork
 
PEPSICO Presentation to CAGNY Conference Feb 2024
PEPSICO Presentation to CAGNY Conference Feb 2024PEPSICO Presentation to CAGNY Conference Feb 2024
PEPSICO Presentation to CAGNY Conference Feb 2024Neil Kimberley
 
Content Methodology: A Best Practices Report (Webinar)
Content Methodology: A Best Practices Report (Webinar)Content Methodology: A Best Practices Report (Webinar)
Content Methodology: A Best Practices Report (Webinar)contently
 
How to Prepare For a Successful Job Search for 2024
How to Prepare For a Successful Job Search for 2024How to Prepare For a Successful Job Search for 2024
How to Prepare For a Successful Job Search for 2024Albert Qian
 
Social Media Marketing Trends 2024 // The Global Indie Insights
Social Media Marketing Trends 2024 // The Global Indie InsightsSocial Media Marketing Trends 2024 // The Global Indie Insights
Social Media Marketing Trends 2024 // The Global Indie InsightsKurio // The Social Media Age(ncy)
 
Trends In Paid Search: Navigating The Digital Landscape In 2024
Trends In Paid Search: Navigating The Digital Landscape In 2024Trends In Paid Search: Navigating The Digital Landscape In 2024
Trends In Paid Search: Navigating The Digital Landscape In 2024Search Engine Journal
 
5 Public speaking tips from TED - Visualized summary
5 Public speaking tips from TED - Visualized summary5 Public speaking tips from TED - Visualized summary
5 Public speaking tips from TED - Visualized summarySpeakerHub
 
ChatGPT and the Future of Work - Clark Boyd
ChatGPT and the Future of Work - Clark Boyd ChatGPT and the Future of Work - Clark Boyd
ChatGPT and the Future of Work - Clark Boyd Clark Boyd
 
Getting into the tech field. what next
Getting into the tech field. what next Getting into the tech field. what next
Getting into the tech field. what next Tessa Mero
 
Google's Just Not That Into You: Understanding Core Updates & Search Intent
Google's Just Not That Into You: Understanding Core Updates & Search IntentGoogle's Just Not That Into You: Understanding Core Updates & Search Intent
Google's Just Not That Into You: Understanding Core Updates & Search IntentLily Ray
 
Time Management & Productivity - Best Practices
Time Management & Productivity -  Best PracticesTime Management & Productivity -  Best Practices
Time Management & Productivity - Best PracticesVit Horky
 
The six step guide to practical project management
The six step guide to practical project managementThe six step guide to practical project management
The six step guide to practical project managementMindGenius
 
Beginners Guide to TikTok for Search - Rachel Pearson - We are Tilt __ Bright...
Beginners Guide to TikTok for Search - Rachel Pearson - We are Tilt __ Bright...Beginners Guide to TikTok for Search - Rachel Pearson - We are Tilt __ Bright...
Beginners Guide to TikTok for Search - Rachel Pearson - We are Tilt __ Bright...RachelPearson36
 

Empfohlen (20)

2024 State of Marketing Report – by Hubspot
2024 State of Marketing Report – by Hubspot2024 State of Marketing Report – by Hubspot
2024 State of Marketing Report – by Hubspot
 
Everything You Need To Know About ChatGPT
Everything You Need To Know About ChatGPTEverything You Need To Know About ChatGPT
Everything You Need To Know About ChatGPT
 
Product Design Trends in 2024 | Teenage Engineerings
Product Design Trends in 2024 | Teenage EngineeringsProduct Design Trends in 2024 | Teenage Engineerings
Product Design Trends in 2024 | Teenage Engineerings
 
How Race, Age and Gender Shape Attitudes Towards Mental Health
How Race, Age and Gender Shape Attitudes Towards Mental HealthHow Race, Age and Gender Shape Attitudes Towards Mental Health
How Race, Age and Gender Shape Attitudes Towards Mental Health
 
AI Trends in Creative Operations 2024 by Artwork Flow.pdf
AI Trends in Creative Operations 2024 by Artwork Flow.pdfAI Trends in Creative Operations 2024 by Artwork Flow.pdf
AI Trends in Creative Operations 2024 by Artwork Flow.pdf
 
Skeleton Culture Code
Skeleton Culture CodeSkeleton Culture Code
Skeleton Culture Code
 
PEPSICO Presentation to CAGNY Conference Feb 2024
PEPSICO Presentation to CAGNY Conference Feb 2024PEPSICO Presentation to CAGNY Conference Feb 2024
PEPSICO Presentation to CAGNY Conference Feb 2024
 
Content Methodology: A Best Practices Report (Webinar)
Content Methodology: A Best Practices Report (Webinar)Content Methodology: A Best Practices Report (Webinar)
Content Methodology: A Best Practices Report (Webinar)
 
How to Prepare For a Successful Job Search for 2024
How to Prepare For a Successful Job Search for 2024How to Prepare For a Successful Job Search for 2024
How to Prepare For a Successful Job Search for 2024
 
Social Media Marketing Trends 2024 // The Global Indie Insights
Social Media Marketing Trends 2024 // The Global Indie InsightsSocial Media Marketing Trends 2024 // The Global Indie Insights
Social Media Marketing Trends 2024 // The Global Indie Insights
 
Trends In Paid Search: Navigating The Digital Landscape In 2024
Trends In Paid Search: Navigating The Digital Landscape In 2024Trends In Paid Search: Navigating The Digital Landscape In 2024
Trends In Paid Search: Navigating The Digital Landscape In 2024
 
5 Public speaking tips from TED - Visualized summary
5 Public speaking tips from TED - Visualized summary5 Public speaking tips from TED - Visualized summary
5 Public speaking tips from TED - Visualized summary
 
ChatGPT and the Future of Work - Clark Boyd
ChatGPT and the Future of Work - Clark Boyd ChatGPT and the Future of Work - Clark Boyd
ChatGPT and the Future of Work - Clark Boyd
 
Getting into the tech field. what next
Getting into the tech field. what next Getting into the tech field. what next
Getting into the tech field. what next
 
Google's Just Not That Into You: Understanding Core Updates & Search Intent
Google's Just Not That Into You: Understanding Core Updates & Search IntentGoogle's Just Not That Into You: Understanding Core Updates & Search Intent
Google's Just Not That Into You: Understanding Core Updates & Search Intent
 
How to have difficult conversations
How to have difficult conversations How to have difficult conversations
How to have difficult conversations
 
Introduction to Data Science
Introduction to Data ScienceIntroduction to Data Science
Introduction to Data Science
 
Time Management & Productivity - Best Practices
Time Management & Productivity -  Best PracticesTime Management & Productivity -  Best Practices
Time Management & Productivity - Best Practices
 
The six step guide to practical project management
The six step guide to practical project managementThe six step guide to practical project management
The six step guide to practical project management
 
Beginners Guide to TikTok for Search - Rachel Pearson - We are Tilt __ Bright...
Beginners Guide to TikTok for Search - Rachel Pearson - We are Tilt __ Bright...Beginners Guide to TikTok for Search - Rachel Pearson - We are Tilt __ Bright...
Beginners Guide to TikTok for Search - Rachel Pearson - We are Tilt __ Bright...
 

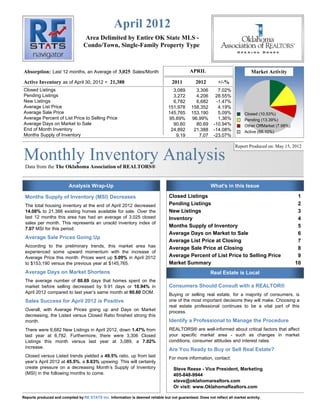
April 2012 MLS Statistics

  • 1. April 2012 Area Delimited by Entire OK State MLS - Condo/Town, Single-Family Property Type Absorption: Last 12 months, an Average of 3,025 Sales/Month APRIL Market Activity Active Inventory as of April 30, 2012 = 21,388 2011 2012 +/-% Closed Listings 3,089 3,306 7.02% Pending Listings 3,272 4,206 28.55% New Listings 6,782 6,682 -1.47% Average List Price 151,978 158,352 4.19% Average Sale Price 145,765 153,190 5.09% Closed (10.53%) Average Percent of List Price to Selling Price 95.69% 96.99% 1.36% Pending (13.39%) Average Days on Market to Sale 90.60 80.69 -10.94% Other OffMarket (7.98%) End of Month Inventory 24,892 21,388 -14.08% Active (68.10%) Months Supply of Inventory 9.19 7.07 -23.07% Report Produced on: May 15, 2012 Monthly Inventory Analysis Data from the The Oklahoma Association of REALTORS® Analysis Wrap-Up What's in this Issue Months Supply of Inventory (MSI) Decreases Closed Listings 1 The total housing inventory at the end of April 2012 decreased Pending Listings 2 14.08% to 21,388 existing homes available for sale. Over the New Listings 3 last 12 months this area has had an average of 3,025 closed Inventory 4 sales per month. This represents an unsold inventory index of Months Supply of Inventory 5 7.07 MSI for this period. Average Days on Market to Sale 6 Average Sale Prices Going Up Average List Price at Closing 7 According to the preliminary trends, this market area has Average Sale Price at Closing 8 experienced some upward momentum with the increase of Average Price this month. Prices went up 5.09% in April 2012 Average Percent of List Price to Selling Price 9 to $153,190 versus the previous year at $145,765. Market Summary 10 Average Days on Market Shortens Real Estate is Local The average number of 80.69 days that homes spent on the market before selling decreased by 9.91 days or 10.94% in Consumers Should Consult with a REALTOR® April 2012 compared to last year’s same month at 90.60 DOM. Buying or selling real estate, for a majority of consumers, is Sales Success for April 2012 is Positive one of the most important decisions they will make. Choosing a real estate professional continues to be a vital part of this Overall, with Average Prices going up and Days on Market process. decreasing, the Listed versus Closed Ratio finished strong this month. Identify a Professional to Manage the Procedure There were 6,682 New Listings in April 2012, down 1.47% from REALTORS® are well-informed about critical factors that affect last year at 6,782. Furthermore, there were 3,306 Closed your specific market area - such as changes in market Listings this month versus last year at 3,089, a 7.02% conditions, consumer attitudes and interest rates. increase. Are You Ready to Buy or Sell Real Estate? Closed versus Listed trends yielded a 49.5% ratio, up from last For more information, contact: year’s April 2012 at 45.5%, a 8.63% upswing. This will certainly create pressure on a decreasing Month’s Supply of Inventory Steve Reese - Vice President, Marketing (MSI) in the following months to come. 405-848-9944 steve@oklahomarealtors.com Or visit: www.OklahomaRealtors.com Reports produced and compiled by RE STATS Inc. Information is deemed reliable but not guaranteed. Does not reflect all market activity.
  • 2. Monthly Inventory Analysis Data from the The Oklahoma Association of REALTORS® April 2012 Closed Sales as of May 12, 2012 Closed Listings Report Produced on: May 15, 2012 Area Delimited by Entire OK State MLS - Condo/Town, Single-Family Property Type APRIL YEAR TO DATE (YTD) 2008 2009 2010 2011 2012 2008 2009 2010 2011 2012 3,786 11,860 11,489 3,477 3,306 10,873 2,995 3,089 10,108 9,802 1 Year 1 Year +7.02% +17.21% 2 Year 2 Year -12.68% +5.67% 5 YEAR MARKET ACTIVITY TRENDS 5yr APR AVG = 3,331 3 MONTHS 5,000 High F 2,638 Jul 2008 = 4,045 E 4,000 Low B 3,000 Jan 2010 = 1,694 M 3,308 A Closed Listings 2,000 Closed Listings this R 25.40% 1,000 month at 3,306, below the 5 yr APR A 3,306 P 0 Jun 2008 Dec 2008 Jun 2009 Dec 2009 Jun 2010 Dec 2010 Jun 2011 Dec 2011 average of 3,331 R -0.06% CLOSED LISTINGS & BEDROOMS DISTRIBUTION BY PRICE Distribution of Closed Listings by Price Range % AVDOM 2 Beds 3 Beds 4 Beds 5 Beds+ $25,000 and less 154 4.66% 75.5 75 69 8 2 $25,001 $75,000 602 18.21% 81.8 180 359 59 4 $75,001 $100,000 372 11.25% 82.5 83 251 34 4 $100,001 Contact an experienced REALTOR Ready to Buy or Sell Real Estate? $150,000 934 28.25% 75.2 145 669 113 7 $150,001 $175,000 317 9.59% 83.2 52 181 77 7 $175,001 $250,000 523 15.82% 79.0 61 228 211 23 $250,001 and up 404 12.22% 92.2 22 102 233 47 Total Closed Units: 3,306 80.7 618 1859 735 94 Total Closed Volume: 506,446,010 64.62M 238.53M 167.65M 35.64M Average Closed Price: $153,190 $104,567 $128,313 $228,088 $379,198 Reports produced and compiled by RE STATS Inc. Information is deemed reliable but not guaranteed. Does not reflect all market activity. pp. 1 Steve Reese 405-848-9944 steve@oklahomarealtors.com
  • 3. Monthly Inventory Analysis Data from the The Oklahoma Association of REALTORS® April 2012 Pending Listings as of May 12, 2012 Pending Listings Report Produced on: May 15, 2012 Area Delimited by Entire OK State MLS - Condo/Town, Single-Family Property Type APRIL YEAR TO DATE (YTD) 2008 2009 2010 2011 2012 2008 2009 2010 2011 2012 4,843 14,258 14,557 4,206 13,887 3,967 3,548 3,272 12,216 11,626 1 Year 1 Year +28.55% +25.21% 2 Year 2 Year -13.15% +2.10% 5 YEAR MARKET ACTIVITY TRENDS 5yr APR AVG = 3,967 3 MONTHS 5,000 High F 3,348 Apr 2010 = 4,843 E 4,000 Low B 3,000 Dec 2009 = 1,999 M 3,897 A Pending Listings 2,000 Pending Listingsthis R 16.40% 1,000 month at 4,206, above the 5 yr APR A 4,206 P 0 Jun 2008 Dec 2008 Jun 2009 Dec 2009 Jun 2010 Dec 2010 Jun 2011 Dec 2011 average of 3,967 R 7.93% PENDING LISTINGS & BEDROOMS DISTRIBUTION BY PRICE Distribution of Pending Listings by Price Range % AVDOM 2 Beds 3 Beds 4 Beds 5 Beds+ $25,000 and less 143 3.40% 52.9 56 75 11 1 $25,001 $75,000 704 16.74% 76.4 234 402 64 4 $75,001 $100,000 530 12.60% 72.4 128 352 44 6 $100,001 Contact an experienced REALTOR Ready to Buy or Sell Real Estate? $150,000 1,036 24.63% 65.8 177 717 139 3 $150,001 $200,000 766 18.21% 79.3 115 427 212 12 $200,001 $275,000 506 12.03% 68.4 69 179 239 19 $275,001 and up 521 12.39% 92.0 50 135 268 68 Total Pending Units: 4,206 77.4 829 2287 977 113 Total Pending Volume: 717,599,373 120.53M 311.20M 231.09M 54.78M Average Listing Price: $161,941 $145,390 $136,072 $236,534 $484,783 Reports produced and compiled by RE STATS Inc. Information is deemed reliable but not guaranteed. Does not reflect all market activity. pp. 2 Steve Reese 405-848-9944 steve@oklahomarealtors.com
  • 4. Monthly Inventory Analysis Data from the The Oklahoma Association of REALTORS® April 2012 New Listings as of May 12, 2012 New Listings Report Produced on: May 15, 2012 Area Delimited by Entire OK State MLS - Condo/Town, Single-Family Property Type APRIL YEAR TO DATE (YTD) 2008 2009 2010 2011 2012 2008 2009 2010 2011 2012 7,696 25,186 25,423 24,801 6,868 6,782 6,682 23,596 5,904 22,044 1 Year 1 Year -1.47% +5.11% 2 Year 2 Year -13.18% -2.45% 5 YEAR MARKET ACTIVITY TRENDS 5yr APR AVG = 6,786 3 MONTHS 8,000 High F 5,566 7,000 Apr 2010 = 7,696 E 6,000 Low B 5,000 Dec 2008 = 3,532 M 6,560 4,000 A New Listings 3,000 New Listings this R 17.86% 2,000 month at 6,682, 1,000 below the 5 yr APR A 6,682 P 0 Jun 2008 Dec 2008 Jun 2009 Dec 2009 Jun 2010 Dec 2010 Jun 2011 Dec 2011 average of 6,786 R 1.86% NEW LISTINGS & BEDROOMS DISTRIBUTION BY PRICE Distribution of New Listings by Price Range % 2 Beds 3 Beds 4 Beds 5 Beds+ $50,000 and less 627 9.38% 278 299 43 7 $50,001 $75,000 632 9.46% 228 362 34 8 $75,001 $100,000 759 11.36% 214 475 63 7 $100,001 Contact an experienced REALTOR Ready to Buy or Sell Real Estate? $150,000 1,698 25.41% 293 1,191 206 8 $150,001 $225,000 1,437 21.51% 211 781 414 31 $225,001 $325,000 806 12.06% 84 301 385 36 $325,001 and up 723 10.82% 69 165 354 135 Total New Listed Units: 6,682 1377 3574 1499 232 Total New Listed Volume: 1,253,794,133 173.28M 531.63M 408.77M 140.11M Average New Listed Listing Price: $205,389 $125,838 $148,750 $272,696 $603,930 Reports produced and compiled by RE STATS Inc. Information is deemed reliable but not guaranteed. Does not reflect all market activity. pp. 3 Steve Reese 405-848-9944 steve@oklahomarealtors.com
  • 5. Monthly Inventory Analysis Data from the The Oklahoma Association of REALTORS® April 2012 Active Inventory as of May 12, 2012 Active Inventory Report Produced on: May 15, 2012 Area Delimited by Entire OK State MLS - Condo/Town, Single-Family Property Type END OF APRIL ACTIVE DURING APRIL 2008 2009 2010 2011 2012 2008 2009 2010 2011 2012 24,882 30,776 22,894 28,711 28,778 28,067 21,381 21,906 21,388 27,292 1 Year 1 Year -14.04% -8.80% 2 Year 2 Year -2.36% -2.47% 5 YEAR MARKET ACTIVITY TRENDS 5yr APR AVG = 22,490 3 MONTHS Active Inventory 30,000 High F 21,489 Jul 2011 = 26,410 E Low B 20,000 Jan 2008 = 19,517 M 21,389 A 10,000 Inventory this R -0.47% month at 21,388, below the 5 yr APR A 21,388 P 0 Jun 2008 Dec 2008 Jun 2009 Dec 2009 Jun 2010 Dec 2010 Jun 2011 Dec 2011 average of 22,490 R -0.00% INVENTORY & BEDROOMS DISTRIBUTION BY PRICE Distribution of Inventory by Price Range % AVDOM 2 Beds 3 Beds 4 Beds 5 Beds+ $50,000 and less 1,912 8.94% 114.6 993 791 108 20 $50,001 $75,000 2,283 10.67% 110.7 868 1,265 126 24 $75,001 $100,000 2,584 12.08% 103.3 755 1,567 233 29 $100,001 Contact an experienced REALTOR Ready to Buy or Sell Real Estate? $150,000 4,769 22.30% 91.8 852 3,252 630 35 $150,001 $225,000 4,416 20.65% 93.0 690 2,367 1,257 102 $225,001 $350,000 3,199 14.96% 99.9 413 1,128 1,449 209 $350,001 and up 2,225 10.40% 115.5 229 471 1,035 490 Total Active Inventory by Units: 21,388 101.2 4,800 10,841 4,838 909 Total Active Inventory by Volume: 4,211,411,809 630.41M 1.68B 1.38B 522.36M Average Active Inventory Listing Price: $196,905 $131,334 $155,167 $284,515 $574,655 Reports produced and compiled by RE STATS Inc. Information is deemed reliable but not guaranteed. Does not reflect all market activity. pp. 4 Steve Reese 405-848-9944 steve@oklahomarealtors.com
  • 6. Monthly Inventory Analysis Data from the The Oklahoma Association of REALTORS® April 2012 Active Inventory as of May 12, 2012 Months Supply of Inventory Report Produced on: May 15, 2012 Area Delimited by Entire OK State MLS - Condo/Town, Single-Family Property Type MSI FOR APRIL INDICATORS FOR APRIL 2012 2008 2009 2010 2011 2012 Inventory Closed Absorption MSI MSI % 9.2 36,303 7.1 14.145% 6.9 6.9 7.1 21,388 6.4 1 Year 3,025 End of Closed Average Months Percent -23.04% Month Last Closed per Supply Months 2 Year Active 12 Month over of Supply of +2.68% Inventory Months 12 Months Inventory Inventory 5 YEAR MARKET ACTIVITY TRENDS 5yr APR AVG = 7.3 3 MONTHS 10 High F 7.3 9 Jun 2011 = 9.9 E 8 Low B 7 6 Jan 2008 = 5.4 M 7.1 5 A Months Supply 4 Months Supply this R -2.10% 3 2 month at 7.1, 1 below the 5 yr APR A 7.1 P 0 Jun 2008 Dec 2008 Jun 2009 Dec 2009 Jun 2010 Dec 2010 Jun 2011 Dec 2011 average of 7.3 R -0.60% MONTHS SUPPLY & BEDROOMS DISTRIBUTION BY PRICE Distribution of Active Inventory by Price Range and MSI % MSI 2 Beds 3 Beds 4 Beds 5 Beds+ $50,000 and less 1,912 8.94% 4.4 5.5 3.6 3.6 6.2 $50,001 $80,000 2,871 13.42% 7.4 9.7 6.7 5.4 9.3 $80,001 $110,000 2,755 12.88% 6.6 8.0 6.1 6.8 10.2 $110,001 Contact an experienced REALTOR Ready to Buy or Sell Real Estate? $170,000 5,636 26.35% 6.3 7.0 6.1 6.1 5.9 $170,001 $240,000 3,357 15.70% 7.2 8.8 7.5 6.2 7.4 $240,001 $360,000 2,728 12.75% 9.7 12.7 10.6 8.7 9.3 $360,001 and up 2,129 9.95% 15.8 22.9 16.9 13.5 18.6 MSI: 7.1 7.8 6.4 7.4 11.5 Total Active Inventory: 21,388 4,800 10,841 4,838 909 Reports produced and compiled by RE STATS Inc. Information is deemed reliable but not guaranteed. Does not reflect all market activity. pp. 5 Steve Reese 405-848-9944 steve@oklahomarealtors.com
  • 7. Monthly Inventory Analysis Data from the The Oklahoma Association of REALTORS® April 2012 Closed Sales as of May 12, 2012 Average Days on Market to Sale Report Produced on: May 15, 2012 Area Delimited by Entire OK State MLS - Condo/Town, Single-Family Property Type APRIL YEAR TO DATE (YTD) 2008 2009 2010 2011 2012 2008 2009 2010 2011 2012 91 92 86 86 87 88 79 81 73 78 1 Year 1 Year -10.94% -4.86% 2 Year 2 Year +10.69% +12.18% 5 YEAR MARKET ACTIVITY TRENDS 5yr APR AVG = 82 3 MONTHS Average Days on Market 100 High F 91 90 Feb 2011 = 95 E 80 Low B 70 60 May 2010 = 70 M 92 50 A 40 Average DOM this R 0.55% 30 20 month at 81, 10 below the 5 yr APR A 81 P 0 Jun 2008 Dec 2008 Jun 2009 Dec 2009 Jun 2010 Dec 2010 Jun 2011 Dec 2011 average of 82 R -12.09% AVERAGE DOM OF CLOSED SALES & BEDROOMS DISTRIBUTION BY PRICE Distribution of Average Days on Market to Sale by Price Range % AVDOM 2 Beds 3 Beds 4 Beds 5 Beds+ $25,000 and less 154 4.66% 75.5 89.0 64.5 52.0 38.5 $25,001 $75,000 602 18.21% 81.8 94.7 75.0 81.1 122.8 $75,001 $100,000 372 11.25% 82.5 97.5 77.5 86.6 53.5 $100,001 Contact an experienced REALTOR Ready to Buy or Sell Real Estate? $150,000 934 28.25% 75.2 87.0 72.3 76.6 86.0 $150,001 $175,000 317 9.59% 83.2 90.8 80.5 84.0 87.7 $175,001 $250,000 523 15.82% 79.0 86.4 74.2 81.7 81.0 $250,001 and up 404 12.22% 92.2 139.7 91.1 81.7 123.9 Average Closed DOM: 80.7 93.0 75.3 81.0 103.0 Total Closed Units: 3,306 618 1859 735 94 Total Closed Volume: 506,446,010 64.62M 238.53M 167.65M 35.64M Reports produced and compiled by RE STATS Inc. Information is deemed reliable but not guaranteed. Does not reflect all market activity. pp. 6 Steve Reese 405-848-9944 steve@oklahomarealtors.com
  • 8. Monthly Inventory Analysis Data from the The Oklahoma Association of REALTORS® April 2012 Closed Sales as of May 12, 2012 Average List Price at Closing Report Produced on: May 15, 2012 Area Delimited by Entire OK State MLS - Condo/Town, Single-Family Property Type APRIL YEAR TO DATE (YTD) 2008 2009 2010 2011 2012 2008 2009 2010 2011 2012 158,352 152,454 151,978 150,006 145,887 144,358 145,183 145,025 145,150 143,277 1 Year 1 Year +4.19% +1.63% 2 Year 2 Year +9.10% +5.61% 5 YEAR MARKET ACTIVITY TRENDS 5yr APR AVG = 149K 3 MONTHS Average List Price 200,000 High F 149,802 Jun 2008 = 164,437 E Low B Nov 2008 = 136,250 M 155,439 100,000 A Average LPrice this R 3.76% month at 158,352, above the 5 yr APR A 158,352 P 0 Jun 2008 Dec 2008 Jun 2009 Dec 2009 Jun 2010 Dec 2010 Jun 2011 Dec 2011 average of 149,138 R 1.87% AVERAGE LIST PRICE OF CLOSED SALES & BEDROOMS DISTRIBUTION BY PRICE Distribution of Average List Price at Closing by Price Range % AVL$ 2 Beds 3 Beds 4 Beds 5 Beds+ $25,000 and less 129 3.90% 17,988 21,363 20,117 22,250 29,200 $25,001 $75,000 586 17.73% 52,116 54,478 55,154 55,778 56,975 $75,001 $100,000 380 11.49% 89,142 92,303 92,141 94,744 86,400 $100,001 Contact an experienced REALTOR Ready to Buy or Sell Real Estate? $150,000 937 28.34% 127,907 131,672 128,613 130,089 141,214 $150,001 $175,000 305 9.23% 163,752 164,364 166,625 167,461 167,757 $175,001 $250,000 542 16.39% 209,137 210,981 209,833 217,093 222,264 $250,001 and up 427 12.92% 406,629 365,450 366,950 397,908 625,394 Average List Price: $158,352 $109,415 $132,215 $235,107 $396,812 Total Closed Units: 3,306 618 1859 735 94 Total List Volume: 523,510,697 67.62M 245.79M 172.80M 37.30M Reports produced and compiled by RE STATS Inc. Information is deemed reliable but not guaranteed. Does not reflect all market activity. pp. 7 Steve Reese 405-848-9944 steve@oklahomarealtors.com
  • 9. Monthly Inventory Analysis Data from the The Oklahoma Association of REALTORS® April 2012 Closed Sales as of May 12, 2012 Average Sold Price at Closing Report Produced on: May 15, 2012 Area Delimited by Entire OK State MLS - Condo/Town, Single-Family Property Type APRIL YEAR TO DATE (YTD) 2008 2009 2010 2011 2012 2008 2009 2010 2011 2012 153,190 146,799 145,765 143,675 141,345 141,161 139,945 140,414 137,995 139,176 1 Year 1 Year +5.09% +2.17% 2 Year 2 Year +9.10% +5.48% 5 YEAR MARKET ACTIVITY TRENDS 5yr APR AVG = 144K 3 MONTHS Average Sold Price 200,000 High F 144,105 Jun 2008 = 159,237 E Low B Nov 2008 = 131,526 M 149,449 100,000 A Average SPrice this R 3.71% month at 153,190, above the 5 yr APR A 153,190 P 0 Jun 2008 Dec 2008 Jun 2009 Dec 2009 Jun 2010 Dec 2010 Jun 2011 Dec 2011 average of 144,095 R 2.50% AVERAGE SOLD PRICE OF CLOSED SALES & BEDROOMS DISTRIBUTION BY PRICE Distribution of Average Sold Price at Closing by Price Range % AVS$ 2 Beds 3 Beds 4 Beds 5 Beds+ $25,000 and less 154 4.66% 17,940 17,942 17,615 19,390 23,250 $25,001 $75,000 602 18.21% 51,918 50,905 52,727 50,301 48,750 $75,001 $100,000 372 11.25% 88,411 87,530 88,572 89,289 89,100 $100,001 Contact an experienced REALTOR Ready to Buy or Sell Real Estate? $150,000 934 28.25% 126,255 127,265 125,807 127,158 133,550 $150,001 $175,000 317 9.59% 162,771 160,884 162,791 164,001 162,721 $175,001 $250,000 523 15.82% 208,763 204,918 205,169 212,826 217,311 $250,001 and up 404 12.22% 398,110 342,259 350,480 384,477 595,205 Average Closed Price: $153,190 $104,567 $128,313 $228,088 $379,198 Total Closed Units: 3,306 618 1859 735 94 Total Closed Volume: 506,446,010 64.62M 238.53M 167.65M 35.64M Reports produced and compiled by RE STATS Inc. Information is deemed reliable but not guaranteed. Does not reflect all market activity. pp. 8 Steve Reese 405-848-9944 steve@oklahomarealtors.com
  • 10. Monthly Inventory Analysis Data from the The Oklahoma Association of REALTORS® April 2012 Closed Sales as of May 12, 2012 Average Percent of List Price to Selling Price Report Produced on: May 15, 2012 Area Delimited by Entire OK State MLS - Condo/Town, Single-Family Property Type APRIL YEAR TO DATE (YTD) 2008 2009 2010 2011 2012 2008 2009 2010 2011 2012 96.92% 96.76% 96.99% 96.64% 96.36% 96.20% 96.05% 95.69% 95.77% 95.58% 1 Year 1 Year +1.36% +0.49% 2 Year 2 Year +0.24% -0.33% 5 YEAR MARKET ACTIVITY TRENDS 5yr APR AVG=96.51% 3 MONTHS Average List/Sell Price 98 High F 95.80% May 2008 = 97.15% E Low B 97 Jan 2011 = 95.22% M 95.79% A 96 Average List/Sell this R -0.01% month at 96.99%, above the 5 yr APR A 96.99% P 95 Jun 2008 Dec 2008 Jun 2009 Dec 2009 Jun 2010 Dec 2010 Jun 2011 Dec 2011 average of 96.51% R 1.25% AVERAGE L/S% OF CLOSED SALES & BEDROOMS DISTRIBUTION BY PRICE Distribution of $avgmed L/S % by Price Range % AVL/S% 2 Beds 3 Beds 4 Beds 5 Beds+ $25,000 and less 154 4.66% 88.70% 87.01% 90.69% 88.78% 82.95% $25,001 $75,000 602 18.21% 96.48% 94.02% 98.41% 92.84% 87.03% $75,001 $100,000 372 11.25% 96.39% 95.31% 96.74% 95.59%103.79% $100,001 Contact an experienced REALTOR Ready to Buy or Sell Real Estate? $150,000 934 28.25% 98.16% 97.04% 97.90%101.42% 94.56% $150,001 $175,000 317 9.59% 97.92% 98.05% 97.87% 98.02% 96.98% $175,001 $250,000 523 15.82% 97.93% 97.38% 97.90% 98.11% 97.94% $250,001 and up 404 12.22% 96.84% 94.79% 96.49% 97.22% 96.67% Average List/Sell Ratio: 97.00% 94.75% 97.49% 97.69% 96.45% Total Closed Units: 3,306 618 1859 735 94 Total Closed Volume: 506,446,010 64.62M 238.53M 167.65M 35.64M Reports produced and compiled by RE STATS Inc. Information is deemed reliable but not guaranteed. Does not reflect all market activity. pp. 9 Steve Reese 405-848-9944 steve@oklahomarealtors.com
  • 11. Monthly Inventory Analysis Data from the The Oklahoma Association of REALTORS® April 2012 Inventory as of May 12, 2012 Market Summary Report Produced on: May 15, 2012 Area Delimited by Entire OK State MLS - Condo/Town, Single-Family Property Type Inventory Inventory Market Activity Market Activity New Listings Closed Sales 6,682 = 23.81% 3,306 = 10.53% Start Inventory Pending Sales 21,386 4,206 = 13.39% Total Inventory Other Off Market Units 2,507 = 7.98% 28,068 Volume Active Inventory $5,400,084,226 21,388 = 68.10% Absorption: Last 12 months, an Average of 3,025 Sales/Month APRIL Year To Date Active Inventory as of April 30, 2012 = 21,388 2011 2012 +/-% 2011 2012 +/-% Closed Sales 3,089 3,306 7.02% 9,802 11,489 17.21% Pending Sales 3,272 4,206 28.55% 11,626 14,557 25.21% New Listings 6,782 6,682 -1.47% 23,596 24,801 5.11% Average List Price 151,978 158,352 4.19% 150,006 152,454 1.63% Average Sale Price 145,765 153,190 5.09% 143,675 146,799 2.17% Average Percent of List Price to Selling Price 95.69% 96.99% 1.36% 95.58% 96.05% 0.49% Average Days on Market to Sale 90.60 80.69 -10.94% 92.35 87.86 -4.86% Monthly Inventory 24,892 21,388 -14.08% 24,892 21,388 -14.08% Months Supply of Inventory 9.19 7.07 -23.07% 9.19 7.07 -23.07% 2011 2011 APRIL MARKET 2012 AVERAGE PRICES 2012 New Listings Pending Listings List Price Sale Price 6,782 6,682 158,352 151,978 153,190 4,206 3,272 145,765 -1.47% +28.55% +4.19% +5.09% 2011 2011 INVENTORY 2012 AVERAGE L/S% & DOM 2012 Active Inventory Monthly Supply of Inventory % of List to Sale Price Days on Market to Sale 24,892 9.19 96.99% 90.60 21,388 7.07 95.69% 80.69 -14.08% -23.07% +1.36% -10.94% Reports produced and compiled by RE STATS Inc. Information is deemed reliable but not guaranteed. Does not reflect all market activity. pp. 10 Steve Reese 405-848-9944 steve@oklahomarealtors.com