
Empfohlen
Weitere ähnliche Inhalte
Ähnlich wie Axis Business Cycles Fund- NFO PPT.PDF
Ähnlich wie Axis Business Cycles Fund- NFO PPT.PDF (20)
Kürzlich hochgeladen
Kürzlich hochgeladen (20)
Axis Business Cycles Fund- NFO PPT.PDF
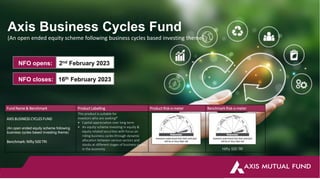
- 1. Axis Business Cycles Fund (An open ended equity scheme following business cycles based investing theme) Fund Name & Benchmark Product Labelling Product Risk-o-meter Benchmark Risk-o-meter AXIS BUSINESS CYCLES FUND (An open ended equity scheme following business cycles based investing theme) Benchmark: Nifty 500 TRI This product is suitable for investors who are seeking* • Capital appreciation over long term • An equity scheme investing in equity & equity related securities with focus on riding business cycles through dynamic allocation between various sectors and stocks at different stages of business cycles in the economy Nifty 500 TRI NFO opens: 2nd February 2023 NFO closes: 16th February 2023
- 2. Understanding a Business Cycle? Business cycles in an economy are typically characterized by the fluctuations in economic activity measured by real GDP growth and other macroeconomic variables During these ups and downs, individual companies and sectors often perform differently depending on various factors affecting their business A business cycle determines the fortunes of a company and by extension the performance of its stock price over the medium term A thematic fund targeting ‘Business Cycle investing’ aims to create wealth by identifying a portfolio of companies that are most suited to perform within a prevailing business cycle Phases of business cycle Expansion Peak Slowdown Trough Source: Axis MF Research. Chart is for illustrative purpose only 2
- 3. Trough Taper tantrum Slowdown Slowdown in the economy and first wave of the Covid 19 pandemic India’s Business Cycle A Lookback at India’s growth through a ‘business cycle’ lens Source: Bloomberg, Government of India, Axis MF Research. Data as on 31st October 2022 Past performance may or may not be sustained in the future. The trend line indicates MSCI Smallcap rebased to 100 on 31st October 2012. Segmentation into a business cycle is based on an internal evaluation of macro parameters. The Analysis should not be treated as a form of recommendation or investment advice. 60 70 80 90 100 110 120 130 140 150 160 Oct 12 Jan 13 Apr 13 Jul 13 Oct 13 Jan 14 Apr 14 Jul 14 Oct 14 Jan 15 Apr 15 Jul 15 Oct 15 Jan 16 Apr 16 Jul 16 Oct 16 Jan 17 Apr 17 Jul 17 Oct 17 Jan 18 Apr 18 Jul 18 Oct 18 Jan 19 Apr 19 Jul 19 Oct 19 Jan 20 Apr 20 Jul 20 Oct 20 Jan 21 Apr 21 Jul 21 Oct 21 Jan 22 Apr 22 Jul 22 Oct 22 Expansion/Peak Normal economic growth and revival of business confidence Expansion Post lockdown recovery and slow transformation to digitalization of the economy 3
- 4. Indicators of an Economic cycle Slowdown Peak Expansion Trough Economic Activity Credit Growth Capex Capacity utilization Interest rate Unemployment Rebounding Stabilizing Declining Rising Above Normal Above normal but falling Rising High Low Declining Rise in government capex Low Rising Rise in private capex Moderation in private capex Begins to grow Strong Declining Bottoming out Below normal Declining High No private capex, Rise in government capex Weak 4
- 5. Building a Cycle Driven Portfolio Typical business cycle funds, identifies sectors on the basis of the economic cycle Source: Bloomberg, Axis MF Research. Chart is for illustrative purposes only Past performance may or may not be sustained in the future. Segmentation into a business cycle is based on an internal evaluation of macro parameters. Sectors mentioned are for illustrative purposes only. The Analysis should not be treated as a form of recommendation or investment advice. Commodity cyclicals Oil, steel, gas, mining Financials Banks, insurers, real estate Growth Discretionary Goods, IT Growth defensives Support services, food retailers Value defensives Telecoms, pharma, utilities Industrial cyclicals Engineering, aerospace Consumer cyclicals Retailers, house builders 5
- 6. Investing - A Game of Identification Right place, right time critical to investing success The fund will endeavour to identify economic trends and sector specific cycles coupled with a bottom up stock specific approach to build a portfolio ECONOMIC CYCLE (TO IDENTIFY CYCLES IN MACRO DRIVEN SECTORS) SECTOR CYCLE (TO IDENTIFY SECTORS WITH OWN CYCLES DRIVEN BY INDUSTRY SPECIFIC FACTORS) Capacity Utilization Government Action Capital Availability Shareholder Value Pricing Efficiency External Factors Economic Capacity Consumer Sentiment Demand Dynamics 6
- 7. Why sector selection is critical? Favorable alpha* can be generated by picking the right sectors at right time Source: BSE, NIFTY Indices, Axis MF Research, Data for FY23TD as of 30th November 2022 Past performance may or may not be sustained in the future. BSE sectoral indices used as proxy for sectoral performance. Average of top 3 performing sectors; Average of bottom 3 performing sectors; NIFTY 50 performance for every financial year is considered for the above illustration. *Alpha is defined as the difference between fund returns and benchmark returns. Sectors mentioned are for illustrative purposes only -50% -30% -10% 10% 30% 50% 70% 90% 110% 130% FY12 FY13 FY14 FY15 FY16 FY17 FY18 FY19 FY20 FY21 FY22 FY23TD Top 3 sectors Bottom 3 sectors NIFTY 50 7
- 8. Sectors do not follow a fixed template Source: BSE, NIFTY Indices, Axis MF Research, Data for FY23TD as of 30th November 2022 Past performance may or may not be sustained in the future. BSE sectoral indices used as proxy for sectoral performance. Sectors mentioned are for illustrative purposes only. IT – Information Technology, FMCG – Fast Moving Consumer Goods FY12 FY13 FY14 FY15 FY16 FY17 FY18 FY19 FY20 FY21 FY22 FY23TD FMCG FMCG Capital Goods Pharma Cons Durables Metals Cons Durables Pharma Telecom Metals Power Capital Goods Auto Pharma Auto Cons Durables IT Oil & Gas Capital Goods Power Auto Auto Utilities Auto Pharma IT IT Auto FMCG Infra Power Utilities Power IT Metals FMCG Cons Durables Banks Pharma Capital Goods Oil & Gas Cons Durables Infra Infra Metals Realty Telecom Banks Infra Cons Durables Telecom Banks Auto Banks Banks Telecom Infra Capital Goods Realty Nifty IT Nifty Nifty IT Utilities Utilities Telecom Oil & Gas Utilities Infra IT Power Telecom Oil & Gas FMCG Nifty Nifty Realty Utilities Auto Capital Goods Power Capital Goods Telecom Nifty Realty Metals Telecom Banks Power Oil & Gas Nifty Oil & Gas Pharma Cons Durables Cons Durables Banks Infra Oil & Gas Power Pharma Capital Goods FMCG FMCG Pharma Nifty Infra Pharma Utilities Auto Banks Utilities Telecom Auto Nifty Banks FMCG Banks Oil & Gas Realty Oil & Gas Capital Goods Power FMCG Power FMCG Realty Capital Goods Nifty Cons Durables Nifty Utilities Power Telecom Utilities Realty Infra Nifty Auto Metals Realty Utilities Pharma Infra Realty Utilities Infra Infra Metals Pharma Metals IT Banks Oil & Gas Banks Oil & Gas Capital Goods Power Cons Durables Oil & Gas Capital Goods Telecom IT Realty IT Telecom Auto IT Metals Metals Realty Metals Realty IT Pharma Cons Durables Cons Durables FMCG FMCG Metals 8
- 10. The Current Context How We See India’s Business Cycle Today? 2000 - 2010 2020 - ++ 2010 - 2020 10 B2B+B2C Source: Axis MF Research. Picture is for illustrative purpose only. B2B – Business to Business; B2C – Business to Consumer; B2B + B2C – Business to Business to Consumer
- 11. B2B V/s B2C Investing Differences B2C companies typically have relatively a lower debt profile B2C companies typically have pricing power and stable margins B2B business models typically have cyclicality due to the overall demand environment B2B business can often be capital intensive businesses and might have longer gestation cycles 11 Source: Axis MF Research. For detailed Investment strategy please refer SID/KIM of the Scheme available on the website B2B – Business to Business; B2C – Business to Consumer
- 12. 1998-2002 2003 – 2005 2006 – 2008 2009 – 2012 2013 – 2020 2021 – 2024 • Lower commodity prices • NPA cycle was bottoming out • Real Estate slowdown • Early signs of commodity price increase • Electricity Act- Opening- up of power sector • Higher Government spend • Strong private participation in power, steel and cement • Commodity prices rise as China gains prominence • Pickup in residential real estate • Excess capacity build up post ’08-’09 crisis • Financial crises dents global risk appetite • Demand drops due to global slowdown and domestic policy paralysis • Lower commodity prices • Excess supply across sectors • Deleveraging & market Consolidation takes place • Balance sheet quality improves across large companies • Government supports private sector through targeted incentives Global Outlook Negative Positive Very Positive Negative Positive Start of an upcycle led by: Improving domestic demand and consumption patterns Improving business prospects drive investments in business capacity Government support by way of PLI incentives and public infrastructure spending Expansion Peak Slowdown Slowdown & Trough Expansion Trough Capex cycle in India Multiple drivers for investment cycle pick-up Government Capex is the Central & State Government spend CAGR during the specific periods, Source: RBI, Ministry of Commerce, Spark Research. Data as on 30th November 2022 12
- 13. Factors Expected To Unleash Capex Upcycle Total Capex as a share of GDP is expected to leapfrog to 36% of GDP FY27 from 29.5% of GDP in FY22 48% Low Corporate debt/ GDP 18.4% Low Household debt to GDP Decadal high sales in real estate and Best affordability in 25 years Private consumption is 7.5% above pre-pandemic levels Export share has risen to 2.2% Pickup in Supply-side Government Reforms Impaired loans at 10-year low Capacity utilization @78.4 above long term average Source: Morgan Stanley, Data as of 31st October 2022 Past performance may or may not be sustained in the future. The above graph is used to explain the concept and is for illustration purpose only and should not used for development or implementation of an investment strategy. Mse – Morgan Stanley estimates 13
- 14. Key focus areas 4 Pronged Investment Opportunity Integrating India in global supply chain Made In India Rapid infrastructure ramp up Focusing on de-carbonisation 14
- 15. Integrating India in global supply chain Focus area #1 This implies that the next decade may be led by the manufacturing sector, just as the 2000s were led by the emergence of new service sectors. Textiles Pharmaceuticals & Related Chemicals (ex Pharma) & Products Automobiles & its Components Food Processing Metals & its Products Computers, Electronics & Optical Products Market Size US$18.6bn CAGR: 11.8% Share: 8.1% Market Size US$29.3bn CAGR: 10.3% Share: 8.6% Market Size US$35.8bn CAGR: 9.1% Share: 10.5% Market Size US$39.6bn CAGR: 9% Share: 11.6% Market Size US$47.7bn CAGR: 5.8% Share: 14% Market Size US$8.4bn CAGR: 7.8% Share: 1.7% Market Size US$8.4bn CAGR: 8.3% Share: 2.5% Existing Prospective Source: CSO, CMIE Axis MF Research. Note: Market size is as of F21 and CAGR is for F2012-2021. Share is the share of respective sectors in manufacturing GVA; Past performance may or may not be sustained in the future. Sectors mentioned are for illustrative purposes only. The Analysis should not be treated as a form of recommendation or investment advice. CAGR – Compounded annual growth rate 15 India’s export market share is expected to rise from 2.2%(2021) to 4.5% by 2031
- 16. Made In India Sectors exposed to this theme: Chemicals Machinery and Equipment Auto Ancillaries Electronics India is holistically addressing issues around production. Focusing on indigenization, launching PLI scheme may provide potential to lower fiscal & current account deficits Source: CSO, AxisMF Research; Past performance may or may not be sustained in the future. Sectors mentioned are for illustrative purposes only. The Analysis should not be treated as a form of recommendation or investment advice. Indigenization - Indigenization is the act of making something more native 16 Focus area #2 Rise in domestic demand for high value imported items Import substitution & Product indigenization Research & Development Building technological & manufacturing capabilities Government incentives (Production Linked Incentives) Creating a manufacturing ecosphere to meet domestic & international demand
- 17. Defence - Strong thrust toward local manufacturing Focus area #2 F25 defence production 404 435 454 477 467 551 148 148 128 92 146 119 142 154 174 159 173 193 741 789 811 791 846 927 1750 0 400 800 1,200 1,600 2,000 F17 F18 F19 F20 F21 F22 F25 target Defence Public Sector Undertakings Ordnance Factory Board Other Public Sector Undertakings/Joint Ventures Defence Private Companies Rs bn The government has plans to procure Rs 5 lakh crore of military equipment domestically over the next 5 years. It is currently also reviewing all 'Buy Global' (termed by the government) products for indigenization. The target is to reach zero imports and 90% of equipment approvals over the last two years have been for 'Make in India' products. Source: Ministry of Defence, Axis MF Research. Data as on 31st October 2022 17
- 18. Rapid infrastructure ramp up Focus area #3 Multilateral funding to infra Government Infra focus through NIP, NMP, PM Gatishakti & others. Source: BofA, Axis MF Research. Data as on 31st October 2022. Past performance may or may not be sustained in the future. Sectors mentioned are for illustrative purposes only. The Analysis should not be treated as a form of recommendation or investment advice 18
- 19. Advantage → Heavy Industries Focus area #3 Multilateral funding to infra Sectors exposed to this theme: Industrials Railways Electricals Metals Utilities Historically in a capex upcycle, Industrial sector's margins double, working capital reduces by 20x, ROEs triple and valuation multiples quadruples Source: BofA Global Research Company - L&T, Past performance may or may not be sustained in the future. Sectors mentioned are for illustrative purposes only. Note: *FY21 other income inflated on back of extraordinary cash buffers maintained by L&T Adjusted to normal run rate by assuming 50% post tax other income. 19
- 20. Focus on de-carbonization Focus area #4 India now aligned with large economies on de-carbonization efforts CO2 emission/ GDP & carbon neutral targets 0.00 0.20 0.40 0.60 0.80 1.00 1.20 1.40 USA (RHS) China (LHS) Japan (RHS) Germany (RHS) India (RHS) UK (RHS) 1971 2000 2018 2030 Target 2050 2060 2050 2045 2070 2050 Source: BofA Global Research, Past performance may or may not be sustained in the future. Sectors mentioned are for illustrative purposes only. The Analysis should not be treated as a form of recommendation or investment advice. RHS – Right Hand Side; LHS – Left Hand Side; 20
- 21. Focus on de-carbonization Focus area #4 Sectors exposed to this theme: Renewables Industrials Automation Business theme Energy efficiency Emission reduction Renewable Energy Sub-theme Industries Buildings Power gensets Highly polluting industries Increasing share of renewables in electricity mix Key products/ service Motors, drives, robots, sensors, automation and control systems Building Management system, retrofits CPCB IV complaint diesel gensets, natural gas gensets Electrostatic precipitators, Flue-gas desulfurizers, waste-heat recovery systems EPC, design and O&M Automation and control systems High energy materials and power density Equipment providers in transmission and distribution Past performance may or may not be sustained in the future. Sectors mentioned are for illustrative purposes only. The Analysis should not be treated as a form of recommendation or investment advice 21
- 22. Introducing Axis Business Cycles Fund (An open ended equity scheme following business cycles based investing theme) 22
- 23. Business Cycle Investing A Case for Conviction Driven Investing Forward Looking Investing Need For High Conviction Sell Discipline • Focus on Medium term Growth triggers • Identify opportunities to benefit from earnings upgrades and/or valuation re-rating • Meaningful allocation to sectors basis research indicators • Always Plan for Contingency - Nothing goes to Plan. Plan to diversify • Restructure portfolios once industry cycle plays out • Transition to new portfolio basis a changing business cycle 23
- 24. Investment Approach Our Approach to Business Cycle Investing Economic Cycle (Macro Factors) Sector Cycle (Industry Specific Factors) Growth and inflation Monetary and Fiscal policy Regulatory changes Capex and consumer spending Industry analysis Company position Competitive advantage Growth prospects Top down approach + Bottom up approach = Hybrid approach to investing Looking for cyclical opportunities with a medium term view Sector selection will be based on nature of sectors 24 For detailed Investment strategy please refer SID/KIM of the Scheme available on the website
- 25. Why Axis Business Cycles Fund? Hybrid Approach: Mix of Top Down & Bottom Up Approach Dynamic theme Style: Quality focused Flexibility for a more aggressive stance in terms of sector over/ under weight No Market cap bias 25 For detailed Investment strategy please refer SID/KIM of the Scheme available on the website
- 26. Fund Facts Name Axis Business Cycles Fund Fund Manager Mr. Ashish Naik and Mr. Hitesh Das (for Foreign Securities) Benchmark NIFTY 500 TRI Category Thematic Minimum Application Rs. 5,000 and in multiples of Rs. 1 thereafter NFO Period 2nd Feb 2023 – 16th Feb 2023 For detailed Investment strategy please refer SID/KIM of the Scheme available on the website 26
- 27. Axis Strategies Current Portfolio Allocation is based on the prevailing market conditions and is subject to changes depending on the fund manager’s view of the equity markets. ^Open-ended Equity-Linked Savings Scheme with a 3-year lock in. The bubbles in the chart are proportionate to their sizes respectively. Market caps are defined as per SEBI regulations as below: a. Large Cap: 1st -100th company in terms of full market capitalization. b. Mid Cap: 101st -250th company in terms of full market capitalization. c. Small Cap: 251st company onwards in terms of full market capitalization. Please refer annexure for type of scheme for each of the above-mentioned schemes. The right strategy for the right time Axis Bluechip Fund Axis Long Term Equity Fund^ Axis Flexi Cap Fund Axis Growth Opportunities Fund Axis Focused 25 Fund Axis Business cycles Fund Axis Midcap Fund Axis Small Cap Fund Large Cap ELSS Flexi cap Large & Midcap Focused Business cycles theme Midcap Smallcap Active Returns Active Risk Looking for cyclical opportunities with a medium term view 27
- 28. Product Labelling *Investors should consult their financial advisers if in doubt about whether the product is suitable for them Fund Name & Benchmark Product Labelling Product Risk-o-meter Benchmark Risk-o-meter AXIS BUSINESS CYCLES FUND (An open ended equity scheme following business cycles based investing theme) Benchmark: Nifty 500 TRI This product is suitable for investors who are seeking* • Capital appreciation over long term • An equity scheme investing in equity & equity related securities with focus on riding business cycles through dynamic allocation between various sectors and stocks at different stages of business cycles in the economy *The product labelling assigned during the New Fund Offer is based on internal assessment of the Scheme Characteristics or model portfolio and the same may vary post NFO when actual investments are made Nifty 500 TRI 29
- 29. Product Labelling *Investors should consult their financial advisers if in doubt about whether the product is suitable for them 29
- 30. Product Labelling *Investors should consult their financial advisers if in doubt about whether the product is suitable for them 29
- 31. Disclaimer and Risk Factors Data as on 30th Nov 2022. Disclaimer: Past performance may or may not be sustained in the future. Sector(s) / Stock(s) / Issuer(s) mentioned above are for the purpose of disclosure of the portfolio of the Scheme(s) and should not be construed as recommendation. The fund manager(s) may or may not choose to hold the stock mentioned, from time to time. Investors are requested to consult their financial, tax and other advisors before taking any investment decision(s). Sector(s) / Stock(s) / Issuer(s) mentioned above are for the purpose of disclosure of the portfolio of the Scheme(s) and should not be construed as recommendation. The fund manager(s) may or may not choose to hold the stock mentioned, from time to time. Statutory Details: Axis Mutual Fund has been established as a Trust under the Indian Trusts Act, 1882, sponsored by Axis Bank Ltd. (liability restricted to Rs. 1 Lakh). Trustee: Axis Mutual Fund Trustee Ltd. Investment Manager: Axis Asset Management Co. Ltd. (the AMC). Risk Factors: Axis Bank Limited is not liable or responsible for any loss or shortfall resulting from the operation of the scheme. This document represents the views of Axis Asset Management Co. Ltd. and must not be taken as the basis for an investment decision. Neither Axis Mutual Fund, Axis Mutual Fund Trustee Limited nor Axis Asset Management Company Limited, its Directors or associates shall be liable for any damages including lost revenue or lost profits that may arise from the use of the information contained herein. No representation or warranty is made as to the accuracy, completeness or fairness of the information and opinions contained herein. The AMC reserves the right to make modifications and alterations to this statement as may be required from time to time. Mutual Fund Investments are subject to market risks, read all scheme related documents carefully. 30
- 32. Thank You