- The document discusses characterizing the surface chemistry of ferrihydrite by determining proton stability constants and binding site concentrations.
- Ferrihydrite and silica-enriched ferrihydrite were synthesized and subjected to acid-base titrations to determine proton stability constants (pKa values).
- The pKa values determined from modeling the titration data ranged from 1.71 to 8.28 for ferrihydrite and were lower (3.01 to 7.66) for silica-enriched ferrihydrite, indicating lower reactivity in the presence of silica.
- The study provides insights into how ferrihydrite may have contributed to trace metal sequestration
1. Introduction
The Great oxidation event occurred ~2.4
billion years ago, and fundamentally
changed our atmosphere, allowing for
the evolution and existence of life as we
know it (Konhauser et al. 2011; Partin et
al 2013). The GOE and other
Precambrian events are manifested in
changing trace element concentrations
in the rock record (Konhauser et al.
2009). Of particular interest are banded
iron formations (BIF) which are unique to
the Precambrian as they are iron and
silica rich marine deposits. The primary
minerals are likely composed of ferric
hydroxide, greenalite, and siderite
(Konhauser et al., 2009).
Fig 1. BIF in Karijini National Park, Aus. Photo by
In Australien http://www.in-australien.com/karijini-
national-park_1018032
Ferrihydrite is an early formed hydrous
iron oxide characterized by a small
crystal size and low structural order. This
often results in subsequent transform to
more stable crystalline oxides like
hematite (Cornell, 2003). It is commonly
represented by the simplified chemical
formula is commonly represented as
Fe3(OH)3.
Fh is amphoteric, and surface hydroxyl
groups may deprotonate or absorb extra
protons depending on the pH.
This research focuses on characterizing
the surface chemistry of ferrihydrite by
determining proton stability constants
and the concentration of binding sites. It
provides a better understanding of how
ferrihydrite may have contributed to the
sequestration of trace metals into BIF.
Methods
Conclusions
Ferrihydrite Surface Complexation Modelling: Implications in Banded Iron
Formation Studies
Brazzoni, N., Robbins, L., Alam, S., Warchola, T., Alessi, D., Konhauser, K.
University of Alberta
References
Ferrihydrite synthesis methods were
adapted from Schwertmann and Cornell
(2000). Two versions of Fh were
synthesized, (i) silica free and (ii) silica
enriched. To form ferrihydrite ~20g of
ferric nitrate was added to ~500mL of 18.2
MΩ water and the pH adjusted to just
below 7 using 1M NaOH. For the silica
enriched version, sodium metasilicate was
added the NaOH prior to pH adjustments.
The resultant mineral was rinsed daily
with 18.2 MΩ for one week until a final pH
of approximately 5 was reached.
Acid-Base Titrations were performed in a
background electrolyte of 0.56M NaNO3.
Titrations utilized 0.1M NaOH and HCl.
Argon gas was used to purge the system,
and maintain an anoxic, carbonate free
system throughout the titration.
Raw titration data was processed in excel
and then modelled with FITEQL. Variables
defined in the system and necessary for
the calculation of pKa’s include:
C(a)–concentration of acid
(2MHClxv)/total v
C(b) – concentration of base (1M
NaOHxv) /total v
Fig. 2 – The variation of the four lines in
comparison to the blank titration shows the fh
has a buffering potential
After the success of the titrations was
determined by the plot above, the titration
data was then entered into FITEQL to
determine the best fitting surface
complexation model and corresponding
pKa values
1. Cornell, R. M., & Schwertmann, U. (2003). The iron oxides : structure,
properties, reactions, occurrences, and uses. Weinheim : Wiley-VCH,
2003.
2. Konhauser, K. O., Pecoits, E., Lalonde, S. V., Papineau, D., Nisbet, E.
G., Barley, M. E., Arndt, N. T., Zahnle, K., & Kamber, B. S. (2009).
Oceanic nickel depletion and a methanogen famine before the Great
Oxidation Event. Nature, 458(7239), 750-753.
3. Konhauser, K.O., Lalonde, S.V., Planavsky, N.J., Pecoits, E., Lyons,
T.W., Mojzsis, S.J., et al. (2011) Aerobic bacterial pyrite oxidation and
acid rock drainage during the Great Oxidation Event. Nature,
478(7369), 369-373.
4. Partin, C.A., Lalonde, S.V., Planavsky, N.J., Bekker, A., Rouxel, O.J.,
Lyons, T.W., Konhauser, K.O., (2013). Uranium in iron formations and
the rise of atmospheric oxygen. Chemical Geology, 362, 82-90.
5. Smith, D. S., & Ferris, F. G. (2001). Proton binding by hydrous ferric
oxide and aluminum oxide surfaces interpreted using fully optimized
continuous pKa spectra. Environmental science & technology, 35(23),
4637-4642.
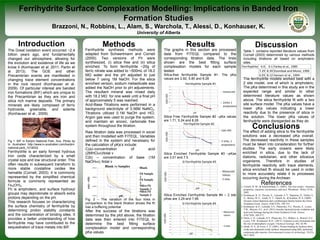
The graphs in this section are processed
data from FITEQL compared to the
corresponding titration data. The lines
shown are the best fitting surface
complexation models for each sample
tested.
Silica-free ferrihydrite Sample #1- The pKa
values are 2.82, 5.80 and 8.28
Silica Free Ferrihydrite Sample #2 –pKa values
are 1.71, 5.24 and 8.28
Silica Enriched Ferrihydrite Sample #3 –pKas
are 3.01 and 7.5
Silica Enriched Ferrihydrite Sample #4 – 2 site
pKas are 3.29 and 7.66
The effect of adding silica to the ferrihydrite
solutions was a decreased pKa overall.
The decreased reactivity in these samples
must be taken into consideration for further
studies. The early oceans were likely
enriched in silica, due to the lack of
diatoms, radiolarian, and other siliceous
organisms. Therefore in studies of
ferrihydrite reactivity with trace elements,
silica enriched fh should be used in order
to more accurately relate it to processes
occurring during the Archean.
Results
-0.0030
-0.0020
-0.0010
0.0000
0.0010
0.0020
0.0030
0.0040
0.0050
0 2 4 6 8 10 12
c(a)-c(b)
pH
Ferrihydrite Sample #2
c(a)-c(b)
2 sites, 1
amphoteric
-0.0020
-0.0010
0.0000
0.0010
0.0020
0.0030
0.0040
0.0050
0.0060
0.0070
0 2 4 6 8 10 12
c(a)-c(b)
pH
Si Ferrihydrite Sample #3
Measured
Values
2 sites
-0.0020
-0.0010
0.0000
0.0010
0.0020
0.0030
0.0040
0.0050
0.0060
0.0070
0.0080
0 2 4 6 8 10 12
c(a)-c(b)
pH
Si Ferrihydrite Sample #4
Measured
values
2 sites
Discussion
Table 1. contains reported literature values from
Cornell (2003) determined by various methods
including titrations all based on amphoteric
sites.
The ferrihydrite models worked best with a
2 site model, one of which is amphoteric.
The pKa determined in this study are in the
expected range and similar to other
determined literature values as shown
above. The silica ferrihydrite fit with a two
site surface model. The pKa values have a
lower pKa values indicating a lower
reactivity due to the presence of silica in
the solution. The lower pKa values of
ferrihydrite were disregarded as they do
Ferrihydrite 6.6 9.1 Farley et al., 1985
7.29 8.39 Dzombak and Morel, 1990
6.93 8.12 Hansen et al., 1994
-0.002
-0.001
0
0.001
0.002
0.003
0.004
0.005
0.006
0 2 4 6 8 10 12
c(a)-c(b)
pH
Ferrihydrite Sample #1
measured
2sites 1
amphoteric
-2.50E-03
5.00E-04
3.50E-03
6.50E-03
0 2 4 6 8 10 12
c(a)-c(b)
pH
Blank vs Samples Blank
Fh Sample
1
Fh Sample
2
Silica Fh
Sample 3
Silica Fh
Sample 4