Weitere ähnliche Inhalte
Ähnlich wie Class participation (20)
Kürzlich hochgeladen (20)
Class participation
- 1. Information Systems Education Journal (ISEDJ) 19 (4)
ISSN: 1545-679X August 2021
©2021 ISCAP (Information Systems and Computing Academic Professionals) Page 77
https://isedj.org/; https://iscap.info
Class Participation and Student Performance:
A Follow-up Study
Ernst Bekkering
bekkerin@nsuok.edu
Ted Ward
ward68@nsuok.edu
Department of Mathematics and Computer Science
Northeastern State University
Tahlequah, OK 74464
Abstract
Student attendance in class, and participation while in class, are predictors of student performance. Last
year, we reported on a new measure combining class attendance and attentiveness while in class and
used this participation score as a predictor of student performance on the final exam in the class. This
year, we follow up by analyzing data for four classes in the Fall semester of 2019. In each class, and for
the four classes combined, we found a statistically significant relationship between participation and
score on the final exam.
Keywords: participation, attendance, attentiveness, distraction, student performance
1. INTRODUCTION
Traditionally, education has taken place in face-
to-face environments. The advent of distance
education started in the 19th
century with
correspondence courses, followed by television-
based courses in the mid-20th
century, but the
real growth of distance education occurred with
the development of the Internet in the late 20th
and early 21st
century (Visual Academy, 2020).
The Internet enabled three forms of interactivity:
interaction with content, with the instructor, and
with other learners (Craig, 2020). Class
participation is becoming more important than
pure class attendance alone (Büchele, 2020).
When most classes were still taught face to face,
participation was measured in terms of coming to
class (attendance). Romer (1993) advocated
mandatory attendance based on the strong
relationship between attendance and
performance. Other researchers examined the
usefulness of different participatory metrics
(hand raising, response cards, clickers). In the
Internet environment, measures of attendance
focused on time spent on the course site, clicks,
and pages visited. Participation shifted to making
meaningful contributions in email conversations
and on discussion boards. In general, research
shows that active class participation improves
subjective and objective student performance.
Students perceive that they do better in class,
and objective criteria like Grade Point Average
(Credé, Roch, & Kieszczynky, 2010) and scores
on final exams confirm this (Duncan, Kenworthy,
Mcnamara, & Kenworthy, 2012; Irwin, Burnett, &
McCarron, 2018).
Over the last twenty years the possibilities for
virtual delivery have blossomed as networks have
greatly improved in speed, stability, and ease of
connectivity. In 1998, dial-up internet was still
limited to 56Kbps and connections had to be set
up for each session. Broadband started to replace
dial-up in the early 2000s and provided always-
on connections in the Mbps range. Currently,
fiber-optic broadband provides speeds in the
Gigabit range. Additionally, users are no longer
limited to wired connections. Wireless
connections are now fast enough to be useful in
- 2. Information Systems Education Journal (ISEDJ) 19 (4)
ISSN: 1545-679X August 2021
©2021 ISCAP (Information Systems and Computing Academic Professionals) Page 78
https://isedj.org/; https://iscap.info
education, and content management systems like
Blackboard are optimized for use on mobile
devices. A variety of class formats has emerged
based on the different combinations of time and
place.
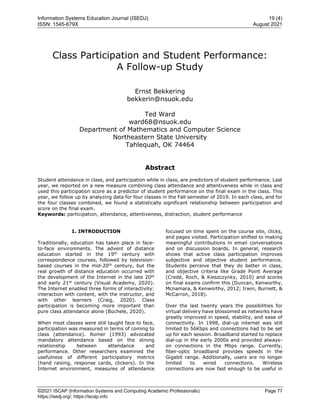
Figure 1- Course Delivery Formats (Daniels &
Pethel, 2014)
Using different combinations of time and place
depicted in Figure 1, our regional university in the
Southwest offers face to face courses (same
place, synchronous), Interactive
Videoconferencing and Virtual Class Meetings
(different place, synchronous), fully online
courses over Blackboard (different place,
asynchronous), and blended courses delivered
partly face to face and partly asynchronously over
Blackboard (Northeastern State University,
2019). Using videoconferencing software is useful
in the traditional classroom too. Presentation
tools include traditional blackboards,
whiteboards, digital whiteboards, overhead
projectors, ceiling-mounted classroom
projectors, and computer lab monitors. These are
not easily visible to all students in the classroom.
Using the Equivalent Visibility Rule, students in
the back of the class are better off using individual
computer screens (Feierman, 2020). When
teaching in computer labs, using
videoconferencing software is therefore a good
alternative over projection to a screen in front of
the class. Offering multiple modes of attending
may increase attendance for students who might
otherwise miss class for employment reasons
(Lukkarinen, Koivukangas, & Seppala, 2016;
Paisey & Paisey, 2004), while simultaneously
meeting the preferences of those who prefer real-
life lectures over web-based lecture technologies
(Gysbers, Johnston, Hancock, & Denyer, 2011).
Francescucci and Rohani (2019) compared face to
face and virtual classes for the same Marketing
course and found no differences in outcomes
between them.
This paper builds on previous research (Bekkering
& Ward, 2019), where we compared two classes.
We used videoconferencing to stream the
instructor desktop to the lab computers and used
the interactive tools to communicate
electronically. In a lecture-oriented class, we
found a significant relationship between class
participation and scores on final exams. In the
skills-based programming class, the lecture
component was not a determinant but attendance
in the associated labs was. In the classes used for
this study, like before, we used data in the
professional version of our videoconferencing
software to objectively measure student
participation as the product of attendance
(coming to class) and attentiveness (paying
attention while in class). Student performance
was again measured by the score on
comprehensive final exams, and the results
analyzed for four courses in the 2019 Fall
semester separately and collectively. The
contribution of this research is the use of a single
measure of class participation, without
interpretation by the researchers.
2. LITERATURE REVIEW
The research literature has supported that class
attendance improves student performance
(Coldwell, Craig, Paterson, & Mustard, 2008;
Landin & Pérez, 2015; Teixeira, 2016; Yakovlev &
Kinney, 2008; Landin & Pérez, 2015; Zorio-Grima
& Merello, 2020). It is considered a better student
success predictor than SAT, high school GPA,
study habits, study skills (Credé et al., 2010),
self-financing, and hours worked (Devadoss &
Foltz, 1996). The effect may not be completely
linear. Durden & Ellis (1995) found that students
could miss up to four classes without negative
effect.
Beyond attendance, active participation makes a
difference, in both synchronous and
asynchronous conditions (Duncan et al., 2012;
Nieuwoudt, 2020). Mean course grades are
higher for students who actively engage in
discourse than those who just do the
work(Beaudoin, 2002).
New communication technologies have had
positive and negative effects on participation.
Some technologies, like social media, are used for
class purposes (Kraushaar & Novak, 2010).
Whether this helps or hinders students, depends
on how they are used. Using Facebook for class
may have a positive effect, while using it for
socializing may be negative (Junco, 2012a).
Overall, using social media for class purposes
may not be effective (Lau, 2017).
Whether students attend locally or remotely may
not matter (much). Meta-analysis for
asynchronous education showed slightly better
student performance in distance education
- 3. Information Systems Education Journal (ISEDJ) 19 (4)
ISSN: 1545-679X August 2021
©2021 ISCAP (Information Systems and Computing Academic Professionals) Page 79
https://isedj.org/; https://iscap.info
courses (Allen, Mabry, Mattrey, Bourhis,
Titsworth, & Burrell, 2004) , but synchronous
education may be equivalent to the physical
classroom (Mullen, 2020). With a wide variation
in effect, positives may cancel out negatives
especially when students have additional tasks to
perform (Bernard, Abrami, Lu, Borkhovski, Wade,
Wozney, Wallet, Fiset, & Huang, 2004). When the
task load is identical, for local and distant
students in a videoconferencing setting, student
performance is the same (MacLaughlin,
Supernaw, & Howard, 2004). Interaction may
make the difference: distance education with
collaborative discussions is more effective than
independent study only (Lou, Bernard, & Abrami,
2006). Just recording lectures and posting notes
online may not meet students’ needs (Gysbers et
al., 2011). For synchronous online session,
special attention tracking tools may be available.
Zoom had an attention tracking feature until April
2020, when it was removed for security and
privacy reasons (Yuan, 2020). Cisco Webex still
provides group and individual attentiveness
indicators and participant attention reports (Cisco
Webex, 2018)
Class Participation
Active participation in class can take multiple
forms. In face to face classes, participation can
mean the use of response cards and hand-raising
(Christle & Schuster, 2003; Gardner, Heward, &
Grossi, 1994; Narayan, Heward, Gardner,
Courson, & Omness, 1990). Sometimes, special
tools like clickers were used (Stowell & Nelson,
2007), but also cellphones for text messaging
(Nkhoma, Thomas, Nkhoma, Sriratanaviriyaku,
Truong, & Vo, 2018; L.-C. C. Wang & Morgan,
2008). In the online environment, the initial
measurement of participation in asynchronous
classes might be with pages visited, tools used,
messages accessed, discussions posted, and
email contacts (Coldwell et al., 2008; Douglas &
Alemanne, 2007; Romero, Lopez, Luna, &
Ventura, 2013). Some novel tools like location
and Bluetooth data have been used (Kassarnig,
Bjerre-Nielsen, Mones, Lehmann, & Lassen,
2017), as has spyware installed on student
laptops to check browsing and application use
(Kraushaar & Novak, 2010), but these are more
for research and not for day-to-day teaching.
In the digital environment, all modern Learning
Management Systems (LMS) provide some form
of videoconferencing to enable virtual class
meetings. Moodle has a Videoconference Edition
(Moodle, Inc., 2019). Blackboard offers the
Blackboard Collaborate module (BlackBoard Inc,
2019). Canvas includes the Conferences tool
(Canvas LMS Community, 2019). Zoom is not an
LMS, but it is often used in education and can be
integrated in Blackboard, Moodle, and other
platforms.
Modern videoconferencing software provide
multiple interaction tools. Some of them are
based on their physical counterparts, such as
voice communication and virtual hand raising.
Information can be shared through programs
such as PowerPoint, sharing of the presenter’s
desktop, whiteboards, slideshows, and sharing of
online videos. Collaboration tools include chat
messages, annotation and drawing tools on
shared desktops, and transfer of control over
mouse and keyboard. These tools transform the
shared view into two-way communication
between instructor and students (SJSU, 2018)
Finally, some forms of interaction scale better
than others. Multiple choice quizzes work well for
any size audience, but voice discussions are best
limited to small groups (Garner, 2018).
Student Performance
Once we assume that class attendance and class
participation influence how well students do in
class, we need to select a way to measure their
performance. Multiple metrics have been used to
measure student performance. Most frequently
used are readily-available items like course
grades (Beaudoin, 2002; Durden & Ellis, 1995;
Kassarnig et al., 2017; Teixeira, 2016), term GPA
(Wang, Harari, Hao, Zhou, & Campbell., 2015),
cumulative GPA (Lau, 2017), self-reported GPA
(Kirschner & Karpinski, 2010), GPA obtained from
registrars (Junco, 2012a), course credits
(Giunchiglia, Zeni, Gobbi, Bignotti, & Bison,
2018), scores on final exams (Duncan et al.,
2012; Lukkarinen et al., 2016) and finishing the
course (Coldwell et al., 2008; Junco, 2012b).
Occasionally, pre-tests and post-tests (Omar,
Bhutta, & Kalulu, 2009), student ranking (Felisoni
& Godoi, 2018) or multi-item scales are used (Yu,
Tian, Vogel, & Chi-Wai Kwok, 2010).
On the other hand, a significant number of studies
rely on self-report by students (Junco & Cotten,
2011), including self-report of GPA and hours
spent studying (Kirschner & Karpinski, 2010).
However, some caution must be used since self-
report may not be as reliable (Kuncel, Crede, &
Thomas, 2005)
Multitasking
Using computers, cell phones, and other
technology does present new problems. McCoy
(2016) reported that students used digital
devices 11.43 times per school day. More than
25% of effective class time may be spent on the
- 4. Information Systems Education Journal (ISEDJ) 19 (4)
ISSN: 1545-679X August 2021
©2021 ISCAP (Information Systems and Computing Academic Professionals) Page 80
https://isedj.org/; https://iscap.info
phone (Kim, Kim, Kim, Kim, Han, Lee, Mark, &
Lee, 2019). Students often alternate between
class-related and non-class-related computer use
(Fried, 2008; Grace-Martin & Gay, 2001;
Hembrooke & Gay, 2003; Janchenko, Rodi, &
Donohoe, 2018). Cell phone use among college
students is becoming an addiction (Roberts, Yaya,
& Manolis, 2014).
Multitasking in class has evolved with the
technology of the day. When laptops entered the
classroom, instant messaging and web browsing
were major distractions (Fox, Rosen, & Crawford,
2009; Hembrooke & Gay, 2003). Later, Facebook
became a major distractor (Kirschner & Karpinski,
2010). Now, mobile phones provide yet another
source of distraction (Chen & Yan, 2016; Harman
& Sato, 2011). Cell phone applications include
WhatsApp (Ahad & Lim, 2014), Snapchat and
Instagram (Griffin, 2014). The negative effect of
using cellphones is especially high when it takes
place in class (Felisoni & Godoi, 2018), and lower
performing students are especially at risk (Beland
& Murphy, 2016; Chiang & Sumell, 2019). Beland
and Murphy (2016) also found significant
improvement in high stakes exam scores after
mobile phones were banned.
Multitasking with technology negatively affects
participation and student performance,
subjectively (Junco & Cotten, 2011) and
objectively (Amez, Vujic, De Marex, & Baert,
2020b; Amez & Baert, January 1, 2020a; Junco &
Cotten, 2012; Kates, Wu, & Coryn, 2018).
Students do not necessarily recognize the
negative effect. In a study of Malaysian university
students, respondents felt that they performed
better as Facebook usage increased (Ainin,
Naqshbandi,Moghavvemi, & Jaafar, 2015).
The general research consensus holds that
multitasking does have a negative effect on
student performance (Bellur, Nowak, & Hull,
2015; Burak, 2012; Junco & Cotten, 2012;
Kraushaar & Novak, 2010; Kuznekoff, Munz, &
Titsworth, 2015; MacLaughlin et al., 2004),
although the causality has not yet been
established (van der Schuur, Baumgartner,
Sumter, & Valkenburg, 2015). Controlled
experiments show that actual performance may
be the same, but the time to achieve it is longer
(Bowman, Levine, Waite, & Genfron, 2010;
Rubinstein, Meyer, & Evans, 2001). While some
studies fail to demonstrate differences between
performance of cognitive tasks with and without
distraction, they do show decreased efficiency of
information processing (End, Worthman,
Mathews,& Wetterau, 2010) and increased
memory errors (Rubinstein et al., 2001).
3. METHODOLOGY
Data for the four classes in this study were
automatically recorded by the videoconferencing
software. Data points were join time, leave time,
and attentiveness score for each student in each
course. Students were allowed to enter the class
before it started, and before the instructor. If
students entered early, the official start time of
the class was used. The instructor used the full
class period and closed the session after the class
was officially over. If students left after the class
was officially over, the official closing time was
used. Network interruptions or equipment
problems occasionally dropped students from the
session, and they could immediately rejoin the
class without instructor intervention. The
attentiveness score reflected the percentage of
time that the focus of the student’s computer was
on the desktop shared by the instructor. The
syllabus explained the attentiveness statistic and
instructed the students to maximize the class
window to avoid accidental low scores. All
lectures were recorded and generally available
online after two hours and use of pen and paper
for notes was suggested. Students had to use a
computer with mouse and keyboard and keep the
camera on at all times.
Participation scores were calculated each week by
multiplying the attendance and attentiveness
scores. For instance, if a student was 10 minutes
late in a 50-minute class, attendance was 80%.
Likewise, if a student had the shared instructor
desktop in focus only half of the time, the
attentiveness score was 50%. If a student was 10
minutes late and did not keep the shared desktop
in focus half the time, the participation score was
40%. At the end of the week, each day’s
participation score was posted to the gradebook
for the class. For days when students were
disconnected one or more times, the sum of the
products for the partial sessions was used. At the
end of the semester, students with average
participation below 80% lost one letter grade, and
two letter grades if below 60%.
The four classes in the study involved two face to
face classes in computer labs and two Virtual
Class Meetings. The university defines Virtual
Class Meetings as follows: “Virtual class meeting
courses allow students to use their home or
university computer to attend class at designated
times” (Northeastern State University, 2019). In
other words, both formats are synchronous but
virtual class meetings are location-independent
and face to face classes are not. The same
videoconferencing software was used in all
classes. Face to face classes were taught in
- 5. Information Systems Education Journal (ISEDJ) 19 (4)
ISSN: 1545-679X August 2021
©2021 ISCAP (Information Systems and Computing Academic Professionals) Page 81
https://isedj.org/; https://iscap.info
computer labs, did not use overhead projectors or
whiteboards, and streamed the session directly to
the students’ lab computers. All applications were
shared on the instructor’s desktop. Various
features of the videoconferencing software were
used to increase student participation. Students
could use annotation and drawing tools on the
shared desktop to ask questions, post comments,
and make annotations anonymously. The Chat
feature was used to post questions and
comments, and answers to instructor questions.
Finally, having students take over control over
mouse and keyboard was used to have students
demonstrate their understanding on the common
desktop. Regardless of online or local delivery, all
these techniques were used to lesser or greater
extent. Students in the face-to-face classes were
also allowed to participate remotely to maximize
attendance. No records were kept regarding local
or remote attendance for face-to-face classes.
The first class, CS 3403 Data Structures, is one of
the core classes in the curriculum. It was taught
as a virtual class meeting twice a week for 75
minutes. The course covered common data
structures and algorithms in Computer Science
and used Python programming projects to
illuminate the concepts. The final exam consisted
of a comprehensive multiple-choice test worth
40% of the course grade. Twenty-nine students
started the course, and 24 took the final exam.
The second class, CS 3643 Programming for
Cyber Security, was an elective class taught as a
face-to-face class twice weekly for 75 minutes.
The course covered general cybersecurity
concepts and problems and used virtual machines
with Python programs to illustrate the material.
The final exam consisted of a comprehensive
multiple-choice test worth 40% of the course
grade. Fifteen students started the course, and
11 took the final exam.
The third class, CS 4203 Software Engineering, is
another core class in the CS curriculum. It was
taught as a virtual class meeting thrice weekly for
50 minutes. The course covered the development
process including analysis, modeling, and testing.
UML models were developed with online software,
and testing was done with a scripting language.
The final exam consisted of a comprehensive
multiple-choice test worth 40% of the course
grade. Twenty-nine students started the course,
and 28 took the final exam.
The final class, CS 4223 Game Programming, was
an elective class taught face to face. The class
met twice weekly for 75 minutes. The course was
heavily project based with hands-on projects due
every two weeks and used Unity with Visual
Studio to develop the games. The final exam was
an in-class programming project worth 30% of
the course grade. Twenty-seven students started
the course, and 22 students took the final exam.
One student got a zero score for the final exam
for failure to follow final exam instructions.
Activity Reports
The videoconferencing software can generate
multiple reports. For this study, we used the
details report which can list each login for each
course meeting for a period of up to a month.
Data include topic, join time, leave time, and the
“attentiveness score.” Attentiveness in this
context was defined as the percent of time that
the shared Zoom window was in focus. If a
student was logged in but used another
application, this did not contribute to
attentiveness. If students got disconnected
during class and connected again, each partial
session would have its own attentiveness score.
Unfortunately, the attentiveness score was
removed from all reports during the COVID-19
crisis (Yuan, 2020).
4. SAMPLE STATISTICS
As usual in Computer Science, the majority of
students were male, traditional full-time students
in their late teens and early twenties who finished
the course and took the final. Details are listed in
Table 1.
course female male
CS3403 7 22
non-traditional 1
final 1
traditional 6 22
final 6 17
no_final 5
CS3643 1 14
traditional 1 14
final 1 9
no_final 5
CS4203 7 22
non-traditional 1
final 1
traditional 6 22
final 6 21
no_final 1
CS4223 5 22
non-traditional 1
no_final 1
traditional 4 22
final 3 18
no_final 1 4
Table 1 - Sample Statistics
- 6. Information Systems Education Journal (ISEDJ) 19 (4)
ISSN: 1545-679X August 2021
©2021 ISCAP (Information Systems and Computing Academic Professionals) Page 82
https://isedj.org/; https://iscap.info
Class attendance and attentiveness data were
automatically recorded by Zoom, since students
were required to log in to the class sessions.
Participation scores were posted on the
Blackboard gradebook every two weeks, and
students who scored low on participation early in
the course received an email with separate data
for attendance and attentiveness to explain why
their scores were low. Since we measured the
influence of conditions in for each student in one
course only, we used the final exam in the course
to measure performance. The final multiple-
choice exam was posted using the course delivery
system and scores automatically calculated.
Questions and answers were reviewed based on
less than 50% correct answers, and no questions
were found to be incorrectly stated.
5. ANALYSIS
The data was analyzed in anonymous form. Daily
Activity Reports were downloaded in CSV files and
copied to one sheet of a spreadsheet, final exam
scores were downloaded from the Blackboard
gradebook and copied to another sheet, and a
third sheet was used as a lookup table with
student names and random numbers between
1111 and 9999.
Next, we corrected for absences which were not
reflected in the activity reports. All absences
received a zero score for participation, as no time
was spent in class. Absences were not corrected
for excused absences, such as attendance of
events sanctioned by Academic Affairs. Students
who did not finish the class and did not take the
final exam were included with a zero score for the
final. Final exam scores were standardized to a
percent of possible points by dividing the actual
score by the maximum of 300 or 400 points.
Student names in the activity reports and the final
exam scores sheet were replaced with the
random numbers, and linked in a fourth sheet
combining the student participation with their
grades on the final exam. This sheet with random
numbers, participation score, and standardized
final exam score was exported in CSV format and
imported in SPSS.
The data were analyzed with linear regression at
the course level and at the semester level (all
courses combined). Descriptive statistics show
that some students reached perfect participation
and perfect scores on the final exams. Appendix
A lists the descriptive statistics first at the
semester level, and then at the course level.
Linear regression at the semester level, with all
courses combined, showed a statistically
significant relationship between the independent
participation variable and the dependent
performance variable. The level of significance
was .000 for the regression and .000 for
participation. The R Square statistic was strong at
.648, indicating that 64% of the variance in
student performance was explained by student
participation. Since we used only one
independent variable, the unstandardized
coefficient for participation was reviewed. At a
level of 1.094, each percent increase in
participation was related to about a percent of
increase in performance. Appendix B shows the
output of the semester level analysis.
At the course level, linear regression showed a
similar result. The significance for regression in
each course was .000, indicating a statistically
significant relationship. The R Square statistic
varied between a low of .465 and a high of .933.
Coefficients for participation were all slightly
above 1, again indicating that each percent
increase in participation was related to about a
percent increases in performance. Appendix C
shows the output of the course level analysis.
6. CONCLUSIONS AND RECOMMENDATIONS
Based on these results, it appears that class
participation, defined as the combination of
coming to class and paying attention while there,
is a good predictor of student performance. This
would appear to be a no-brainer, but in this age
where students often work significant hours
and/or have family obligations, the importance of
coming to class and spending this time
productively should not be underestimated. Using
the participation statistic as part of the total
number of points in the course can also help
motivate students to change behavior in a
positive manner. When students notice that the
participation score is low, it is easy to see whether
this is due to being distracted in class, or not
coming to class altogether. Since the
videoconferencing software does not record
attentiveness when students are not in class, the
percent time in class is a perfect indicator for
attendance and the attentiveness score a good
indicator for focus while they are there.
This does not mean that attentiveness as
measured by computer focus on the shared
desktop is perfect. Students can keep other
applications open, especially on dual monitors,
and quickly click back and forth. The
videoconferencing software only samples focus
- 7. Information Systems Education Journal (ISEDJ) 19 (4)
ISSN: 1545-679X August 2021
©2021 ISCAP (Information Systems and Computing Academic Professionals) Page 83
https://isedj.org/; https://iscap.info
every 30 seconds. They can also use cell phones
to play, and dependent on the positioning of the
phone, this may not be very apparent even when
the camera is on and students have to keep their
face in view. Conversely, students could log with
their cell phone and play on the computer if use
of cell phones is not prohibited. Students could
use two computers. It is even possible to record
short videos with a webcam, leaving the meeting,
and running the video as a background in a loop
(Clark, 2020). Fortunately, there are many
communication tools instructors can use to
facilitate active participation. Chat boxes record
messages by name, annotation pointers have
names, students can have designated areas on
the shared desktop to respond, individual
students can be called on to take over control of
mouse and keyboard, and so on.
Unfortunately, attentiveness tracking is no longer
available in the videoconferencing software used.
During the CoVid-19 pandemic, use of the
software increased dramatically. This made it an
attractive target for outsiders to intrude and
disrupt the session with unwanted graphic
content. In response, the software provider
introduced several security and privacy
measures, which unfortunately included the
removal of the attentiveness score we used.
Maybe it will be available in the future, and maybe
in selected versions or subscription levels. In the
meantime, this analysis demonstrates the benefit
of not only attending class but paying attention
while there. Future avenues for research include
analyzing the data with attendance and
attentiveness as separate independent variables.
Due to the loss of attentiveness tracking, we also
need to develop alternative measures of
measuring active participation while in class and
encouraging students to decrease lurking
behaviors.
In the current educational climate with infectious
diseases affecting course delivery mechanisms,
we expect an accelerated move towards more
flexible class formats. Courses do not have to be
purely face to face, and students should be able
to seamlessly switch between face to face and
virtual formats. Allowing students to switch
between face to face and synchronous virtual
attendance will help to keep attendance high, and
measures to increase two-way communication
between instructors and students will help to
maintain the quality of instruction.
7. REFERENCES
Ahad, A. D., & Lim, S. M. A. (2014). Convenience
or Nuisance?: The ‘WhatsApp’ Dilemma.
Procedia - Social and Behavioral Sciences,
155, 189–196.
Ainin, S., Naqshbandi, M. M., Moghavvemi, S., &
Jaafar, N. I. (2015). Facebook usage,
socialization and academic performance.
Computers & Education, 83, 64–73.
Allen, M., Mabry, E., Mattrey, M., Bourhis, J.,
Titsworth, S., & Burrell, N. (2004).
Evaluating the Effectiveness of Distance
Learning: A Comparison Using Meta-
Analysis. Journal of Communication, 54(3),
402–420.
Amez, S., & Baert, S. (January 1, 2020a).
Smartphone use and academic
performance: A literature review.
International Journal of Educational
Research, 103, 101618.
Amez, S., Vujic, S., De Marez, L., & Baert, S.
(2020b). Smartphone Use and Academic
Performance: First Evidence from
Longitudinal Data (SSRN Scholarly Paper ID
3521679). Social Science Research Network.
Beaudoin, M. F. (2002). Learning or lurking?
Tracking the ‘“invisible”’ online student.
Internet and Higher Education, 5(2), 147–
155.
Bekkering, E., & Ward, T. (2019, November 6).
Class Participation and Student
Performance: A Tale of Two Courses. 2019
Proceedings of the EDSIG Conference.
EDSIG Conference on Information Systems
& Computing Education, Cleveland, OH.
Beland, L.-P., & Murphy, R. (2016). Ill
Communication: Technology, distraction &
student performance. Labour Economics,
41, 61–76.
Bellur, S., Nowak, K. L., & Hull, K. S. (2015).
Make it our time: In class multitaskers have
lower academic performance. Computers in
Human Behavior, 53, 63–70.
Bernard, R. M., Abrami, P. C., Lou, Y.,
Borokhovski, E., Wade, A., Wozney, L.,
Wallet, P. A., Fiset, M., & Huang, B. (2004).
How Does Distance Education Compare with
Classroom Instruction? A Meta-Analysis of
the Empirical Literature. Review of
Educational Research, 74(3), 379–439.
BlackBoard Inc. (2019). Blackboard Collaborate.
https://www.blackboard.com/online-
- 8. Information Systems Education Journal (ISEDJ) 19 (4)
ISSN: 1545-679X August 2021
©2021 ISCAP (Information Systems and Computing Academic Professionals) Page 84
https://isedj.org/; https://iscap.info
collaborative-learning/blackboard-
collaborate.html
Bowman, L. L., Levine, L. E., Waite, B. M., &
Gendron, M. (2010). Can students really
multitask? An experimental study of instant
messaging while reading. Computers &
Education, 54(4), 927–931.
Büchele, S. (2020). Evaluating the link between
attendance and performance in higher
education: The role of classroom
engagement dimensions. Assessment &
Evaluation in Higher Education, 6(2), 1–19.
Burak, L. (2012). Multitasking in the University
Classroom. International Journal for the
Scholarship of Teaching and Learning, 6(2),
1–12.
Canvas LMS Community. (2019). What are
Conferences?
https://community.canvaslms.com/docs/D
OC-10738
Chen, Q., & Yan, Z. (2016). Does multitasking
with mobile phones affect learning? A
review. Computers in Human Behavior, 54,
34–42.
Chiang, E. P., & Sumell, A. J. (2019). Are your
students absent, not absent, or present?
Mindfulness and student performance. The
Journal of Economic Education, 50(1), 1–16.
Christle, C. A., & Schuster, J. W. (2003). The
Effects of Using Response Cards on Student
Participation, Academic Achievement, and
On-Task Behavior During Whole-Class, Math
Instruction. Journal of Behavioral Education,
12(3), 147–165.
Cisco Webex. (2018, July 12). Webex—Track
Participant Attention in Cisco Webex
Training. https://help.webex.com/en-
us/st7tr1/Track-Participant-Attention-in-
Cisco-Webex-Training
Clark, B. (2020, March 23). People are skipping
Zoom meetings by looping videos of
themselves paying attention. The Next Web.
https://thenextweb.com/corona/2020/03/2
3/adapt-evolve-overcome/
Coldwell, J., Craig, A., Paterson, T., & Mustard, J.
(2008). Online Students: Relationships
between Participation, Demographics and
Academic Performance. 6(1), 10.
Craig, R. (2020). A Brief History (And Future) Of
Online Degrees. Forbes.
https://www.forbes.com/sites/ryancraig/20
15/06/23/a-brief-history-and-future-of-
online-degrees/
Credé, M., Roch, S. G., & Kieszczynka, U. M.
(2010). Class Attendance in College: A Meta-
Analytic Review of the Relationship of Class
Attendance With Grades and Student
Characteristics. Review of Educational
Research, 80(2), 272–295.
Daniels, T., & Pethel, M. (2014, December 8).
Computer Mediated Instruction—Emerging
Perspectives on Learning, Teaching and
Technology.
http://epltt.coe.uga.edu/index.php?title=Co
mputer_Mediated_Instruction
Devadoss, S., & Foltz, J. (1996). Evaluation of
Factors Influencing Student Class
Attendance and Performance. American
Journal of Agricultural Economics, 78(3),
499–507.
Douglas, I., & Alemanne, N. D. (2007). Measuring
student participation and effort. IADIS
International Conference on Cognition and
Exploratory Learning in Digital Age, Algarve,
Portugal.
Duncan, K., Kenworthy, A. L., Mcnamara, R., &
Kenworthy, D. A. (2012). The Effect of
Synchronous and Asynchronous
Participation on Performance in Online
Accounting Courses. Accounting Education,
21(4), 431–449.
Durden, G. C., & Ellis, L. V. (1995). The Effects of
Attendance on Student Learning in Principles
of Economics. The American Economic
Review, 85(2), 343–346.
End, C. M., Worthman, S., Mathews, M. B., &
Wetterau, K. (2010). Costly Cell Phones: The
Impact of Cell Phone Rings on Academic
Performance. Teaching of Psychology,
37(1), 55–57.
Feierman, A. (2020, April 30). Equivalent
Visibility and The 4/6/8 Rules—Choosing the
right Display Size For Each Classroom.
Projector Reviews.
https://www.projectorreviews.com/articles-
guides/equivalent-visibility-and-the-4-6-8-
rules-choosing-the-right-display-size-for-
each-classroom/
Felisoni, D. D., & Godoi, A. S. (2018). Cell phone
usage and academic performance: An
experiment. Computers & Education, 117,
175–187.
Fox, A. B., Rosen, J., & Crawford, M. (2009).
Distractions, Distractions: Does Instant
Messaging Affect College Students’
Performance on a Concurrent Reading
- 9. Information Systems Education Journal (ISEDJ) 19 (4)
ISSN: 1545-679X August 2021
©2021 ISCAP (Information Systems and Computing Academic Professionals) Page 85
https://isedj.org/; https://iscap.info
Comprehension Task? CyberPsychology &
Behavior, 12(1), 51–53.
Francescucci, A., & Rohani, L. (2019). Exclusively
Synchronous Online (VIRI) Learning: The
Impact on Student Performance and
Engagement Outcomes. Journal of
Marketing Education, 41(1), 60–69.
Fried, C. B. (2008). In-class laptop use and its
effects on student learning. Computers &
Education, 50(3), 906–914.
Gardner, R., Heward, W. L., & Grossi, T. A.
(1994). Effects of Response Cards on
Student Participation and Academic
Achievement: A Systematic Replication with
Inner-City Students During Whole-Class
Science Instruction. Journal of Applied
Behavior Analysis, 27(1), 63–71.
Garner, B. (2018, April 6). Distance Learning
Methods Which Scale: A Review of the
Literature. 2018 Proceedings of the
Information Systems Education Conference.
ISECON, San Antoinio, Texas.
Giunchiglia, F., Zeni, M., Gobbi, E., Bignotti, E., &
Bison, I. (2018). Mobile social media usage
and academic performance. Computers in
Human Behavior, 82, 177–185.
Grace-Martin, M., & Gay, G. (2001). Web
Browsing, Mobile Computing and Academic
Performance. Journal of Educational
Technology & Society, 4(3), 95–107.
Griffin, A. (2014). Technology Distraction in the
Learning Environment. SAIS 2014
Proceedings, 10.
Gysbers, V., Johnston, J., Hancock, D., & Denyer,
G. (2011). Why do Students Still Bother
Coming to Lectures, When Everything is
Available Online? International Journal of
Innovation in Science and Mathematics
Education, 19(2).
Harman, B. A., & Sato, T. (2011). Cell Phone Use
and Grade Point Average Among
Undergraduate University Students. College
Student Journal, 45(3), 544–549.
Hembrooke, H., & Gay, G. (2003). The laptop and
the lecture: The effects of multitasking in
learning environments. Journal of
Computing in Higher Education, 15(1), 46–
64.
Irwin, N., Burnett, K. M., & McCarron, P. A.
(2018). Association between attendance and
overall academic performance on a module
within a professional pharmacy degree.
Currents in Pharmacy Teaching and
Learning, 10(3), 396–401.
Janchenko, G., Rodi, A., & Donohoe, M. J. (2018).
Impact of computers in the classroom
environment—A distraction or an essential
tool? Issues in Information Systems, 19(4),
6.
Junco, R. (2012a). Too much face and not enough
books: The relationship between multiple
indices of Facebook use and academic
performance. Computers in Human
Behavior, 28(1), 187–198.
Junco, R. (2012b). In-class multitasking and
academic performance. Computers in
Human Behavior, 28(6), 2236–2243.
Junco, R., & Cotten, S. R. (2011). Perceived
academic effects of instant messaging use.
Computers & Education, 56, 370–378.
Junco, R., & Cotten, S. R. (2012). No A 4 U: The
relationship between multitasking and
academic performance. Computers &
Education, 59(2), 505–514.
https://doi.org/10.1016/j.compedu.2011.1
2.023
Kassarnig, V., Bjerre-Nielsen, A., Mones, E.,
Lehmann, S., & Lassen, D. D. (2017). Class
attendance, peer similarity, and academic
performance in a large field study. PLOS
ONE, 12(11), 15.
Kates, A. W., Wu, H., & Coryn, C. L. (2018). The
effects of mobile phone use on academic
performance: A meta-analysis. Computers &
Education, 127, 107–112.
Kim, I., Kim, R., Kim, H., Kim, D., Han, K., Lee,
P. H., Mark, G., & Lee, U. (2019).
Understanding smartphone usage in college
classrooms: A long-term measurement
study. Computers & Education, 141,
103611.
Kirschner, P. A., & Karpinski, A. C. (2010).
Facebook® and academic performance.
Computers in Human Behavior, 26(6),
1237–1245.
Kraushaar, J. M., & Novak, D. C. (2010).
Examining the Affects of Student
Multitasking With Laptops During the
Lecture. Journal of Information Systems
Education, 21(2), 241–251.
Kuncel, N. R., Credé, M., & Thomas, L. L. (2005).
The Validity of Self-Reported Grade Point
Averages, Class Ranks, and Test Scores: A
Meta-Analysis and Review of the Literature.
Review of Educational Research, 75(1), 63–
- 10. Information Systems Education Journal (ISEDJ) 19 (4)
ISSN: 1545-679X August 2021
©2021 ISCAP (Information Systems and Computing Academic Professionals) Page 86
https://isedj.org/; https://iscap.info
82.
https://doi.org/10.3102/003465430750010
63
Kuznekoff, J. H., Munz, S., & Titsworth, S. (2015).
Mobile Phones in the Classroom: Examining
the Effects of Texting, Twitter, and Message
Content on Student Learning.
Communication Education, 64(3), 344–365.
Landin, M., & Pérez, J. (2015). Class attendance
and academic achievement of pharmacy
students in a European University. Currents
in Pharmacy Teaching and Learning, 7(1),
78–83.
Lau, W. W. F. (2017). Effects of social media
usage and social media multitasking on the
academic performance of university
students. Computers in Human Behavior,
68, 286–291.
Lou, Y., Bernard, R. M., & Abrami, P. C. (2006).
Media and Pedagogy in Undergraduate
Distance Education: A Theory-Based Meta-
Analysis of Empirical Literature. Educational
Technology Research and Development,
54(2), 141–176.
Lukkarinen, A., Koivukangas, P., & Seppälä, T.
(2016). Relationship between Class
Attendance and Student Performance.
Procedia - Social and Behavioral Sciences,
228, 341–347.
MacLaughlin, E. J., Supernaw, R. B., & Howard,
K. A. (2004). Impact of Distance Learning
Using Videoconferencing Technology on
Student Performance. American Journal of
Pharmaceutical Education, 68(3), 58.
Moodle, Inc. (2019). Moodle plugins directory:
Video Conference. Activities: Video
Conference.
https://moodle.org/plugins/mod_videoconf
erence
Mullen, C. A. (2020). Does modality matter? A
comparison of aspiring leaders’ learning
online and face-to-face. Journal of Further
and Higher Education, 44(5), 670–688.
Narayan, J. S., Heward, W. L., Gardner, R.,
Courson, F. H., & Omness, C. K. (1990).
Using response cards to increase student
participation in an elementary classroom.
Journal of Applied Behavior Analysis, 23(4),
483–490.
Nieuwoudt, J. E. (2020). Investigating
synchronous and asynchronous class
attendance as predictors of academic
success in online education. Australasian
Journal of Educational Technology, 36(3),
15–25.
Nkhoma, C. A., Thomas, S., Nkhoma, M. Z.,
Sriratanaviriyakul, N., Truong, T. H., & Vo,
H. X. (2018). Measuring the impact of out-
of-class communication through instant
messaging. Education+ Training, 60(4),
318–334.
Northeastern State University,. (2019). Academic
Information—Northeastern State
University—Acalog ACMSTM
. Academic
Information.
http://catalog.nsuok.edu/content.php?catoi
d=19&navoid=661
Omar, A., Bhutta, M. K. S., & Kalulu, D. (2009).
Assessment of Student Outcomes in
Management Information Systems Online
Course Participation. 10.
Paisey, C., & Paisey, N. J. (2004). Student
attendance in an accounting module—
Reasons for non-attendance and the effect
on academic performance at a Scottish
University. Accounting Education, 13, 39–
53.
Roberts, J., Yaya, L., & Manolis, C. (2014). The
invisible addiction: Cell-phone activities and
addiction among male and female college
students. Journal of Behavioral Addictions,
3(4), 254–265.
Romer, D. (1993). Do Students Go to Class?
Should They? Journal of Economic
Perspectives, 7(3), 167–174.
Romero, C., López, M.-I., Luna, J.-M., & Ventura,
S. (2013). Predicting students’ final
performance from participation in on-line
discussion forums. Computers & Education,
68, 458–472.
Rubinstein, J. S., Meyer, D. E., & Evans, J. E.
(2001). Executive control of cognitive
processes in task switching. Journal of
Experimental Psychology: Human Perception
and Performance, 27(4), 763–797.
SJSU. (2018, May 14). Zoom Features and Use
Cases. ECampus.
http://www.sjsu.edu/ecampus/teaching-
tools/zoom/features/index.html
Stowell, J. R., & Nelson, J. M. (2007). Benefits of
Electronic Audience Response Systems on
Student Participation, Learning, and
Emotion. Teaching of Psychology, 34(4),
253–258.
Teixeira, A. A. C. (2016). The impact of class
absenteeism on undergraduates’ academic
- 11. Information Systems Education Journal (ISEDJ) 19 (4)
ISSN: 1545-679X August 2021
©2021 ISCAP (Information Systems and Computing Academic Professionals) Page 87
https://isedj.org/; https://iscap.info
performance: Evidence from an elite
Economics school in Portugal. Innovations in
Education and Teaching International,
53(2), 1–13.
van der Schuur, W. A., Baumgartner, S. E.,
Sumter, S. R., & Valkenburg, P. M. (2015).
The consequences of media multitasking for
youth: A review. Computers in Human
Behavior, 53, 204–215.
Visual Academy. (2020, July 15). The History of
Online Schooling. OnlineSchools.Org.
https://www.onlineschools.org/visual-
academy/the-history-of-online-schooling/
Wang, L.-C. C., & Morgan, W. R. (2008). Student
Perceptions of Using Instant Messaging
Software to Facilitate Synchronous Online
Class Interaction in a Graduate Teacher
Education Course. Journal of Computing in
Teacher Education, 25(1), 15–21.
Wang, R., Harari, G., Hao, P., Zhou, X., &
Campbell, A. T. (2015). SmartGPA: How
Smartphones Can Assess and Predict
Academic Performance of College Students.
Proceedings of the 2015 ACM International
Joint Conference on Pervasive and
Ubiquitous Computing, 295–306.
https://doi.org/10.1145/2750858.2804251
Yakovlev, P., & Kinney, L. (2008). Additional
Evidence on the Effect of Class Attendance
on Academic Performance. Atlantic
Economic Journal, 36(4), 493.
Yu, A. Y., Tian, S. W., Vogel, D., & Chi-Wai Kwok,
R. (2010). Can learning be virtually boosted?
An investigation of online social networking
impacts. Computers & Education, 55(4),
1494–1503.
Yuan, E. (2020, April 2). A Message to Our Users.
Zoom Blog. https://blog.zoom.us/a-
message-to-our-users/
Zorio-Grima, A., & Merello, P. (2020). Class-
attendance and Online-tests Results:
Reflections for Continuous Assessment.
Journal of Teaching in International
Business, 31(1), 75–97.
https://doi.org/10.1080/08975930.2019.16
98394
- 12. Information Systems Education Journal (ISEDJ) 19 (4)
ISSN: 1545-679X August 2021
©2021 ISCAP (Information Systems and Computing Academic Professionals) Page 88
https://isedj.org/; https://iscap.info
APPENDIX A: DESCRIPTIVE STATISTICS
Descriptive Statistics
N Minimum Maximum Mean
participation 100 0.5% 100.0% 77.075%
standardized as % of max score possible 100 0.0% 100.0% 67.790%
Valid N (listwise) 100
Descriptive Statistics
course N Minimum Maximum Mean
2019Fall-CS3403 participation 29 7.0% 100.0% 74.162%
standardized as % of max score possible 29 0.0% 96.0% 65.655%
Valid N (listwise) 29
2019Fall-CS3643 participation 15 0.5% 90.3% 60.993%
standardized as % of max score possible 15 0.0% 90.0% 56.500%
Valid N (listwise) 15
2019Fall-CS4203 participation 29 45.6% 98.9% 86.510%
standardized as % of max score possible 29 0.0% 100.0% 81.638%
Valid N (listwise) 29
2019Fall-CS4223 participation 27 6.4% 98.3% 79.004%
standardized as % of max score possible 27 0.0% 100.0% 61.481%
Valid N (listwise) 27
- 13. Information Systems Education Journal (ISEDJ) 19 (4)
ISSN: 1545-679X August 2021
©2021 ISCAP (Information Systems and Computing Academic Professionals) Page 89
https://isedj.org/; https://iscap.info
APPENDIX B: COMBINED COURSES
Variables Entered/Removeda
Model
Variables
Entered Variables Removed Method
1 participationb
. Enter
a. Dependent Variable: standardized as % of max score possible
b. All requested variables entered.
Model Summary
Model R R Square Adjusted R Square Std. Error of the Estimate
1 .805a
.648 .644 18.7685%
a. Predictors: (Constant), participation
ANOVAa
Model Sum of Squares df Mean Square F Sig.
1 Regression 63501.016 1 63501.016 180.270 .000b
Residual 34521.074 98 352.256
Total 98022.090 99
a. Dependent Variable: standardized as % of max score possible
b. Predictors: (Constant), participation
Coefficientsa
Model
Unstandardized Coefficients
Standardized
Coefficients
t Sig.
95.0% Confidence Interval for B
B Std. Error Beta Lower Bound Upper Bound
1 (Constant) -16.496 6.552 -2.518 .013 -29.498 -3.493
participation 1.094 .081 .805 13.426 .000 .932 1.255
a. Dependent Variable: standardized as % of max score possible
- 14. Information Systems Education Journal (ISEDJ) 19 (4)
ISSN: 1545-679X August 2021
©2021 ISCAP (Information Systems and Computing Academic Professionals) Page 90
https://isedj.org/; https://iscap.info
APPENDIX C: SEPARATE COURSES
Variables Entered/Removeda
course Model
Variables
Entered
Variables
Removed Method
2019Fall-CS3403 1 participationb
. Enter
2019Fall-CS3643 1 participationb
. Enter
2019Fall-CS4203 1 participationb
. Enter
2019Fall-CS4223 1 participationb
. Enter
a. Dependent Variable: standardized as % of max score possible
b. All requested variables entered.
Model Summary
course Model R R Square
Adjusted R
Square
Std. Error of the
Estimate
2019Fall-CS3403 1 .845a
.714 .703 17.6498%
2019Fall-CS3643 1 .966a
.933 .928 9.7440%
2019Fall-CS4203 1 .731a
.535 .518 12.4119%
2019Fall-CS4223 1 .682a
.465 .443 26.4172%
a. Predictors: (Constant), participation
- 15. Information Systems Education Journal (ISEDJ) 19 (4)
ISSN: 1545-679X August 2021
©2021 ISCAP (Information Systems and Computing Academic Professionals) Page 91
https://isedj.org/; https://iscap.info
ANOVAa
course Model Sum of Squares df Mean Square F Sig.
2019Fall-CS3403 1 Regression 20989.648 1 20989.648 67.379 .000b
Residual 8410.903 27 311.515
Total 29400.552 28
2019Fall-CS3643 1 Regression 17175.696 1 17175.696 180.899 .000b
Residual 1234.304 13 94.946
Total 18410.000 14
2019Fall-CS4203 1 Regression 4781.484 1 4781.484 31.038 .000b
Residual 4159.464 27 154.054
Total 8940.948 28
2019Fall-CS4223 1 Regression 15144.015 1 15144.015 21.700 .000b
Residual 17446.726 25 697.869
Total 32590.741 26
a. Dependent Variable: standardized as % of max score possible
b. Predictors: (Constant), participation
Coefficientsa
course Model
Unstandardized
Coefficients
Standardized
Coefficients
t Sig.
95.0% Confidence Interval for
B Std. Error Beta Lower Bound Upper Bound
2019Fall-CS3403 1 (Constant) -19.653 10.897 -1.803 .082 -42.012 2.706
participation 1.150 .140 .845 8.208 .000 .863 1.438
2019Fall-CS3643 1 (Constant) -5.520 5.253 -1.051 .312 -16.868 5.828
participation 1.017 .076 .966 13.450 .000 .854 1.180
2019Fall-CS4203 1 (Constant) -34.376 20.951 -1.641 .112 -77.364 8.613
participation 1.341 .241 .731 5.571 .000 .847 1.835
2019Fall-CS4223 1 (Constant) -30.553 20.400 -1.498 .147 -72.568 11.463
participation 1.165 .250 .682 4.658 .000 .650 1.680
a. Dependent Variable: standardized as % of max score possible