Weitere ähnliche Inhalte
Ähnlich wie Expenses, Sales & Stock Loss Feedback Example
Ähnlich wie Expenses, Sales & Stock Loss Feedback Example (20)
Expenses, Sales & Stock Loss Feedback Example
- 1. Actual Budget Bud Var Var %
Total
Encumbrance
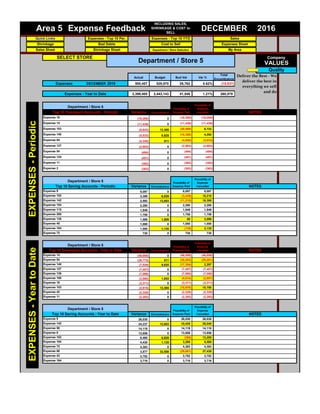
DECEMBER 2016 500,407 529,970 29,762 5.62% (15,537)
3,399,400 3,443,143 41,546 1.21% 260,579
Variance Encumbrance
(16,285) 0 (16,285) (16,285)
(11,439) 0 (11,439) (11,439)
(6,643) 13,365 (20,008) 6,722
(5,533) 9,825 (15,358) 4,292
(4,345) 511 (4,856) (3,833)
(2,903) 0 (2,903) (2,903)
(494) 0 (494) (494)
(451) 0 (451) (451)
(382) 0 (382) (382)
(363) 0 (363) (363)
Variance Encumbrance
8,097 0 8,097 8,097
3,389 6,829 (3,439) 10,218
2,592 13,803 (11,210) 16,395
2,280 0 2,280 2,280
1,949 0 1,949 1,949
1,758 0 1,758 1,758
1,589 1,509 80 3,098
1,000 0 1,000 1,000
1,000 1,135 (135) 2,135
730 0 730 730
Variance Encumbrance
(48,859) 0 (48,859) (48,859)
(29,772) 511 (30,283) (29,261)
(7,529) 9,825 (17,354) 2,297
(7,457) 0 (7,457) (7,457)
(7,090) 0 (7,090) (7,090)
(3,860) 1,053 (4,914) (2,807)
(3,311) 0 (3,311) (3,311)
(2,615) 13,365 (15,979) 10,750
(2,329) 0 (2,329) (2,329)
(2,292) 0 (2,292) (2,292)
Variance Encumbrance
26,030 0 26,030 26,030
24,237 13,803 10,435 38,040
14,118 0 14,118 14,118
13,656 0 13,656 13,656
6,460 6,829 (369) 13,288
4,430 1,135 3,295 5,565
4,383 0 4,383 4,383
3,877 33,558 (29,681) 37,435
3,752 0 3,752 3,752
3,716 0 3,716 3,716
EXPENSES-YeartoDate
Expense 72
Expense 11
Expense 6
Expense 9
Expense 16
Expense 80
Expense 43
Expense 164
Expense 142
Expense 50
Expense 102
Expense 104
Expense 103
Expense 100
Expense 42
Department / Store 5 Possibility of
Expense Paid
Possibility of
Expense
CancelledTop 10 Saving Accounts - Year to Date NOTES
Expense 140
Expense 84
Expense 138
Expense 127
Expense 200
Expense 135
Expense 115
Expense 14
Expense 45
Expense 104
Expense 72
Possibility of
Expense
cancelledTop 10 Overspent Accounts - Year to Date NOTES
Department / Store 5 Possibility of
Expense Paid
Expense 103
Expense 84
Expense 102
Expense 124
Expense 11
Department / Store 5 Possibility of
Expense Paid
Possibility of
Expense
CancelledTop 10 Saving Accounts - Periodic NOTES
Expense 9
EXPENSES-Periodic
Department / Store 5 Possibility of
Expense Paid
Possibility of
Expense
cancelledTop 10 Overspent Accounts - Periodic
Expense 16
Deliver the Best - We
deliver the best in
everything we sell
and do
Expenses
Expenses - Year to Date
NOTES
Expense 14
Expense 127
Expense 54
Expense 140
Expense 2
Expense 154
Expense 142
Quality
Shrinkage Bad Debts Cost to Sell Expenses Sheet
Sales Sheet Shrinkage Sheet Department / Store Selection My Area
SELECT STORE
Department / Store 5
Company
VALUES
2016
Quick Links Expenses - Top 10 Per. Expenses - Top 10 YTD Sales
Area 5 Expense Feedback
INCLUDING SALES,
SHRINKAGE & COST to
SELL
DECEMBER
- 2. Actual Budget Bud Var Var % % on L/Y
2016 6,452,420 6,023,417 429,003 7.12% 9.40%
49,973,951 49,670,942 303,009 0.61% 2.20%
Week 11 Week 12 Week 13 Week 14 Week 15 Week 16 Week 17 Week 18 Week 19 Week 20 Week 21Week 22 Week 23
Actual 1941801.22 1946311.55 1949059.42 2160475.97 2125736.99 2043804.54 2020374.11 2091765.55 2069975.47 2074212.53 2085575
Budget 1918503.34 1906665.48 2151819.46 2051954.68 2009104.18 2128825.54 2059245.87 2176838.01 2168885.24 2127797.85 2097926
1 2 3 4 5 6 7 8 9 10 12
Actual Budget Bud Var
2016 0.25% 0.42% 0.17%
0.17% 0.42% 0.25%
Week 11 Week 12 Week 13 Week 14 Week 15 Week 16 Week 17 Week 18 Week 19 Week 20 Week 21Week 22 Week 23
Actual 0.17% 271.89% -271.29% 0.04% 0.06% -0.06% -0.61% -0.86% 0.38% 1.10% 0.25%
Budget 0.42% 0.42% 0.42% 0.42% 0.42% 0.42% 0.42% 0.42% 0.42% 0.42% 0.42%
1 2 3 4 5 6 7 8 9 10 12
ACTUAL BUDGET VARIANCE VAR % ACTUAL BUDGET VARIANCE VAR %
753 1,046 294 28.08% 4,359 8,630 4,271 49.49%
0 0 (0) #DIV/0! 0 0 (0) #DIV/0!
0 105 105 100.00% 0 868 868 100.00%
402 300 (101) -33.74% 2,776 2,477 (298) -12.05%
0 0 0 0.00% 15 0 (15) -100.00%
351 641 290 45.25% 1,568 5,284 3,716 70.32%
Actual Budget Bud Var Actual Budget Bud Var
7.76% 8.80% 1.04% 6.80% 6.93% 0.13%
4.13% 4.10% -0.03% 3.04% 3.07% 0.03%
SHRINKAGE
Department / Store 5
DECEMBER
Progressive
Department / Store 5
YEAR TO DATE VARIANCE 0.13%
DECEMBER
BadDebts
75090 - Float Discrepancy
75130 - Overs & Shorts
CosttoSell
Year to Date
Cost to Sell
Employment Cost to Sell
Year to Date
Department / Store 5
IS655 - Bad Debts
75620 - Credit Card Chargebacks
75030 - Bad Debts Write Off
75070 - Cash Change Rounding
Periodic
Progressive
Department / Store 5
DECEMBER
SALES
1941801.22
1946311.55
1949059.42
2160475.97
2125736.99
2043804.54
2020374.11
2091765.55
2069975.47
2074212.53
2038365.31
2085574.52
1937313.33
0
0
0
1918503.34
1906665.48
2151819.46
2051954.68
2009104.18
2128825.54
2059245.87
2176838.01
2168885.24
2127797.85
2106601.63
2097925.71
1931571.96
2234173.69
2326960.28
2251818.39
0
500000
1000000
1500000
2000000
2500000
Week11
Week12
Week13
Week14
Week15
Week16
Week17
Week18
Week19
Week20
Week21
Week22
Week23
Week30
Week31
Week32
Actual
Budget
0.17%
271.89%
-271.29%
0.04%
0.06%
-0.06%
-0.61%
-0.86%
0.38%
1.10%
1.59%
0.25%
0.61%
0.00%
0.00%
0.00%
0.42%
0.42%
0.42%
0.42%
0.42%
0.42%
0.42%
0.42%
0.42%
0.42%
0.42%
0.42%
0.42%
0.42%
0.42%
0.42%
-300.00%
-200.00%
-100.00%
0.00%
100.00%
200.00%
300.00%
Week
11
Week
12
Week
13
Week
14
Week
15
Week
16
Week
17
Week
18
Week
19
Week
20
Week
21
Week
22
Week
23
Week
30
Week
31
Week
32
Actual
Budget
7.76%8.80%
COST to SELL Periodic
Actual
Budget
6.80%6.93%
COST to SELL Year to Date
Actual
Budget
4.13%4.10%
Employment COST to SELL Periodic
Actual
Budget
3.04%3.07%
Employment COST to SELL Year to Date
Actual
Budget