IPv6 Migration Infographic with IPv4 Exhaustion Timeline for 2014
•
2 gefällt mir•1,025 views

An infographic by Network Utility Force on the present IPv6 migration landscape and challenges, with an IPv4 exhaustion timeline for 2014.

Empfohlen
Weitere ähnliche Inhalte
Was ist angesagt?
Was ist angesagt? (20)
Ähnlich wie IPv6 Migration Infographic with IPv4 Exhaustion Timeline for 2014
Ähnlich wie IPv6 Migration Infographic with IPv4 Exhaustion Timeline for 2014 (20)
Mehr von Network Utility Force
Mehr von Network Utility Force (12)
Kürzlich hochgeladen
Kürzlich hochgeladen (20)
IPv6 Migration Infographic with IPv4 Exhaustion Timeline for 2014
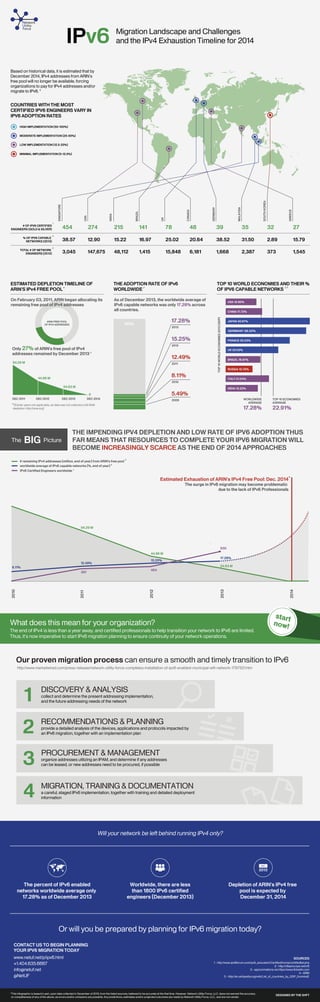
- 1. IPv6 Migration Landscape and Challenges and the IPv4 Exhaustion Timeline for 2014 Based on historical data, it is estimated that by December 2014, IPv4 addresses from ARIN’s free pool will no longer be available, forcing organizations to pay for IPv4 addresses and/or migrate to IPv6. * COUNTRIES WITH THE MOST CERTIFIED IPV6 ENGINEERS VARY IN IPv6 ADOPTION RATES high implementation (50-100%) MODERATE implementation (25-50%) low implementation (12.5-25%) # of IPv6 certified engineers (GOLD & SILVER) % of IPv6 capable networks (2013) total # of network engineers (2013) 1 141 78 48 39 35 32 27 12.90 15.22 16.97 25.02 20.64 38.52 31.50 2.89 15.79 3,045 3 215 38.57 2 274 147,675 48,112 1,415 15,848 6,181 1,668 2,387 373 1,545 On February 03, 2011, ARIN began allocating its remaining free pool of IPv4 addresses As of December 2013, the worldwide average of IPv6 capable networks was only 17.28% across all countries. ARIN FREE POOL OF IPV4 ADDRESSES TOP 10 WORLD ECONOMIES AND THEIR % 2, 5 OF IPV6 CAPABLE NETWORKS 17.28% 100% 2013 15.25% 2012 Only 27% of ARIN's free pool of IPv4 addresses remained by December 2013 4 12.49% 94.29 M 2011 8.11% 44.96 M USA 12.90% CHINA 17.72% TOP 10 WORLD ECONOMIES 2013 (GDP) THE ADOPTION RATE OF IPv6 2 WORLDWIDE 24.83 M GERMANY 38.52% FRANCE 30.23% UK 25.02% BRAZIL 16.97% RUSSIA 10.76% INDIA 15.22% 5.49% 0 DEC 2012 JAPAN 40.67% ITALY 21.04% 2010 DEC 2013 DEC 2014 WORLDWIDE AVERAGE (Earlier years not applicable, as data was not collected until IANA depletion: http://iana.org) BIG Picture TOP 10 ECONOMIES AVERAGE 17.28% 2009 4 The GREECE 454 ESTIMATED DEPLETION TIMELINE OF ARIN’S IPv4 FREE POOL * DEC 2011 SOUTH KOREA MALAYSIA GERMANY CANADA UK BRAZIL INDIA USA SINGAPORE Minimal implementation (0-12.5%) 22.91% THE IMPENDING IPV4 DEPLETION AND LOW RATE OF IPV6 ADOPTION THUS FAR MEANS THAT RESOURCES TO COMPLETE YOUR IPV6 MIGRATION WILL BECOME INCREASINGLY SCARCE AS THE END OF 2014 APPROACHES # remaining IPv4 addresses (million, end of year) from ARIN’s free pool worldwide average of IPv6 capable networks (%, end of year) 2 4 IPv6 Certified Engineers worldwide 1 Estimated Exhaustion of ARIN's IPv4 Free Pool: Dec. 2014 * The surge in IPv6 migration may become problematic due to the lack of IPv6 Professionals 94.29 M 930 44.96 M 15.25% 12.49% 24.83 M 8.11% 2014 2012 2011 2013 464 397 2010 17.28% start now! What does this mean for your organization? The end of IPv4 is less than a year away, and certified professionals to help transition your network to IPv6 are limited. Thus, it’s now imperative to start IPv6 migration planning to ensure continuity of your network operations. Our proven migration process can ensure a smooth and timely transition to IPv6 http://www.marketwired.com/press-release/network-utility-force-completes-installation-of-ipv6-enabled-municipal-wifi-network-1797521.htm 1 Discovery & analysis 2 Recommendations & planning 3 procurement & management 4 collect and determine the present addressing implementation, and the future addressing needs of the network provide a detailed analysis of the devices, applications and protocols impacted by an IPv6 migration, together with an implementation plan organize addresses utilizing an IPAM, and determine if any addresses can be leased, or new addresses need to be procured, if possible migration, TRAINING & documentation a careful, staged IPv6 implementation, together with training and detailed deployment information Will your network be left behind running IPv4 only? DEC 2013 The percent of IPv6 enabled networks worldwide average only 17.28% as of December 2013 Worldwide, there are less than 1800 IPv6 certified engineers (December 2013) Depletion of ARIN's IPv4 free pool is expected by December 31, 2014 Or will you be prepared by planning for IPv6 migration today? www.netuf.net/p/ipv6.html https://twitter.com/NetUF 1 - http://www.ipv6forum.com/ipv6_education/Certified/home/certifiedlist.php 2 - http://v6asns.ripe.net/v/6 3 - approximations via https://www.linkedin.com http://www.arin.net 5 - http://en.wikipedia.org/wiki/List_of_countries_by_GDP_(nominal) *This infographic is based in part, upon data collected in December of 2013, from the listed sources, believed to be accurate at the that time. However, Network Utility Force, LLC. does not warrant the accuracy or completeness of any of the above, as errors and/or omissions are possible. Any predictions, estimates and/or projected outcomes are made by Network Utility Force, LLC., and are not certain. DESIGNED BY THE SHFT http://www.theshft.com/