Improving steam boiler operating efficiency
•
21 gefällt mir•9,744 views

About the boiler efficiency.Research report.

Empfohlen
Empfohlen
Weitere ähnliche Inhalte
Was ist angesagt?
Was ist angesagt? (20)
Andere mochten auch
Andere mochten auch (16)
Ähnlich wie Improving steam boiler operating efficiency
Ähnlich wie Improving steam boiler operating efficiency (20)
Kürzlich hochgeladen
Kürzlich hochgeladen (20)
Improving steam boiler operating efficiency
- 2. Improving Steam Boiler Operating Efficiency ENERCON National Energy Conservation Center ENERCON Building, G-5/2, Islamabad Ministry of Water and Power Government of Pakistan August 2014
- 4. Acknowledgements Much of the material presented in this manual has been derived from published sources. Major contributions were taken from the following; (1) National Renewable Energy Laboratory, the U.S. Department of Energy (2) "Improving Steam Boiler Operating Efficiency", 1981; Georgia Tech Engineering Experiment Station, Atlanta, Georgia, USA. (3) Stoichiometric Calculations, Hsin Chu, Professor, Dept. of Environmental Engineering, National Cheng Kung University (4) Fuel Efficiency Booklets, 1993; Energy Efficiency Office, Department of Energy, London, England. (5) The Complete Guide to Energy Efficiency, 1996; NIFES Consulting Group, GEE Publishing Ltd., London, England (6) Large Scale Solar Thermal Systems Handbook, First Edition, 2009, A joint publication between Master Plumbers’ and Mechanical Services Association of Australia and Sustainability, Victoria, Australia (7) Solar Water Heating Systems for Industrial Applications, a brochure of TATA BP Solar Ltd., Bangalore, India (8) Small-scale biomass combustion in boilers, a presentation by Prof. Ingwald Obernberger, BIOS BIOENERGIESYSTEME GmbH, Graz, Austria (9) A report on “Identification of Biomass Potential in Punjab”, September 2010, Pakistan (10) Heating Values of Biomass Fuels, PCSIR (Pakistan Council for Scientific and Industrial Research) , Pakistan (11) Engineering Toolbox, www.engineeringtoolbox.com
- 5. Foreword The current energy situation in Pakistan strongly advocates that the economic survival of our country, its stability and future growth, and socio-economic welfare of the people, all depend on the wise utilization of available domestic energy resources and energy imported to meet our existing and ever-increasing energy demand. Our future lies in taking extreme steps on a war footing basis to combat the wastage of energy caused by its inefficient utilization, resulting from the use of inefficient equipment, and bad operational practices. Industrial and commercial sectors of any economy are its backbone. Being the major users of energy, and few in number, they are easy to approach and target. Hence, they offer substantial opportunities to harness large amount of wasteful use of energy in their operations through implementation of appropriate energy efficiency measures. It is true that residential unit is rather small in terms of use of energy, and fairy large in number. However, we should not neglect it, since it is a nursery for cultivating energy efficient habits as a nation. Further, one should remember that key to growth and success is innovation. Hence, we, as a nation, need to think ahead and act quickly to utilize our conventional energy resources and to exploit the use of innovative technologies to benefit from abundantly available alternative energy resources in our country. This is the only way out to improve the economy and make our products competitive in the international market. It is an established fact that efficient operation of the boilers is highly desirable to minimize operating / production costs, save energy, and mitigate undesirable emissions. Where feasible, one should consider the replacement of inherently inefficient boilers on urgent basis. ENERCON, the national Energy Conservation Centre, is endeavoring to nurture an energy efficient culture in the country. Its efforts aim at creating awareness among energy users and promoting energy efficiency practices in all energy consuming sectors of economy. /accordingly, this manual has been prepared to educate boiler operators, technicians, engineers and industrialists on the basics of industrial boilers, their operating characteristics and the efficiency improvement techniques; and to be equally useful to engineering students looking at their first real application of basic engineering principles. It offers a review of following aspects: Basics of combustion, combustion efficiency, and control systems Boilers, their characteristics, and energy efficiency and guidelines to operate steam boilers efficiently Step by step approach for calculating and implementing energy efficiency opportunities Identification and wise utilization of alternative renewable energy resources It contains appropriate theoretical material and information, and is a practical guide for the professionals to identifying and implementing energy efficiency and conservation opportunities in steam boilers. However, it is not a replacement of textbooks. With the aid of manuals, training courses, and other technical information and assistance, ENERCON pledges to continue supporting the professionals, engineers and technicians, and work together to achieve energy efficiency and conservation in all sectors of economy. Managing Director ENERCON
- 7. ENERCON, The National Energy Conservation Centre i Contents 1 Introduction 1 1.1 Units used in this Manual 1 1.2 This Manual 1 2 Description of Boilers 3 2.1 Boiler Classification 3 2.2 Types of Steam Boilers 3 2.2.1 Fire-tube Boilers 3 2.2.2 Water-tube Boilers 8 2.3 Coal Based Boilers 13 2.4 Small Scale Biomass Fuel Based Boilers 14 2.4.1 Classification of Different Small-scale Biomass Combustion Systems 14 2.5 Boiler Ratings 17 2.5.1 'From and At' and Capacity Rating 17 2.5.2 kW Rating 19 2.5.3 Boiler Horsepower (BoHP) 19 2.5.4 Heating Surface Area 19 2.6 Heat and Steam Release Rates 20 2.6.1 Volumetric Heat Release (kW/m3) 20 2.6.2 Steam Release Rate (kg / m2 s) 20 3 Fuels, Combustion and Efficiency 21 3.1 Fossil fuels 21 3.2 Biomass Fuels 21 3.2.1 Chemical Composition of Biomass Fuels 21 3.3 Categories of Biomass Materials 22 3.4 Thermal Properties of biomass 22 3.4.1 Moisture Content 22 3.4.2 Ash Content 23 3.4.3 Volatile Matter Content 23 3.4.4 Elemental Composition 23 3.4.5 Heating Value 24 3.4.6 Bulk Density 24 3.5 Biomass Fuels and Pakistan 24 3.6 Bagasse 25 3.7 Cotton Wastes and Cotton Stalks 25 3.8 Rice Husk 25 3.9 Wheat Straw 26 3.10 Combustion Principles 26 3.11 Combustion Exhaust Gas Composition 28 3.12 Boiler Efficiency 30 3.12.1 Combustion Efficiency 31 3.12.2 Thermal Efficiency 31 3.12.3 Fuel to Boiler Efficiency (Fuel-to-Steam Efficiency) 31 3.13 Computing Boiler Efficiency and Losses 32 3.13.1 Computing Boiler Efficiency 32 3.14 Factors Affecting Boiler Efficiency 34 3.14.1 Stack Temperature and Losses 34 3.14.2 Excess Air 34 3.14.3 Radiation and Convection Losses 35 3.14.4 Heating Surface 35 3.14.5 Blowdown Losses 35 3.15 Integral Boiler/Burner Package 36 4 Reducing the Losses Affecting Efficiency 37
- 8. ENERCON, The National Energy Conservation Centre ii 4.1 Excess Air Rate 37 4.2 Burners 38 4.3 Firing Rate 38 4.4 Flue Gas Temperature 39 4.5 Feed Water Temperature 40 4.6 Condensate Recovery 41 4.7 Combustion Air Temperature 41 4.8 Fouling of Heat Transfer Surfaces 42 4.9 Blowdown 43 4.9.1 Solids Concentration 43 4.9.2 Intermittent and Continuous Blowdown 45 4.9.3 Control of Blowdown 45 4.9.4 Blowdown Heat Recovery 46 4.10 Steam Pressure 46 4.11 Boiler Exterior Heat Losses 47 4.12 Effects of Fuel 48 5 Efficiency Calculations 51 5.1 Data Requirements 51 5.2 Instruments for Monitoring and Testing 52 5.3 Simplified Flue Gas Loss Calculations 52 5.4 Stoichiometric Calculations 57 5.5 Comprehensive Calculation Method 61 5.6 Heat Loss Calculations 64 5.7 Data and Calculation Forms 65 6 Boiler Instrumentation and Controls 71 6.1 Boiler Instrumentation 71 6.2 Pressure Measurement 71 6.3 Temperature Measurement 72 6.4 Boiler Water Level Controls 73 6.4.1 On / off Control 73 6.4.2 Modulating Control 74 6.5 Steam Flow Metering 74 6.5.1 Orifice Plate Flow Meters 74 6.5.2 Turbine Flow Meters 75 6.5.3 Variable Area Flow Meters 77 6.5.4 Spring Loaded Variable Area Flow Meters 78 6.6 Monitoring / Control Techniques for Boilers 79 6.6.1 Monitoring Total Dissolved Solids (TDS) in Boiler Water 79 6.6.2 Sampling for External Analysis 79 6.6.3 Relative Density Method 80 6.6.4 Conductivity Method 81 6.7 Monitoring of pH Value 81 6.8 Flue Gas Analysis 82 6.8.1 Sampling 84 6.9 Blowdown Control 84 6.9.1 Timer Controlled Automatic Bottom Blowdown 86 6.10 Safety Valve 87 6.10.1 Basic Operation of Safety Valve 88 6.10.2 Types of Safety Valves 90 7 Burners and Combustion Controls 93 7.1 Gas Burners 93 7.1.1 Premix Burners 93
- 9. ENERCON, The National Energy Conservation Centre iii 7.1.2 Nozzle-Mix Burners 94 7.1.3 Naturally Aspirated Burners 94 7.2 Oil Burners 95 7.2.1 Steam-Atomizing Burners 96 7.2.2 Air-Atomizing Burners 96 7.2.3 Mechanical Atomizing Burners 96 7.2.4 Return-Flow Variable Nozzle Pressure Atomizing Burners 97 7.2.5 Rotary-Cup Burners 98 7.3 Dual Fuel Burners 99 7.4 Solid Fuels – Combustion Systems 100 7.4.1 Fixed-bed combustion 100 7.4.2 Fluidized Bed Combustion (FBC) 101 7.4.3 Dust Combustion 105 7.4.4 Pulverized Fuel Boiler 105 7.4.5 Summary of Solid Fuels Combustion Systems 106 Burner Controls 107 7.4.6 On / Off Control System 108 7.4.7 High / Low / Off Control System 108 7.4.8 Modulating Control System 108 7.4.9 Safety 109 7.5 Combustion Controls 109 7.5.1 Fixed Positioning 109 7.5.2 Parallel Positioning With Operator Trim 110 7.5.3 Pressure Ratio 110 7.5.4 Fuel and Air Metering 110 7.5.5 Cross-Limited Metering 111 7.5.6 Oxygen Trim 111 8 Water Treatment 113 8.1 Contaminants and Impurities in Water 113 8.2 Characteristics of Raw Water 113 8.2.1 115 8.2.2 Hardness 115 8.2.3 Total Hardness 116 8.3 Boiler Water Quality 117 8.3.1 Freedom from Scale 117 8.3.2 Freedom from Corrosion and Chemical Attack 117 8.4 Factors Affecting Steam Quality 118 8.5 External Water Treatment 119 8.5.1 Lime; Lime-Soda Softening 119 8.5.2 Ion Exchange 120 8.5.3 Selection of External Water Treatment Plant 123 8.5.4 Deaeration 123 8.5.5 Selection of External Water Treatment 125 8.6 Internal Water Treatment 126 8.6.1 Lime Soda Processes 126 8.6.2 Phosphate Treatment 126 8.6.3 Organic Materials 126 8.6.4 Feeding of Chemicals 127 8.7 Corrosion 127 8.8 Anti-foam Agents 128 8.9 Checklist for Boiler Water Treatment 128 8.9.1 External Treatment 128 8.9.2 Conditioning Treatment 129 8.9.3 Blowdown Control 129 8.9.4 Testing 129 9 Boiler Heat Recovery Systems 131 9.1 Developing a Heat Recovery Project 131
- 10. ENERCON, The National Energy Conservation Centre iv 9.1.1 Identification of the Project 131 9.1.2 Perform Measurements and Analysis 132 9.1.3 Design the System 132 9.2 Flue Gas Heat Recovery 133 9.2.1 Feedwater Preheating 133 9.2.2 Air Preheating 134 9.2.3 Acid Dew Point 135 9.2.4 Flue Gas Latent Heat Recovery 136 9.3 Blowdown Heat Recovery 137 9.3.1 Recovering and Using Flash Steam 138 9.3.2 Heat Recovery from Residual Blowdown 139 9.4 Condensate Return 142 10 Solar Water Heating Systems 145 10.1 Solar Collectors 145 10.1.1 Collector types 145 10.2 Storage Tanks and Heat Exchangers 148 10.2.1 External Heat Exchanger Configurations 149 10.3 System Layouts 149 10.3.1 Open Loop Systems 149 10.3.2 Closed Loop Systems 149 10.4 Collector Loop Design Concepts 150 10.5 Thumb Rule for Sizing of LSTS (Typical Case) 150 10.6 Design Checklist 151 10.7 Installation and Commissioning Checklist 153 11 Performance Monitoring 155 11.1 Log Sheets 155 11.2 Spot Checks for Efficiency 156 11.3 Maintenance 157 11.4 Water Quality and Treatment Methods 158 11.5 Smoke Density 158 11.6 Flame Appearance 160 11.7 Burner Checks 160 11.8 Combustion Controls 161 11.9 Boiler Tube Cleanliness 161 11.10 Boiler Tune-up 161 11.10.1 Setting up the Boiler Test 161 11.10.2 Conducting the Tests 162 11.10.3 Achieving Low Excess Air Operation 162 11.11 Troubleshooting 164 12 Environmental Pollution Aspect 165 12.1 Air Pollution due to Fossil-fuel Burning 165 12.2 Air Pollution Control in Fossil Fuel Burning Systems 165 12.2.1 Control of SO2 Emission 165 12.2.2 Control of NOx Emission 166 12.2.3 Control of Particulate Matter Emission 166 12.3 Water Pollution and Solid Waste Disposal Problem in Boiler Plants 166 12.3.1 Waste Water from Water Treatment Plants 167 12.4 Pakistan – National Environmental Quality Standards (NEQS) 167
- 11. ENERCON, The National Energy Conservation Centre v Exhibits Exhibit 2-1: Lancashire Boiler 4 Exhibit 2-2: Two Pass, Dry Back Boiler 5 Exhibit 2-3: Two Pass, Wet Back Boiler 5 Exhibit 2-4: Three Pass, Wet Back Boiler 6 Exhibit 2-5: Modern Packaged Boiler 7 Exhibit 2-6: Thimble or Reverse Flame Boiler 8 Exhibit 2-7: Water-tube Boiler 9 Exhibit 2-8: Natural Water Circulation in a Water-tube Boiler 9 Exhibit 2-9: Various Water-tube Boiler Configurations 10 Exhibit 2-10: Heat Transfer in the Furnace or Radiant Section 10 Exhibit 2-11: Heat Transfer in the Convection Section 10 Exhibit 2-12: Longitudinal Drum Boiler 11 Exhibit 2-13: Cross-Drum Boiler 12 Exhibit 2-14: Bent Tube or Stirling Boiler 12 Exhibit 2-15: Typical Coal Fired Boiler 14 Exhibit 2-16: Manually Fed Boiler for Log Wood 15 Exhibit 2-17: Automatically Overfed Pellet Boiler 16 Exhibit 2-18: Automatically Fed Boiler for Pellets with Integrated Flue Gas Condensation 17 Exhibit 2-19: Feedwater Temperature vs %age of ‘From and At’ Value at Different Pressures 18 Exhibit 3-1: Properties of different Biomass Resources 26 Exhibit 3-2: Stoichiometric Air Requirements for Combustion 27 Exhibit 3-3: Typical Air Requirements 28 Exhibit 3-4: Relationship Between Excess Air, CO2, O2, and CO in flue gases 28 Exhibit 3-5: Typical Heat Recovery from Continuous Boiler Blowdown 36 Exhibit 4-1: Relationship between O2, CO2 and Excess Air 37 Exhibit 4-2: Variation in Boiler Efficiency Losses with Firing Rate 39 Exhibit 4-3: Variations in Combustion Efficiency with Flue Gas Temperature for Various Excess Air Levels 40 Exhibit 4-4: Efficiency Improvement from Feed Water Preheating 40 Exhibit 4-5: Boiler Fuel Saved by Condensate Return 41 Exhibit 4-6: Boiler Efficiency Improvement by Combustion Air Pre-heating with Boiler Exhaust Gases 42 Exhibit 4-7: Boiler Efficiency Loss due to Stack Temperature Increase 42 Exhibit 4-8: Typical Fuel Wasted due to Scale Deposits 43 Exhibit 4-9: Effect of Boiler Blowdown Rate on Fuel Wastage (% Fuel Wasted = % Loss in Efficiency) 44 Exhibit 4-10: Recommended Limits of Boiler Water Concentration 44 Exhibit 4-11: Efficiency Improvement from Reducing Boiler Operating Pressure 47 Exhibit 4-12: Heat Energy Loss from Bare Surface 48 Exhibit 4-13: Variation in Combustion Efficiency with Hydrogen to Carbon Atom Ratio 49 Exhibit 4-14: Higher Heating Values or Gross Calorific Values (CV) for Various Chemical Substances 50 Exhibit 4-15: Higher Heating Values or Gross Calorific Values (CV) for Common Fuels in Pakistan 50 Exhibit 5-1: Fuel CV Ratios, Hydrogen and Water Contents, and Maximum CO2 Produced 52 Exhibit 5-2: Light and Medium Fuel Oils: Flue Gas Losses and Excess Air based on Gross Calorific Value and Ambient Temperature of 20ᵒC 54 Exhibit 5-3: Heavy Fuel Oil: Flue Gas Losses and Excess Air based on Gross Calorific Value and Ambient Temperature of 20ᵒC 55 Exhibit 5-4: Natural gas: Flue Gas Losses and Excess Air based on Gross Calorific Value and Ambient Temperature of 20ᵒC 56 Exhibit 5-5: Heavy Fuel Oil Calculation Example 57 Exhibit 5-6: Form for Calculating Exhaust Gas Composition based on Fuel Chemistry and Excess Air 59 Exhibit 5-7: Example Calculations of Exhaust Gas Composition with Furnace Oil at 200% Excess Air 60 Exhibit 5-8: Boiler Details 66 Exhibit 5-9: Operating Data (Boiler Tests) 67 Exhibit 5-10: Boiler Loss Calculations 68 Exhibit 5-11: Boiler Loss Calculations (Gas or Liquid Fuels) 69 Exhibit 5-12: Boiler Heat Loss Calculations 70 Exhibit 6-1: Digital Thermometer and Probes for Different Applications 72 Exhibit 6-2: Typical infrared thermometer for non-contact temperature measurement 72 Exhibit 6-3: On / off Control 73 Exhibit 6-4: Modulating Control 74 Exhibit 6-5: Orifice Plate Flow Meter 75 Exhibit 6-6: Turbine Flow Meter 76 Exhibit 6-7: Bypass or Shunt Turbine Flow Meter 76 Exhibit 6-8: Variable Area Flow Meter 77 Exhibit 6-9: Variable Area Flow Meter installed in a Vertical Plane 78 Exhibit 6-10: Spring Loaded Variable Area Flow Meters 78 Exhibit 6-11: Comparison of Units used to Measure TDS 79 Exhibit 6-12: A Sample Cooler 80 Exhibit 6-13: Hand Held Conductivity Meter 81 Exhibit 6-14: Hand Held pH Meter 82
- 12. ENERCON, The National Energy Conservation Centre vi Exhibit 6-15: Orsat Apparatus and Fyrite Gas Analyzer 83 Exhibit 6-16: Typical Portable Electronic Combustion Analyzer 83 Exhibit 6-17: Equivalent Length of Blowdown Line Fittings in Meters (m) 85 Exhibit 6-18: Approximate Blowdown Rate (based on an 8 m Equivalent Pipe Length) 85 Exhibit 6-19: Typical Maximum TDS for Various Boiler Types 85 Exhibit 6-20: Bottom Blowdown Valve with Removable Key 86 Exhibit 6-21: Timer Controlled Automatic Bottom Blowdown Valve 87 Exhibit 6-22: Typical Safety Valves used on Steam Systems 88 Exhibit 6-23: Typical Disc and Shroud Arrangement used on Rapid Opening Safety Valves 88 Exhibit 6-24: Operation of a conventional safety valve 89 Exhibit 6-25: Relationship between Pressure and Lift for a Typical Safety Valve 89 Exhibit 6-26: Blowdown rings on an ASME type safety valve 90 Exhibit 7-1: Various types of nozzle-mix burners 94 Exhibit 7-2: Naturally aspirated burners 95 Exhibit 7-3: Internal mixing steam atomizing burner 96 Exhibit 7-4: Mechanical Atomizing burner and nozzle 97 Exhibit 7-5: Return-flow burner nozzle 98 Exhibit 7-6: Rotary cup burner 98 Exhibit 7-7: Parameters of oil burners 99 Exhibit 7-8: Dual fuel burner 99 Exhibit 7-9: Principle Combustion Technologies for Solid Fuels 100 Exhibit 7-10: Chain or Travelling Grate Stoker (a) 101 Exhibit 7-11: Chain or Travelling Grate Stoker (b) 101 Exhibit 7-12: Spreader Stoker 101 Exhibit 7-13: Underfeed Stoker 101 Exhibit 7-14: BFB Furnace with Three Air Introduction Zones 103 Exhibit 7-15: CFB Combustion System with Steam Boiler 104 Exhibit 7-16: PFBC Combustion 104 Exhibit 7-17: Dust Combustion Plant 105 Exhibit 7-18: Tangential Firing System 106 Exhibit 7-19: Advantages, Disadvantages and of Application of Different Solid Fuels Combustion Technologies 106 Exhibit 7-20: Comparison of Most Important Combustion Technologies 107 Exhibit 7-21: Salient Characteristics of Major Combustion Technologies 107 Exhibit 8-1: Common Boiler Feed Water Contaminants 114 Exhibit 8-2: Alkaline or Temporary Hardness 115 Exhibit 8-3: Non-alkaline or permanent hardness 115 Exhibit 8-4: Scale Formation in Boilers 116 Exhibit 8-5: Base-exchange Softening 120 Exhibit 8-6: Dealkalization Process 121 Exhibit 8-7: Dealkalization Process 122 Exhibit 8-8: Demineralization Process 122 Exhibit 8-9: Comparison of Effectiveness of Different Water Treatment Processes 123 Exhibit 8-10: Cost Comparison Ratio for Different Water Treatment Processes 123 Exhibit 8-11: Oxygen Solubility vs. Temperature Graph at Different Pressures 123 Exhibit 8-12: Tray-type Deaerating Heater 124 Exhibit 8-13: Spray-type Deaerating Heater 124 Exhibit 8-14: ASME Guidelines for Water Quality in Modern Industrial Water Tube Boilers for Reliable Continuous Operation 130 Exhibit 8-15: ABMA Standard Boiler Water Concentrations for Minimizing Carryover 130 Exhibit 9-1: Typical Boiler Economizer Installation 133 Exhibit 9-2: Closed Loop Re-circulating System for Boiler Waste Heat Recovery 134 Exhibit 9-3: Rotary Regenerative Air Preheater 134 Exhibit 9-4: Finned Steel Tube Recuperator 135 Exhibit 9-5: Flue Gas Due Point 136 Exhibit 9-6: Flash Vessel 138 Exhibit 9-7: Using a Flash Vessel to Return Energy to the Feedtank 139 Exhibit 9-8: Energy Recovery using a Heat Exchanger 140 Exhibit 9-9: Heating Make-up Water in a Cold Break Tank (Level Controls have not been shown on the Feedtank) 141 Exhibit 9-10: Plate Type Heat Exchanger 141 Exhibit 9-11: Typical Steam and Condensate Circuit 142 Exhibit 9-12: Quality of flash steam graph 143 Exhibit 9-13: Heat content of steam and condensate at the same pressures 143 Exhibit 10-1: Typical Cross-section through a Conventional Flat Plate Solar Collector 145 Exhibit 10-2: Typical Heat Pipe Evacuated Tube Array 146 Exhibit 10-3: Typical Evacuated U-tube Array 147 Exhibit 10-4: Typical Concentrating Collector 147 Exhibit 10-5: Tank with Helical Coil Heat Exchanger 148 Exhibit 10-6: Load Side Heat Exchanger Tank 148
- 13. ENERCON, The National Energy Conservation Centre vii Exhibit 10-7: Tank with External Heat Exchanger 149 Exhibit 10-8: Typical Open Loop System 149 Exhibit 10-9: Typical Closed Loop System 150 Exhibit 10-10: Calculate no. of collectors for 1,000 liters hot water per day 151 Exhibit 11-1: Boiler evaluation checklist 156 Exhibit 11-2: Boiler inspection checklist 157 Exhibit 11-3: Smoke scale for burner smoke test, primarily applicable to liquid and solid fuels 159 Exhibit 11-4: Typical smoke - O2 characteristic curves for coal or oil fired industrial boilers 163 Exhibit 11-5: Typical CO2 - O2 characteristic curves 164 Exhibit 11-6: Boiler troubleshooting: summary table 164 Appendices Appendix-A Properties of Saturated Steam (Pressure in Bars) 8 Appendix-B Processing of Biomass Fuels 13 B.1 Drying of Biomass Fuels 14 B.2 Dryer Principles 14 B.2.1 Types of Dryers 17 B.2.2 Stages of Drying 17 B.3 Dryers Description 19 B.3.1 Rotary Dryers 19 B.3.2 Flash Dryers 19 B.3.3 Disk Dryers 20 B.3.4 Cascade Dryers 20 B.3.5 Superheated Steam Dryers (SSDs) 20 B.4 Heat Recovery 21 B.4.1 Heat Recovery in Air Drying 21 B.4.2 Superheated Steam Heat Recovery 21 B.5 Drier Choices 21 B.6 Benefits and Disadvantages of Different Types of Dryers 22 B.7 Fuel Powdering, Pelleting and Briquetting 22 B.7.1 Powdering 22 B.7.2 Pelletizing and Briquetting 23 Appendix-C Combustion Calculations 23 C.1 1. Applications of the Combustion Equation 23 C.2 Combustion Air Requirements: Gaseous Fuels 24 C.3 Flue Gas Composition-Gaseous Fuels 24 C.4 Combustion Air Requirements-Solid and Liquid Fuels 24 C.5 Combustion Products-Solid and Liquid Fuels 25 C.6 Practical Significance of the Flue Gas Composition 25 C.7 Sub-stoichiometric Combustion 25 Appendix-D Energy Conservation Opportunities in Boiler Operations (Worked Example) 26 D.1 Introduction 26 D.2 Worked Example 28 D.2.1 Boiler Description 30 D.2.2 Boiler Data Collection 31 D.3 Boiler Efficiency 31 D.3.1 Excess Air 31 D.3.2 Boiler Surface Heat Losses 32 D.3.3 Blowdown 32 D.3.4 Other Losses 34 D.3.5 Overall Boiler Efficiency 34 D.3.6 Boiler Efficiency Using the Graph Method 34 D.3.7 Boiler Steam Production Rate 35 D.4 Opportunities for Boiler Efficiency Improvement 35 D.4.1 Reduce Excess Air 35 D.4.2 Reduce Blowdown 36 D.4.3 Reduce Boiler Surface Heat Losses 37 D.4.4 Improve Boiler Tube Cleaning/Maintenance 37 D.4.5 Reduce Steam Pressure 38 D.4.6 Install O2 Trim System 38 D.4.7 Install Boiler Economizer 39
- 14. ENERCON, The National Energy Conservation Centre viii D.4.8 Recover Heat from Blowdown 40 D.5 Notes on the Calculations 41 D.5.1 Effect of Excess Air on Stack Temperature 41 D.5.2 Losses as Percent of Total Heat Input 42 D.5.3 Steam Pressure Effect on Boiler Efficiency 43 D.5.4 O2 Trim Attractiveness 43 D.5.5 Blowdown Heat Recovery 45 D.6 Summary 45 Appendix-E Boiler Control Parameters 46 E.1 Shell Boilers 46 E.1.1 Recommended Characteristics 47 E.1.2 Comments on Exhibit E-1 48 E.2 Water-tube Boilers 51 E.2.1 Recommended Characteristics 51 E.2.2 Comments on Exhibit E-2 52 Appendix-F SI Conversion Table 52 Exhibits Exhibit B 1: Single-Pass Rotary Dryer 172 Exhibit B 2: Typical Flash Dryer Configuration 173 Exhibit B 3: Side View of a Disk Dryer 173 Exhibit B 4: Side View of a Cascade Dryer 174 Exhibit B 5: Basic Superheated Steam Dryer Design 174 Exhibit B 6: Bed Mixing Superheated Steam Dryer 175 Exhibit B 7: Typical Superheated Steam Dryer 175 Exhibit B 11: Summary of the Advantages and Disadvantages of Each Dryer 178 Exhibit B 8: Pellets and Briquettes 179 Exhibit B 9: Flat Die Pellet Mill 179 Exhibit B 10: Ring Die Pellet Mill 180 Exhibit C 1: Carbon Dioxide Concentration in Flue Gases 187 Exhibit C 2: Flue Gas Composition for Natural Gas 187 Exhibit C 3: Carbon Dioxide in Combustion Products 188 Exhibit C 4: Oxygen in combustion products 188 Exhibit C 5: Sub-stoichiometric combustion of natural gas 189 Exhibit D 1: Energy conservation opportunities in boiler operations 201 Exhibit D 2: (Case Study) (Exhibit 5-8: Boiler Details) 202 Exhibit D 3: (Exhibit 5-9: Operating Data – Boiler Tests) 202 Exhibit D 4: Background information 203 Exhibit D 5: Heat Loss Calculations 203 Exhibit D 6: (Exhibit 5-11: Boiler Loss Calculations - Gas or Liquid Fuels) 204 Exhibit D 7: (Exhibit 5-11: Boiler Loss Calculations (Gas or Liquid Fuels) 205 Exhibit D 8: Boiler Example Savings Summary 205 Exhibit E 1: Recommended water characteristics for shell boilers 209 Exhibit E 2: Recommended Water Characteristics for Water-tube Boilers 211 Exhibit E 3: Maximum Concentration of Silica in Boiler Water 212 Exhibit E 4: Water Quality Guidelines Recommended for Industrial Water-tube Boilers 212
- 15. ENERCON, The National Energy Conservation Centre 1 1 Introduction Boilers are an integral part of almost every industry, often consuming the largest proportion of the fuel being used by that industry. ENERCON’s various programs abundantly reveal that due to the current poor operating practices, steam generation and its usage can be optimized through the implementation of many economically viable energy conservation and efficiency improvement opportunities. In general, the boilers are not well maintained, and owners frequently complain of the poor quality of technical support services available. No formal training facilities exist in the country for boiler engineers and operators. The Boiler Inspectorates are understaffed and ill-equipped to carry out the important tasks of inspection, monitoring and certification. As the industrialization of Pakistan proceeds, the population of boilers and their use will undoubtedly increase significantly, and the need for maintaining good combustion and operational efficiency of the boilers will be even greater to assure effective use of energy resources, under increasing costs and paucity of fuels. The purpose of this manual is to draw attention to some of the ways by which the efficiency of boilers can be improved on a day- to-day basis, often without the need to invest money in new equipment. Much can often be done to upgrade the performance of existing plant by careful monitoring and prompt adjustment of operating parameters by a trained and observant operator. ENERCON’s extensive experience indicates that even a simple instrumented tune-up of the boilers results in significant improvement in their efficiency. Increasing boiler efficiency should be approached systematically. Various criteria including boiler size, type, burners and controls, and current level of efficiency will dictate what logical steps should be taken to improve energy efficiency. In general, the following order of priority applies for most boilers: ● Routine maintenance ● Efficiency-related maintenance ● Combustion efficiency ● Control systems ● Burners ● Fuel treatment ● Feed-water treatment ● Waste Heat recovery The dearth of fossil fuels and their increasing prices have made essential to analyze renewable alternative energy resources and their utilization. It includes the biomass fuels and solar water heating systems. Each of these topics is discussed in this manual in varying levels of detail. 1.1 Units used in this Manual This manual uses the SI (Le Systeme International d’Unites) metric units of measure. 1.2 This Manual This manual covers the basic concepts and combustion, boilers, burners, solar water heating systems, and use of biomass fuel in small boilers; and identifying and quantifying energy conservation measures most pertinent to Pakistan.
- 16. ENERCON, The National Energy Conservation Centre 2 Chapter 1 is the brief introduction to this manual. Chapter 2 describes fossil fuel fired and biomass fuel fired boilers, boilers rating, and heat and steam release rates. Chapter 3 introduces the fossil and biomass fuels, their combustion, combustion efficiency and boiler efficiency. Chapter 4 explains the losses in boiler systems affecting it efficiency and how to reduce avoidable losses; as reduction in these losses will improve efficiency. The energy conservation opportunities include, excess air control, blowdown and boiler water treatment, steam pressure, boiler exterior heat losses, and effect of fuels. Chapter 5 on efficiency calculations presents an overview of data requirements, instruments needed for monitoring and testing, simplified and comprehensive methods for calculating losses and efficiency. Chapter 6 introduces boiler instrumentation and controls for pressure, temperature, level control, steam flow metering, flue gas analysis, blowdown control, safety instruments, and monitoring and control techniques for boilers. Chapter 7 discusses different types of burners, burner controls, and combustion control systems. Chapter 8 highlights the importance of water treatment with respect to maintaining boiler water quality essential for efficient operation of steam boilers. It discusses external and internal water treatment and checklist for boiler water treatment. Chapter 9 presents the boiler heat recovery systems including flue gas heat recovery, blowdown heat recovery, and developing a heat recovery project. Chapter 10 introduces solar water heating systems, and solar collectors, storage tanks, heat exchangers, systems layout, and collectors loop design concepts. It presents thumb rules for sizing of systems, design checklist, and installation and commissioning checklist. Chapter 11 covers performance monitoring. It includes information on spot checks for efficiency, maintenance, water quality, smoke density, flame appearance, burner checks, combustion controls, boiler tubes cleanliness, and boiler tune-up. Chapter 12 offers overview of environmental pollution aspect due to various steam boiler emissions. The manual also includes appendices on properties of steam, worked examples on combustion and energy conservation opportunities in boiler operation, boiler control parameters, and unit conversion tables. The aim of this manual is to remind the professionals, managers and technical staff energy efficiency measures. However, it must be well understood that this manual is not a replacement of text books and handbooks on the subject. It will serve as a useful guide for energy engineers who work with the use of steam and heat generation equipment and systems, as part of their responsibilities.
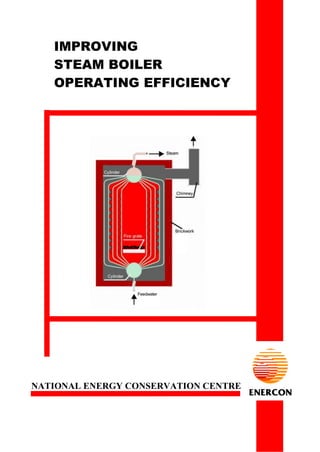
- 17. ENERCON, The National Energy Conservation Centre 3 2 Description of Boilers A boiler is a closed vessel in which water or other fluid is heated under pressure. The steam or hot fluid is then circulated out of the boiler for use in various process or heating applications. Sources of heat for the boiler can be the combustion of fuels such as wood, biomass, coal, oil or natural gas. Electric boilers use resistance or immersion type heating elements. Nuclear fission is also used as a heat source for generating steam. Waste-heat boilers or heat-recovery steam generators use the heat rejected from other processes such as gas turbines. Construction of boilers is mainly limited to copper, steel and cast iron. There are many types of boilers. If operated correctly, all types of modern boilers are more or less equally efficient at converting fuel into steam or hot fluid. 2.1 Boiler Classification Boilers are classified on the basis of: ● General shape ● Boiler size or capacity ● Steam pressure ● Mode of circulation of working fluid ● Nature of heat source, type of fuel and mode of firing ● Position and type of the furnace ● Special features 2.2 Types of Steam Boilers The objectives of a boiler are: ● Releasing energy in the fuel as efficiently as possible. ● Transferring released energy to the water, and generating steam as efficiently as possible. ● Separating steam from water ready for export to the plant, where the energy can be transferred to the process as efficiently as possible. For achieving these objectives, the designers have created innumerable configurations and variations of essentially two general types, i.e., fire-tube and water-tube boilers. 2.2.1 Fire-tube Boilers Fire-tube boilers, also commonly known as shell boilers, rely on hot gases circulating through the boiler tubes which in turn transfer heat to the surrounding boiler water. These gases usually make several passes through the tubes, thereby transferring their heat through the tube walls and causing the water to boil on the other side. Fire-tube boilers are generally available in the range of 20 through 800 boiler horsepower (BoHP) and in pressures up to 10 bars. Different types of shell boilers have been developed, which will now be discussed in detail. 2.2.1.1 Lancashire Boiler Sir William Fairbairn developed the Lancashire boiler in 1844 (Exhibit 2-1) from Trevithick’s single flue Cornish boiler. Although only a few are still in operation, their
- 18. ENERCON, The National Energy Conservation Centre 4 occurrence showed the way to the development and design of sophisticated and highly efficient boilers being used today. The Lancashire boiler, shown in Exhibit 2-1, comprises of large steel shell usually between 5 - 9 m long through which two large-bore furnace tubes called flues are inserted. Part of each flue is corrugated to take up the expansion when the boiler becomes hot, and to prevent collapse under pressure. A furnace is installed at the entrance to each flue, at the front end of the boiler. Typically, the furnace can be arranged to burn coal, fed either manually or automatically stoked. Exhibit 2-1: Lancashire Boiler Capacity Small Large Dimensions 5.5 m long x 2 m dia 9 m long x 3 m dia Output 1,500 kg/hr 6,500 kg/hr Pressure Up to 12 barg Up to 12 barg The hot gaseous products of combustion pass from the furnace through the large-bore corrugated flues. Heat from the hot flue gases is transferred to the water surrounding these flues. The boiler is in a brickwork setting which is arranged to duct the hot gases emerging from the flues downwards and beneath the boiler, transferring heat through the bottom of the boiler shell, and secondly back along the sides of the boiler before exiting through the stack. These two side ducts meet at the back of the boiler and feed the chimney. The passes are designed to extract the maximum amount of energy from the hot product gases before they are released to atmosphere. The efficiency of Lancashire boiler has been improved by the addition of an economizer. The gas stream, after the third pass, passes through the economizer into the chimney. The economizer pre-heats the feed water and results in an improvement in thermal efficiency. One of the drawbacks of the Lancashire boiler is that the expansion and contraction caused due to repeated heating and cooling of the boiler disturbs its brickwork setting and ducting. This gives rise to infiltration of the air through the cracks, which affects the furnace draft. Production of these boilers has now become uneconomical due to considerable amount of materials and labor required. These Lancashire boilers have various significant characteristics: ● Due to their large water capacity and size, they can easily tolerate sudden large steam demands because the resulting reduction in boiler pressure releases abundant amount of flash steam from the boiler water held at saturation temperature. ● Since, these boilers are manually stoked, consequently the response to changes in boiler pressure and steam demand is slow. ● The large volume of water means that although the steaming rate might vary widely, the rate of change of the water level is relatively slow. ● Water level control can be manually operated, and the operator can either start a reciprocating, steam powered feedwater pump, or adjust a feedwater valve to maintain the desired water level.
- 19. ENERCON, The National Energy Conservation Centre 5 ● The low level alarm is simply a float that descends with the water level, and opens a port to a steam whistle when a pre-determined level is reached. ● The large water surface area in relation to the steaming rate means that the rate at which steam is released from the surface (expressed in terms of kg per square meter) is low. This low velocity means that, even with water containing high concentrations of Total Dissolved Solids (TDS), there is plenty of opportunity for the steam and water particles to separate and dry steam to be supplied to the plant. 2.2.1.2 Two-pass, Dry Back Boiler A typical two-pass boiler with dry back configuration is shown in Exhibit 2-2. It is only about half the size of an equivalent Lancashire boiler and relatively more efficient. It comprises of a cylindrical outer shell containing two large-bore flues, into which the furnaces is set. The hot flue gases pass out of the furnace flues at the back of the boiler into a brickwork setting (dry back) and are deflected through a number of small-bore tubes arranged above the large-bore furnace flues. These small bore tubes present a large heating surface to the water. The flue gases pass out of the boiler at the front and into an induced draught fan, which passes them to the chimney. Exhibit 2-2: Two Pass, Dry Back Boiler Capacity Small Large Dimensions 3 m long x 1.7 m dia 7 m long x 4 m dia Output 1,000 kg/h 15,000 kg/h Pressure Up to 17 barg Up to 17 barg These boilers are not in production any more. 2.2.1.3 Two-pass, Wet Back Boiler Exhibit 2-3 shows a more efficient method of reversing the hot gases through a two pass wet back boiler configuration. The reversal chamber is contained entirely within the boiler. This allows for a greater heat transfer area, as well as allowing the boiler water to be heated at the point where the heat from the furnace will be greatest - on the end of the chamber wall. Exhibit 2-3: Two Pass, Wet Back Boiler
- 20. ENERCON, The National Energy Conservation Centre 6 2.2.1.4 Three-Pass, Wet Back Boiler A further development of the fire-tube boiler is the creation of a three-pass wet back boiler which is a standard configuration in use today, (Exhibit 2-4). Exhibit 2-4: Three Pass, Wet Back Boiler This design has been evolved with the advancement in materials and manufacturing technology. Thinner metal tubes have been introduced allowing more tubes to be accommodated, improving the heat transfer rate, and the boilers have also become compact. Typical heat transfer data for a three-pass, wet back, economic boiler is shown in the following table. Area of tubes Temperature Proportion of total heat transfer 1st pass 11 m2 1,600oC 65% 2nd pass 43 m2 400oC 25% 3rd pass 46 m2 350oC 10% 2.2.1.5 Four-pass Boiler Four-pass boiler is potentially most thermally efficient, but fuel type and operating conditions prevent its common use. When this type of unit is fired at low demand with heavy fuel oil or coal, the heat transfer from the combustion gases can be very large. As a result, the exit flue gas temperature falls below the acid dew point, causing corrosion of the flues and chimney and possibly of the boiler itself. The four-pass boiler is also subject to higher thermal stresses, especially with the occurrence of sudden large load swings; these can lead to stress cracks or failures within the boiler structure. For these reasons, four-pass boilers are not accepted for commercial or industrial use. 2.2.1.6 Packaged Boiler In the early 1950s, concentrated research into improving the size and efficiency of boilers lead to the development of packaged boiler (Exhibit 2-5). It is a further development on the three-pass wet back boiler. These boilers were originally designed to use oil rather than coal. The packaged boiler comes as a complete package with burner, level controls, feed pump and all necessary boiler fittings and mountings. Once delivered to site it requires only water, steam and blowdown piping work; and fuel supply and electrical connections for it to be operational. The following factors have played a major role in the development of a modern compact and efficient boiler:
- 21. ENERCON, The National Energy Conservation Centre 7 ● Manufacturers wanted to make the boilers as small as possible to save on materials and hence keep their product competitive. ● Efficiency is aided by making the boiler as small as it is practical; the smaller the boiler and the less its outer surface area, the less heat is lost to the environment. This issue has also been addressed through general universal awareness of the need for insulation and the availability of high performance modern insulating materials. ● Consumers wanted the boilers to be as small as possible to minimize the amount of floor space needed by the boiler house, and hence increase the space available for other purposes. ● Boilers with smaller dimensions (for the same steam output) tend to be lower in capital cost. Exhibit 2-5: Modern Packaged Boiler The following table demonstrates the significant effect of technology developments on the improvement in efficiency of the boilers, reduction in their physical size and other factors: Boiler type Fuel Length (m) Diameter (m) Efficiency (%) Volumetric heat release (kW/m3) Steam release rate from water surface (kg/m2s) Lancashire Coal 9.0 2.75 74 340 0.07 Two Pass Coal 6.0 3.00 76 730 0.12 Packaged Oil 3.9 2.50 82 2,330 0.20 Packaged Gas 3.9 2.50 80 2,600 0.20 2.2.1.7 Reverse Flame / Thimble Boiler This is a variation on conventional boiler design (Exhibit 2-6). The combustion chamber is in the form of a thimble, and the burner fires down the center. The flame doubles back on itself within the combustion chamber to come to the front of the boiler. Smoke tubes surround the thimble and pass the flue gases to the rear of the boiler and the chimney. 2.2.1.8 Advantages of Fire-tube (Shell) Boilers ● The entire steam generator can be purchased as a complete package. Installation requires securing to basic foundations, and connecting to water, electricity, fuel and steam network before commissioning. This minimizes the installation costs. ● The package arrangement is also simple to relocate a packaged shell boiler.
- 22. ENERCON, The National Energy Conservation Centre 8 ● A shell boiler contains a substantial amount of water at saturation temperature, and hence has a substantial amount of stored energy which can be called upon to cope with short term, rapidly applied loads. ● The construction of a shell boiler is generally simple, resulting in easy maintenance. ● Shell boilers often have one furnace tube and burner. It makes the control systems fairly simple. ● Although shell boilers may be designed and built to operate up to 27 bar, the majority are designed to operate at 17 bar or less. This relatively low pressure means that the associated ancillary equipment is easily available at competitive prices. Exhibit 2-6: Thimble or Reverse Flame Boiler 2.2.1.9 Disadvantages of Fire-tube (Shell) Boilers ● The package principle means that approximately 27,000 kg / h is the maximum output of a shell boiler. If more steam is required, then several boilers need to be connected together. ● The large diameter cylinders used in the construction of shell boilers effectively limit their operating pressure to approximately 27 bar. If higher pressures are needed, then a water-tube boiler is required. ● Substantial quantity of water stored in the shell of the boiler. When the boiler is shut down, the energy stored in the boiler water depletes. Therefore, it requires plenty of energy and time at the start-up to build the reserve energy again. 2.2.2 Water-tube Boilers Most high-pressure and large boilers are of water-tube type (Exhibit 2-7). It is important to note that the small tubes in the water-tube boiler can withstand high pressure better than the large vessels of a fire-tube boiler. In water-tube boilers the water is circulated inside the tubes, with the heat source surrounding them. These water-filled tubes are in turn connected to large containers called drums. With the increase in number of tubes of smaller diameter, the heating surface area increases improving the efficiency. Water-tube boilers are available in sizes ranging from a smaller residential type to very large utility class boilers. Boiler pressures range from 1 bar through pressures exceeding 250 bar. They are mostly used in power station applications that require: ● High steam output (up to 500 kg/s). ● High pressure steam (up to 160 bar). ● Superheated steam (up to 550°C). However, water-tube boilers are also manufactured in sizes to compete with shell boilers. Small water-tube boilers are manufactured and assembled into a single unit, just like
- 23. ENERCON, The National Energy Conservation Centre 9 packaged shell boilers, whereas large units are usually manufactured in sections for assembly on site. Exhibit 2-7: Water-tube Boiler Many water-tube boilers operate on the principle of natural water circulation (also known as ‘thermo-siphoning’). Exhibit 2-8 helps to explain this principle: ● Cooler feedwater is introduced into the steam drum behind a baffle. Due to its higher density, the cold feed water descends in the ‘downcomer’ towards the lower or ‘mud’ drum, displacing the warmer water up into the front tubes. ● Continued heating creates steam bubbles in the front tubes, which are naturally separated from the hot water in the steam drum, and are taken off. Exhibit 2-8: Natural Water Circulation in a Water-tube Boiler However, when the pressure in the water-tube boiler is increased, the difference between the densities of the water and saturated steam falls, consequently less circulation occurs. To keep the same level of steam output at higher design pressures, the distance between the lower drum and the steam drum must be increased, or some means of forced circulation must be introduced. As indicated by Exhibit 2-9, there are many different possible combinations of drums and headers. As the arrangement varies, the circulation pattern can become significantly more complex than the simple model shown in Exhibit 2 8. Nevertheless, the basic princi¬ples involved remain the same.
- 24. ENERCON, The National Energy Conservation Centre 10 Exhibit 2-9: Various Water-tube Boiler Configurations 2.2.2.1 Description of Water-Tube Boilers Water-tube boiler sections The energy from the heat source may be extracted in the form of radiation, convection or conduction. Furnace or radiant section (Exhibit 2-10) This is an open area accommodating the flame(s) from the burner(s). If the flames were allowed to come into contact with the boiler tubes, serious erosion and finally tube failure would occur. The walls of the furnace section are lined with finned tubes called membrane panels, which are designed to absorb the radiant heat from the flame. Convection section (Exhibit 2-11) This part is designed to absorb the heat from the hot gases by conduction and convection. Large boilers can have several tube banks (also called pendants) in series, in order to gain maximum energy from the hot gases Exhibit 2-10: Heat Transfer in the Furnace or Radiant Section Exhibit 2-11: Heat Transfer in the Convection Section
- 25. ENERCON, The National Energy Conservation Centre 11 Water-tube boiler classification Water-tube boilers are usually classified according to certain characteristics, as given in the following table: Reservoir drum position For example, longitudinal or cross drum Water circulation For example, natural or forced Number of drums For example, two, three Capacity For example, 25,000 kg/h, 7 kg/s, 55,000 lbs/h 2.2.2.2 Alternative Water-tube Boiler Layouts 2.2.2.3 Open The following layouts work on the same principles as other water-tube boilers, and are available with capacities from 5,000 kg/h to 180,000 kg/h. 2.2.2.3.1 Longitudinal Drum Boiler The longitudinal drum boiler was the original type of water-tube boiler, which operated on the thermo-siphon principle (Exhibit 2-12). Cooler feed water is fed into a drum, which is placed longitudinally above the heat source. The cooler water falls down a rear circulation header into several inclined heated tubes. As the water temperature increases it passes up through the inclined tubes, it boils and its density decreases, therefore circulating hot water and steam up the inclined tubes into the front circulation header which feeds back to the drum. In the drum, the steam bubbles separate from the water and the steam is taken off. Typical capacities for longitudinal drum boilers range from 2,250 kg/h to 36,000 kg/h. Exhibit 2-12: Longitudinal Drum Boiler 2.2.2.3.2 Cross Drum Boiler The cross drum boiler is a variant of the longitudinal drum boiler in that the drum is placed cross ways to the heat source as shown in Exhibit 2-13. The cross drum operates on the same principle as the longitudinal drum except that it achieves a more uniform temperature across the drum. However it does risk damage due to faulty circulation at high steam loads; if the upper tubes become dry, they can overheat and eventually fail. The cross drum boiler has the advantage of being able to serve a larger number of inclined tubes due to its cross ways position. Typical capacities for a cross drum boiler range from 700 kg/h to 240,000 kg/h.
- 26. ENERCON, The National Energy Conservation Centre 12 Exhibit 2-13: Cross-Drum Boiler 2.2.2.3.3 Bent Tube or Stirling Boiler A further development of the water-tube boiler is the bent tube or Stirling boiler shown in Exhibit 2-14. Again this type of boiler operates on the principle of the temperature and density of water, but utilizes four drums in the following configuration. Cooler feed water enters the left upper drum, where it falls due to greater density, towards the lower, or water drum. The water within the water inlet drum and the connecting pipes to the other two upper drums is heated, and the steam bubbles produced rise into the upper drums where the steam is then taken off. The bent tube or Stirling boiler allows for a large surface heat transfer area, as well as promoting natural water circulation. Exhibit 2-14: Bent Tube or Stirling Boiler 2.2.2.4 Advantages of Water-tube Boilers ● They have small water content, and therefore respond rapidly to load change and heat input. ● The small diameter tubes and steam drum mean that much higher steam pressures can be tolerated, and up to 200 bars can be used in power stations.
- 27. ENERCON, The National Energy Conservation Centre 13 ● The design may include many burners in any of the walls, giving horizontal, or vertical firing options, and the facility of control of temperature in various parts of the boiler. This is particularly important if the boiler has an integral superheater, and the temperature of the superheated steam needs to be controlled. 2.2.2.4 Disadvantages of Water-tube Boilers ● They are not as simple to make in the packaged form as shell boilers, which mean that more work is required on site. ● The option of multiple burners may give flexibility, but the 30 or more burners used in power stations means that complex control systems are necessary. 2.3 Coal Based Boilers The combustion systems for solid fuels, i.e. coal and biomass, overlap; and have many common principles and features. The combustion system are similar, and their choice depends on the properties of the fuel, whether coal or biomass. Mostly, the coal boilers are used in power generation. They are very large in capacity as compared to biomass fuel based boilers. Combustion systems for solid fuels have been discussed in Chapter 7. The hot gases from the combustion process move from the bottom left to the top and then down the right hand side of the boiler structure. As the hot gas moves through the boiler it loses energy to the water and the gases becomes cooler as a result. There are various heat exchangers in the boiler which extract energy from the hot gases and transfer it to water. The following Exhibit 2-15 shows the inner workings of a coal fired boiler. The numbers in the exhibit are described below. 0. Coal powder and air are blown into the boiler and combust to form a fireball. 1. Cool feedwater enters the boiler at the bottom right. 2. The feedwater is heated in the economizer by the warm exhaust gases exiting the boiler. 3. The warm feedwater is sent to the steam drum (6) where liquid water is separated from steam formed in the waterwall. In a super critical coal plant steam is not created. Liquid water becomes a supercritical fluid in the superheaters at a pressure of greater than 221 bar and a temperature of greater than 400C. Therefore there is no steam drum. In a supercritical boiler warmed feedwater passes directly into the downcomers. 4. Liquid water flows down the downcomers on the outside of the boiler to the bottom of the boiler. 5. Water flows up the tubes in the waterwalls of the boiler and surround the fireball of burning coal. The water in the tubes is heated by radiation from the fireball. Some of the water in these tubes turns into steam. 6. The steam and water in the waterwall tubes is sent to the steam drum, where steam is separated from liquid water. Liquid water in the steam drum flows down the downcomers on the outside of the boiler. 7. Steam from the steam drum is sent to the primary superheater. 8. Steam is super-heated to a high temperature and pressure in the primary superheaters and then moves to the secondary superheaters. 9. In the secondary superheaters steam meets the very hot gases exiting the top of the boiler. The steam is heated to its final temperature and pressure before leaving the boiler as main steam. The main steam is sent to the high pressure steam turbine. The steam turbines drive a generator which produces electricity. 10. Steam exiting the high pressure steam turbine is called cold reheat. It is reheated in the reheater and sent back to the second steam turbine.
- 28. ENERCON, The National Energy Conservation Centre 14 Exhibit 2-15: Typical Coal Fired Boiler By the time the flue gas exits the boiler most of the energy in the coal will be transferred to the water in the boiler. The hot gases are cleaned up before they are sent to a stack. Feedwater is generally supplied by condensed steam from the low pressure steam turbine. Large amounts of cooling water are used to condense this steam into liquid water in the condenser. 2.4 Small Scale Biomass Fuel Based Boilers Use of biomass as fuel in small-scale boilers is gaining momentum as the energy demand is out-weighing supply. The following section will discuss the efficient operation of small boilers and heating systems based on biomass fuels. 2.4.1 Classification of Different Small-scale Biomass Combustion Systems Based on technologies for small-scale biomass boilers, they can be classified as: ● Manually fed boilers for log wood ● Automatically fed boilers for wood chips ● Automatically fed boilers for wood pellets ● Dual-fuel boilers ● Automatically fed boilers for non-wood fuels
- 29. ENERCON, The National Energy Conservation Centre 15 2.4.1.1 Manually Fed Boilers for Log Wood This is a downdraft boiler; and shows a more stable combustion than in over-fire boilers, which were based on old technology. These are microprocessor controlled. Usually the capacity ranges from 15 to 70 kW; fuel used is wood logs with 33 or 50 cm length. One can use wood briquettes instead. While fuel loading is manual, the burning operation is automatic during combustion batches. Primary and secondary air feed is separate for combustion zones. Draught is regulated by combustion air fan. It produces very low emissions due to improved mixing of fuel and air. Automatic controlled operation typically with lambda (O2) sensor. Exhibit 2-16: Manually Fed Boiler for Log Wood 2.4.1.2 Automatically Fed Boilers for Wood Chips This boiler is based on automatic underfed wood chip stoker burner, having capacity ranging from 50 to 100 kW). Fully automatic operation needs only ash box emptying. Its salient features are: ● Micro-processor controlled load and combustion control similar to pellet boilers ● Proven automatic fuel feeding (screw conveyors, agitators) with burnback protection ● Application in residential heating and micro grids ● Air staging (primary and secondary combustion zone with separate air feed) ● Typically vertical fire tube boilers with automatic or semi-automatic boiler cleaning (with a clear tendency towards automatic boiler cleaning systems) ● Flue gas condensation partly applied
- 30. ENERCON, The National Energy Conservation Centre 16 Explanations: 1. 1. Storage container; 2. 2. Feeding screw; 3. 3. Combustion chamber with radiation plate 4. 4. Heat exchanger with tabulators and cleaning system; 5. 5. Ash container The significant features are: ● Capacity range: >15 up to several 100 kW ● Fuels used: wood chips ● Types: underfed burners, horizontally fed burners, moving grate systems ● Efficiencies of wood chips boilers in the early 1980´s: around 70% ● Average efficiency of modern wood chips boilers: 91% 2.4.1.3 Automatically Fed Boilers for Pellets Exhibit 2-17 shows a typical automatically fed boiler for pellets. Features of such boilers are: ● Fully automatic operation (only ash box emptying is needed) ● Micro-processor controlled (load and combustion control) Load control by regulation of the fuel and primary air feed guided by the feed water temperature Combustion control by regulation of the secondary air feed usually guided by the O2 concentration in the flue gas (lambda sensors) ● Proven automatic fuel feeding (flexible or inflexible screw conveyors, pneumatic systems, agitators or combinations) with burn-back protection ● Air staging (primary and secondary combustion zone with separate air feed) ● Typically vertical fire tube boilers with automatic or semi-automatic boiler cleaning (with a clear tendency towards automatic boiler cleaning systems) ● Pellet boilers with flue gas condensation units available ● Capacity range: 6 to 300 kW Exhibit 2-17: Automatically Overfed Pellet Boiler Explanations: 1. Fuel container 2. Stoker screw 3. Primary combustion chamber with primary air addition 4. Secondary air addition
- 31. ENERCON, The National Energy Conservation Centre 17 5. Secondary combustion chamber 6. Heat exchanger with cleaning device 7. Bottom ash container 8. Fly ash container Further, an automatically fed boiler for wood pellets with integrated flue gas condensation is shown in Exhibit 2-18. It is a very efficient boiler due to flue gas condensation feature. Exhibit 2-18: Automatically Fed Boiler for Pellets with Integrated Flue Gas Condensation 2.5 Boiler Ratings Boiler rating refers to the manufacturers stated capacity of a boiler capable of handling the boiler load. Rating of a boiler is commonly expressed in terms of: ● 'From and At' and Capacity Rating to indicate equivalent evaporation (i.e. kg of steam generated per hour “from and at” 100ᵒC) or kg per hour of steam generated at specified pressure and temperature ● kW Rating for utilities plants and industrial / domestic boilers ● Boiler Horsepower (BoHP) for industrial / domestic boilers ● Heating Surface Area to indicate rate of heat generation / transfer in the furnace 2.5.1 'From and At' and Capacity Rating Normally, boilers are rated by the evaporation rate, i.e. kg/h, tonnes/h, or pounds/h. Now widely boilers are designated with ‘From and At’ rating, which is used as a datum by boiler manufacturers. This boiler rating shows “the amount of steam in kg/h which the boiler can produce ‘from and at 100ᵒC’, at atmospheric pressure”. Each kilogram of steam would then have received 2,257 kJ of heat from the boiler. The rating incorporates the concept of heating surface area, capacity and pressure in one definition. The boilers are often operated with feed water temperatures lower than 100°C. Consequently, the boiler is required to supply heat energy to bring the water up to boiling point. Further, most of the boilers operate at pressures higher than atmospheric pressure for meeting the process requirements, as steam at an elevated pressure attains higher
- 32. ENERCON, The National Energy Conservation Centre 18 temperature and carries more heat energy than does steam at 100°C. Both these effects reduce the actual steam output of the boiler, for the same consumption of fuel. The graph in Exhibit 2-19 shows feed water temperatures plotted against the percentage of the 'from and at' figure for operation at pressures of 0.5, 10 and 15 bargauge. Exhibit 2-19: Feedwater Temperature vs %age of ‘From and At’ Value at Different Pressures The application of the ‘From and At’ rating graph (Exhibit 2-19) is shown in the following example, as well as a demonstration of how the values are determined. Example A boiler has a ‘From and At’ rating of 2,000 kg/h and operates at 15 barg. The feed water temperature is 68°C. Using the graph: Where The percentage ‘from and at’ rating ≈ 90% Therefore actual output = 2,000 kg/h × 90% Boiler evaporation rate = 1,800 kg/h The use of the following equation will determine a factor to produce the same result: CB A factornEvaporatio Where A = Specific enthalpy of evaporation at atmospheric pressure (0 barg) B = Specific enthalpy of steam at operating pressure (in barg) C = Specific enthalpy of water at feedwater temperature Note: These values are all from steam tables Using the information from the example and the above equation, the evaporation factor can be calculated: 2,257 kJ/kg Evaporation Factor = 2,794 kJ/kg - 284.9 kJ/kg Evaporation factor = 0.9 Therefore: boiler evaporation rate = 2,000 kg/h × 0.9
- 33. ENERCON, The National Energy Conservation Centre 19 Boiler evaporation rate = 1,800 kg/h 2.5.2 kW Rating Some manufacturers will give a boiler rating in kW. This is not an evaporation rate, and is subject to the same ‘from and at’ factor. To establish the actual evaporation by mass, it is first necessary to know the temperature of the feed water and the pressure of the steam produced, in order to establish how much energy is added to each kg of water. The following equation can then be used to calculate the steam output: 3,600 s/h Steam Output (k /h) Boiler Rating (kW) Energy to be added (kJ/kg) Example A boiler is rated at 3,000 kW rating and operates at 10 barg pressure with a feed water temperature of 50°C. How much steam can be generated? (1 kW = 1kJ/s) Using steam tables: Energy content of feed water at 50ᵒC = 209.5 kJ/kg Energy content of steam at 10 barg = 2,782 kJ/kg Energy provided by the boiler = 2,782 – 209.5 = 2,572.5 kJ/kg Steam output = 3,000 kJ/s × 3,600 s/h 2,572.5k J/kg = 4,198 kg/h 2.5.3 Boiler Horsepower (BoHP) Commonly accepted definition of a boiler horsepower is the amount of energy required to evaporate 34.5 lb per hour of water at 212ᵒF under atmospheric conditions (i.e. evaporation of 15.65 kg per hour of water at 100ᵒC). Therefore, the steam output of a boiler rated at 500 BoHP will be: = 500 BoHP × 15.65 kg/h = 7,825 kg/h In some countries, the BoHP is taken as a function of the heat transfer area in the boiler, and a boiler horsepower relates to 1.58 m2 (17 ft²) of heating surface. BoHP rating is essentially the same as a 'from and at' rating, so using feed water at lower temperatures and steam at higher pressures will reduce the amount of steam generated. In practice, a BoHP figure of 28 to 30 lb/h (12.7 to 13.6 kg/h) would be a more realistic maximum continuous rating, taking into account the steam pressure and average feed water temperatures. 2.5.4 Heating Surface Area Boiler size is also designated by its capacity to produce steam or the rate of heat transfer, usually in Btu/h or kcal/h. The heating surface area in sq. meters or sq. feet of the tubes and other combustion area is also common method of designating the boiler size. Boilers vary in the ratio of heating surface to boiler horsepower, from 0.186 to about 0.93 m2 (2 – 10ft2) per boiler horsepower. Heating surface requirements depend upon duty of evaporating tubes, super-heaters, furnace convection and radiation sections, economizers and air pre-heaters.
- 34. ENERCON, The National Energy Conservation Centre 20 2.6 Heat and Steam Release Rates 2.6.1 Volumetric Heat Release (kW/m3) This factor is calculated by dividing the total heat input by the volume of water in the boiler. It effectively relates the quantity of steam released under maximum load to the amount of water in the boiler. The lower the factor the greater is the amount of reserve energy in the boiler. The volumetric heat release for a modern boiler relative to a Lancashire boiler is larger by a factor of almost eight, indicating a reduction in stored energy by a similar amount. This means that a reduced amount of stored energy is available in a modern boiler. This development has been made possible by control systems which respond quickly and with appropriate actions to safeguard the boiler and to satisfy demand. It characterizes the energy release rate per unit volume (qv), kW/m3 of the furnace according to following equation: qv = Gs × H/Vf Where Gs = Steaming capacity of the boiler, kg/s H = Calorific value of the fuel, kJ/kg Vf = Volume of furnace, m3 2.6.2 Steam Release Rate (kg / m2 s) This factor is calculated by dividing the amount of steam produced per second by the area of the water plane. The lower this number, the greater the opportunity for water particles to separate from the steam and produce dry steam. Its value for the modern boilers is larger by a factor of almost three. This means that there is less opportunity for the separation of steam and water droplets. The situation further worsens with increase in total dissolved solids (TDS) in boiler water. Therefore, accurate control is essential for efficiency and the production of dry steam. At times of rapidly increasing load, the boiler will experience a reduction of pressure, which, in turn, means that the density of the steam is reduced, and even higher steam release rates will occur, and progressively wetter steam is exported from the boiler.
- 35. ENERCON, The National Energy Conservation Centre 21 3 Fuels, Combustion and Efficiency 3.1 Fossil fuels Fuels such as coal, oil and natural gas were formed over millions of years from organic matter like plankton, plants and other life forms. Over time, sand, sediment and rock buried the organic matter and it eventually formed large quantities of fuels. These underground resources, known as fossil fuels, are still the primary fuel source for electricity, heating and powering vehicles around the globe. There are three major forms of fossil fuels: coal, oil and gas. Coal is a combustible black or brown sedimentary rock made mostly of organic carbon. It is typically found as layers (coal beds) or veins (coal seams). There are two main types of coal: ‘thermal’ coal is mostly used for power generation, and ‘metallurgical’ coal is mostly used for steel production. Thermal coal is more abundant, has lower carbon content and is higher in moisture than metallurgical coal. Natural gas is a combustible mix of hydrocarbon gases. It is colorless and consists mainly of methane (CH4). ‘Conventional gas’ is easily extracted; ‘unconventional gas’ requires more sophisticated extraction technologies. Conventional natural gas is found in permeable sandstone reservoirs and is easy to get out of the ground through traditional well drilling techniques. Unconventional gas is just standard natural gas, but found in places other than permeable sandstone reservoirs. There are two main types of ‘unconventional gas’: (1) coal seam gas (CSG), found in coal deposits, usually 200 to 1,000 meters below the ground; and (2) shale gas, found in shale rock deposits. The wells for extracting this gas are generally a lot deeper than those for CSG. Oil is liquid fuel made of hydrocarbons. It is mostly known as crude oil or condensate, but includes all liquid hydrocarbon fossil fuels and other liquid organic compounds. Petroleum and liquefied petroleum gas (LPG) are the most common types of fuel obtained from oil extraction and refining. Liquefied petroleum gas or LPG is heavier than natural gas. The term petroleum refers to both naturally occurring unprocessed crude oils and petroleum products made of refined crude oil. 3.2 Biomass Fuels Biomass is biological material derived from living, or recently living organisms. In the context of biomass for energy this is often used to mean plant based material. The term can equally apply to both animal and vegetable derived materials. It is any organic matter-wood, crops, forestry residues, seaweed, animal wastes – that can be used as an energy source. Biomass is probably our oldest source of energy after the sun. For thousands of years, people have burned wood to heat their homes and cook their food. Biomass is a renewable energy source because its supplies are not limited. People can always grow trees and agriculture crops and waste will always exist. 3.2.1 Chemical Composition of Biomass Fuels Biomass is carbon based and is composed of a mixture of organic molecules containing hydrogen, usually including atoms of oxygen, often nitrogen and small quantities of other elements, including alkali, alkaline earth and heavy metals. These metals are often found in
- 36. ENERCON, The National Energy Conservation Centre 22 functional molecules such as the porphyrins, which include chlorophyll which contains magnesium. The carbon used to construct biomass is absorbed from the atmosphere as carbon dioxide (CO2) by plant life, using energy from the sun. Plants may subsequently be eaten by animals and thus converted into animal biomass. However the primary absorption is performed by plants. If plant material is not eaten it is generally either broken down by microorganisms or burned: ● If broken down it releases the carbon back to the atmosphere, mainly as either carbon dioxide (CO2) or methane (CH4), depending upon the conditions and processes involved. ● If burned the carbon is returned to the atmosphere as CO2. These processes have happened for as long as there have been plants on earth and is part of what is known as the carbon cycle. A continuous program of replanting with the new growth will take up CO2 from the atmosphere at the same time as it is released by combustion of the previous harvest. This maintains a closed carbon cycle with no net increase in atmospheric CO2 levels. However, biomass also includes plant or animal matter used for production of fibers or chemicals. The vital difference between biomass and fossil fuels is one of time scale. 3.3 Categories of Biomass Materials There are five basic categories of material: ● Virgin wood: from forestry, from wood processing ● Energy crops: high yield crops grown specifically for energy applications ● Agriculture residues: residues from agriculture harvesting and processing ● Food waste: from food and drink manufacture, preparation and processing, and post- consumer waste ● Industrial waste and co-products from manufacturing and industrial processes. 3.4 Thermal Properties of biomass Each type of biomass has specific properties that determine its performance as a fuel in combustion or gasification devices or both. The most important properties relating to the thermal conversion of biomass are as follows: ● Moisture content ● Ash content ● Volatile matter content ● Elemental composition ● Heating value ● Bulk density 3.4.1 Moisture Content The moisture content of biomass is the quantity of water in the material, expressed as a percentage of the material’s weight. This weight can be referred to on a wet basis, on a dry basis and on a dry and ash-free basis. If the moisture content is determined on a “wet” basis, the water’s weight is expressed as a percentage of the sum of the weight of the water, ash and dry-and-ash-free matter. Similarly, when calculating the moisture content on a “dry” basis, the weight of water is expressed as a percentage of the weight of the ash and dry-and-
- 37. ENERCON, The National Energy Conservation Centre 23 ash-free matter. Finally, the moisture content can be expressed as percentage for the “dry- and-ash-free” matter content. In that last case, the water’s weight is related to the weight of the dry biomass. Because the moisture content affects the value of biomass as a fuel, the basis on which the moisture content is measured must always be mentioned. This is of particular importance because biomass materials exhibit a wide range of moisture content (on a wet basis), ranging from less than 10 percent for cereal grain straw up to 50-70 percent for forest residues. The following table explains basis of analysis: Basis of Analysis of Solid Fuels including Biomass To obtain: Air Dry Dry Basis As Received multiply ar by: 100 - IM% 100 - TM% 100 100 - TM% ad by: 100 100 - IM% 100 - TM% 100 - IM% db by: 100 - IM% 100 100 - TM% 100 [For daf, multiply db by 100/(100-A)] Definitions As Received (ar): includes Total Moisture (TM) Air Dried (ad): includes Inherent Moisture (IM) only Dry Basis (db): excludes all Moisture Dry Ash Free (daf): excludes all Moisture and Ash The Proximate Analysis of any solid fuel i.e. the % content of Moisture, Ash (A), Volatile Matter (VM), Fixed Carbon (FC) – also Sulfur (S) and Calorific Value (CV) – can be expressed on any of the above bases. 3.4.2 Ash Content The inorganic component (ash content) can be expressed in the same way as the moisture content on a wet, dry and dry-and-ash-free basis. In general, the ash content is expressed on a dry basis. The inherent ash value, an integral part of the plant structure, which consists of a wide range of elements; represent less than 0.5 percent in wood, 5 to 10 percent in diverse agricultural crop materials and up to 30 to 40 percent in rice husk. The total ash content in the biomass and the chemical composition of the ash are both important. The composition of the ash affects its behavior under the high temperatures of combustion and gasification. 3.4.3 Volatile Matter Content Volatile matter refers to the part of the biomass that is released when the biomass is heated (up to 400 to 500 ᵒC). During this heating process, the biomass decomposes into volatile gases and solid char. Biomass typically has a high volatile matter content (up to 80 percent), whereas coal has a low volatile matter content (less than 20 percent) or in the case of anthracite coal, a negligible one. 3.4.4 Elemental Composition The composition of the ash-free organic component of biomass is relatively uniform. The major components are carbon, oxygen and hydrogen. Most biomass also contains a small proportion of nitrogen. Following table presents the average range of percentages. Elementary composition of typical biomass as derived from Ultimate Analyses
- 38. ENERCON, The National Energy Conservation Centre 24 Element Symbol Weight percent (dry-and-ash-free basis) Carbon C 44-51 Hydrogen H 5.5-6.7 Oxygen O 41-50 Nitrogen N 0.12-0.60 Sulfur S 0.0-0.2 3.4.5 Heating Value The heating value of a fuel is an indication of the energy chemically bound in the fuel with reference to a standardized environment. The standardization involves the temperature, state of water (vapor or liquid) and the combustion products (CO2, H2O etc.). The energy chemically bound in the fuel is given by the heating value of the fuel in energy (Joules) per amount of matter (kg). This energy cannot be measured directly but only with respect to a reference state. Reference states may differ, so a number of different heating values exist. The best known are the lower heating value (LHV) and higher heating value (HHV); also called as Net and Gross Calorific Values respectively. For the LHV, the reference state of water is gaseous state; for the HHV; the reference state of water is its liquid state. Biomass always contains some water, which is released as vapor upon heating. This implies that some of the heat liberated during the chemical reactions is absorbed by the evaporation process. For this reaction, the net heating value (LHV) decreases as the moisture content of the biomass increases (even apart from the fact that a higher moisture content of combustible matter, which on a wet basis also decreases the net heating value per kilogram of biomass). The only effect of moisture content on HHV is the lower content of combustible matter per kilogram of biomass fuel. The heat of evaporation is recovered completely by condensation of the water vapor when the flue gases are brought into the reference state belonging to HHV. 3.4.6 Bulk Density Bulk density refers to the weight of material per unit of volume. For biomass, this is commonly expressed on an oven-dry-weight (moisture content= 0 percent) or an as-is basis, with a corresponding indication of moisture content (MCw). Similar to biomass moisture contents, biomass bulk densities show extreme variation from lows of 150-200 kg/m3 to 600-900 kg/m3. Together, heating value and bulk density determine the energy density, that is, the potential energy available per unit volume of the biomass. In general, biomass energy densities are approximately one-tenth that of fossil fuels such as petroleum or high quality coal. 3.5 Biomass Fuels and Pakistan In Pakistan, most common biomass fuels are cotton stalk, wheat straw, rice husk, sugarcane trash, bagasse and other crops residues. Currently, most of these biomass products are treated as biomass waste and is usually burned in the fields. Biomass burning has a significant impact on global atmosphere chemistry since it provides large sources of carbon monoxide, nitrogen oxides and hydrocarbons. The waste products which are the main contributors to biomass burning are bagasse, rice straw and husk, cotton wastes, barley residue, maize stalks and leaves, and millet and sorghum stalks. Sugar cane provides the next sizeable residue with two major crop wastes; the leaves and stalk and bagasse, the crop processing residue from sugar mills. The cotton crop also gives significant residue in the form of stalks and husks.
- 39. ENERCON, The National Energy Conservation Centre 25 Biomass resources, particularly residues from wood processing, agricultural crops and agro- processing, are under-utilized in Pakistan. These resources are renewable, environmentally friendly in energy production and sustainable in terms of supply. Some of these residues are already used as raw materials for other products (such as particle board and fiber-board) as fodder and fertilizer or as household and industrial fuels. However, large portions are still unused and represent potential sources of energy. Energy generation technologies specifically designed to use biomass residues are available and are becoming more and more economical. Pakistan has yet to make optimum use of the additional power generation potential from its biomass residue resources, which could help it to partially overcome the long-term problem of energy supply. The following data of major agro-based biomass will certainly help to way forward for the implantation of power projects. 3.6 Bagasse Bagasse is comprised of lingo cellulosic residues and is a by-product of Sugar cane. Bagasse is essentially the fibrous waste left containing 48-50% cellulose; after the Sugar cane is extracted for crystallizing into sugar. Bagasse has considerable potential as biomass fuel since it arises mainly at sugar factories. Each fresh tonne of sugar cane brought into the sugar factory for processing yields around 300 kg of the residual fiber which has useful energy content. Sugar cane top and cane trash normally ranges from 15 to 23% by weight of sugar cane. Sugar cane top and trash is usually used as a fodder for animals. Presently, almost all power requirements of sugar mills are met by using bagasse as a fuel but it is pertinent to mention that some of sugar mills are producing surplus power to the grid. In fact, sugar mills in Pakistan either have established the improved technology in their existing facilities or these are in process for generating surplus power to the National Grid at the moment. Approximately 96-98% bagasse produced from cane is consumed in all sugar mills (operating) in the country to meet the steam requirements for sugar and for in house and surplus power requirements. Annual production of sugar cane top and trash, and bagasse is in the range of: Sugar cane top and trash: 13 million tonnes Bagasse: 20 million tonnes 3.7 Cotton Wastes and Cotton Stalks Cotton is one of the most important crops of Pakistan; due to local production of raw cotton Pakistan’s textile industry is dependent on its production volume. Pakistani cotton is best in the world in medium and short staple, the waste/contamination produced from cotton can be a huge source for energy generation. Significant cotton wastes are produced; one from the raw cotton at the time of ginning and the other waste produced from its lint after processing it in spinning and recycling units. These wastes can be successfully used for combustion in biomass fired plants in order to meet energy requirements commercially. Average annual ginning waste: 121,920 tonnes Average annual waste after Spinning and recycling: 98,425 tonnes 3.8 Rice Husk Rice husks are one of the commonest global agricultural residues and by-products of rice paddy milling industries. Rice husks have 45-53% cellulose and hemicelluloses, lignin and
- 40. ENERCON, The National Energy Conservation Centre 26 protein ranges 25-30%. The husks have a relatively high silica content of about 13-17% which can cause an ash problem and possible slagging within the boiler on combustion. However, their homogeneous nature lends this biomass resource to more efficient combustion. As per the research, 100 kg of paddy contains almost 67 kg of rice and 33 kg of bran powder, and husk and dust. Rice husk produced 3.4 million tonnes Annual quantity of Paddy straw 20.6 million tonnes 3.9 Wheat Straw Cereal straw from small cereal crops as wheat is produced at around 2.5-5/ha depending on crop type, variety and the growing season. It is estimated that equivalent yield of wheat straw is produced by weight from wheat crops. Wheat straw is almost 40% cellulosic in nature. It is also pertinent to mention that almost all the wheat straw is generated in the field when the wheat crops are to be processed through ripper machines, combined harvesters or manually cutting tools and readily available to Flour Mills for producing flour. No countable/significant wastages are produced in Flour Mills or in the field that can be used as a burning fuel because all wheat is converted into flour and farina (cream of wheat). In terms of comparative gross energy values, 1 tonne of straw equates approximately 0.5 tonne of coal or 0.3 tonne of oil. It has higher silica content than other forms of biomass, leading to ash contents of up to 10% by weight. Wheat straw produced in Pakistan is heavily consumed as fodder to about 88% of its overall production. Wheat straw is utilized as a basic raw material to approximately 5% of its overall production for pulp manufacturing for producing paper and paper board in the country. Equivalent production of wheat straw = 23 million tonnes Approximately 88% utilization of wheat straw as fodder to animals = 21.05 million tonnes About 5% is utilized for pulp, paper and paperboard manufacturing = 1.196 million tonnes About 5% is taken by brick manufacturers for burning it as a fuel = 1.196 million tonnes Exhibit 3-1: Properties of different Biomass Resources Biomass Resource Moisture Contents (%) Volatile Matter (%) Ash Contents (%) Fixed Carbon (%) High Heating Value (kcal/kg) Rice Husk 10.4 64.25 14.08 11.27 3826.96 Cotton Stalk 20.86 60.66 6.28 12.2 3296 Wheat Straw 6.34 61.73 17.64 14.29 3712.37 Bagasse 25.25 48.98 13.45 12.32 3673.6 Appendix-B describes the processing of solid fuel prior to combustion. 3.10 Combustion Principles Carbon and hydrogen are the main ingredients of common fossil biomass fuels. Their reaction with oxygen, existing in the air, is called “Combustion or Burning”. It is an exothermic chemical reaction and produces carbon dioxide and water in case of complete combustion. Complete combustion is generally impossible to achieve unless the reaction occurs under carefully controlled conditions. Sulfur is often present in fuels but is usually of minor importance from the energy point of view, although its effect may be very significant in terms of corrosion and environmental problems.
- 41. ENERCON, The National Energy Conservation Centre 27 Appendix-C further explains the combustion calculations. Complete combustion reaction of carbon and hydrogen is symbolized by the following equation: Fuel Air Combustion Heat C + H2 + O2 + N2 CO2 + H2O + N2 The stoichiometric equation of combustion reactions is: C + O2 CO2 2H2 + O2 2H2O Combustion of Natural Gas is as below: CH4 + 2O2 CO2 + 2H2O Where C = Carbon H = Hydrogen O = Oxygen N = Nitrogen For a fuel with a given carbon and hydrogen content, it is therefore possible to calculate the theoretical amount of oxygen needed for complete combustion. This quantity of oxygen is referred to as the stoichiometric requirement for oxygen (this may also be expressed in terms of equivalent air). The stoichiometric oxygen or air requirement is of primary interest in the evaluation of combustion efficiency and provides an important reference point against which the actual combustion conditions can be compared. Values of the stoichiometric air requirement for several common fuels are given in Exhibit 3-2. Exhibit 3-2: Stoichiometric Air Requirements for Combustion F U E L Air required (1) lb/10,000 Btu kg/10,000 kcal Anthracite 6.87 12.37 Bituminous coal (medium volatile) 7.77 13.99 Subbituminous coal 7.56 13.61 Lignite 7.52 13.54 High temperature coke 7.96 14.33 Petroleum coke 7.73 13.91 Hardwoods 7.15 12.87 Softwoods 7.11 12.80 Bagasse 6.59 11.86 Naphtha (600API) 7.46 13.43 Kerosene (450API) 7.42 13.36 Gas oil (30°API) 7.45 13.41 Fuel oil (150API) 7.58 13.64 Natural Gas (pure methane) 7.20 12.96 Propane 7.24 13.03 Butane 7.26 13.07 Blast furnace gas 5.82 10.48 Coke oven gas 6.80 12.24 (1) Expressed per 10,000 Btu or 10,000 kcal of higher heating value of fuel fired In practice, since combustion conditions are never ideal, more than the theoretical amount of air must be supplied to achieve complete combustion. The actual quantity of combustion air required for a particular boiler depends on many factors, such as fuel type and composition, furnace design, firing rate, and the design and adjustment of the burners. The additional supply of combustion air above the theoretical requirement is called excess air and is usually expressed as a percentage of the stoichiometric requirement. Thus, use of double the amount of air theoretically required would result in an excess air rate of 100%. Some typical excess air requirements are shown in Exhibit 3-3. Note that these are typical figures which represent "good' combustion practice", and there will be some installations
- 42. ENERCON, The National Energy Conservation Centre 28 able to demonstrate consistent operations at excess air rates lower than those indicated in Exhibit 3-3. Exhibit 3-3: Typical Air Requirements Fuel Type of Furnace or Burners Excess air % by weight Pulverised coal Fully water-cooled furnace with slag tap or dry ash removal 15 – 20 Coal Spreader stoker Chain grate and traveling grate Underfeed stoker 30 – 60 15 – 50 20 – 50 Fuel oil High capacity/efficiency register burners Typical industrial boiler unit 5 – 10 10 – 20 Natural gas Register type burners Multifuel burners 5 – 10 7 – 12 Blast furnace gas Intertube nozzle burners 15 - 18 Biomass / Wood Dutch oven and Hoffit type 20 - 25 Bagasse All furnaces 25 - 35 Black liquor Recovery furnaces for kraft and soda pulping processes 5 - 7 3.11 Combustion Exhaust Gas Composition The addition of either more or less air to a fuel than the stoichiometric requirement causes changes to be observed in the composition of the combustion gases leaving the boiler. The importance of this is that by measuring these exhaust gases; a good understanding of the combustion process within the boiler can be obtained. The principles involved are graphically presented in Exhibit 3-4 and explained as follows: Exhibit 3-4: Relationship Between Excess Air, CO2, O2, and CO in flue gases Deficient Air Excess Air Combustion
- 43. ENERCON, The National Energy Conservation Centre 29 1. At air rates below those required for complete combustion (point A), it is not possible to convert all the carbon contained in the fuel to carbon dioxide. Under these conditions, carbon monoxide is produced as a result of partial combustion: 2C + O2 → 2CO + heat Hence, the composition of combustion exhaust gases will show a high level of CO and a low level of CO2. 2. As more air is added (point B), some of the CO is converted to CO2 with the release of more heat: 2CO + O2 → 2CO2 + heat The CO level in the combustion exhaust gas falls sharply and the CO2 level rises. 3. At the point where the stoichiometric air requirement is supplied (point C), the entire CO would have been converted to CO2 in an ideal system. Since no practical combustion system is perfect, we would expect the CO to have reached a low level and the CO2 to be near a maximum in the exhaust gases. A small amount of oxygen will normally be present in the combustion exhaust gas just prior to reaching the stoichiometric air point. This is because no practical burner system ensures perfect mixing of oxygen with the fuel, and hence there will always be some oxygen present at the same time as CO. 4. To achieve "complete" combustion, a small amount of air must be added over and above the stoichiometric requirement. The minimum excess air required is shown as "normal operation" (point D) in Exhibit 3-4. At this point, the CO2 level reaches a peak (typically. around 15-16% for oil fuels, and 11-12% for natural gas). The exhaust gas oxygen level at the normal operating point will typically be around 2%, and there should be no visible smoke, while the CO concentration should be very low, not exceeding 100-200 ppm in a well-maintained boiler. 5. As further air is added (Point E), the exhaust gas CO2 level drops due to dilution with the excess air, while the oxygen level builds towards 20.9%. High excess air rates are wasteful because of the introduction of oxygen and associated nitrogen (which does not take part in the combustion process) enter the system as cool air and leave it as hot flue gas, thus taking away valuable sensible heat from the combustion system. The amount of excess air can be readily estimated for conventional combustion processes by using the following equation: 2 2 2 %O - 0.5 %CO % Excess Air 100 0.264 %N - %O - 0.5 %CO Where %O2 is the percent oxygen, %CO is the percent carbon monoxide, if any, and %N2 is the percent nitrogen in the exhaust stream. The concentrations may be on a wet or dry basis as long as they are consistent. The percent nitrogen in the exhaust stream is usually not measured and is estimated by subtracting the sum of the carbon dioxide, oxygen, and carbon monoxide percentages from one hundred. That is: 2 2 2 % N = 100 - %CO + %O + %CO The factor 0.264 in the denominator of the excess air equation [discussed below] is the ratio of the percent oxygen to nitrogen by volume in air (20.9 / 79.1). When nitrogen in the exhaust stream is multiplied by this ratio, it provides an estimate of the oxygen entering the process. This occurs because the amount of nitrogen leaving the process is assumed to be the same as the nitrogen entering the process in the air. This estimate assumes that there is little or no nitrogen in the fuel and that air is the source of oxygen. This equation should thus not be used for processes using coke oven or blast furnace off gas as fuel, since they have high levels of nitrogen, or when oxygen enrichment is used. The relatively small amount of nitrogen that reacts to form nitrogen oxides is negligible in this estimate.
- 44. ENERCON, The National Energy Conservation Centre 30 The percent excess air equation thus relates the oxygen left over in the exhaust gas to the oxygen required in the process. The oxygen required in the process is equal to the amount of oxygen entering the process minus the amount left over as measured in the exhaust stream. The oxygen content in the exhaust stream must be “adjusted” or corrected for any carbon monoxide remaining in the stream. It is done by subtracting one-half of the measured carbon monoxide, if any, from the oxygen concentration. The resulting value represents the oxygen concentration that would be present if all the carbon monoxide had been combusted to carbon dioxide. Only one-half of a mole of oxygen is required to complete the combustion of carbon monoxide to carbon dioxide. Example The following example illustrates the excess air calculation procedure: CO2 measured in the exhaust duct = 10.0% O2 measured in the exhaust duct = 8.0% CO measured in the exhaust duct = 0.05% The estimated nitrogen content would be: %N2 = 100 - (10.0 + 8.0 + 0.05) = 81.95% The estimated excess air oxygen would be: 8.0 - 0.5 0.05 % Excess Air 100 58.4% 0.264 81.95 - 8.0 - 0.5 0.05 The importance of accurately measuring the carbon dioxide, oxygen, and carbon monoxide in the exhaust stream cannot be overemphasized when estimating excess air rates for a combustion operation and for correcting atmospheric emission concentrations to a specific basis or standard such as 12 percent CO2, seven percent O2 or 50 percent excess air. Correcting or adjusting an emission concentration such as the particulate concentration to a specific carbon dioxide or oxygen concentration, or excess air rate accounts for dilution of the exhaust stream. Dilution is caused by high excess air rates or by outside air leaking into the exhaust duct, which in turn reduces or dilutes pollutant concentrations. The excess air rates do not affect the rate or quantity of emissions (e.g. kg per hour or kg per million kcal of heat input) only the emission concentrations. An estimate of excess air is of course only as good as the values used in the calculation, and great care must be used in making measurements for carbon dioxide, oxygen and carbon monoxide. An Orsat apparatus or other analytical instrument should be used to measure these gaseous concentrations in an integrated sample taken during a period of stable operation. Alternatively, instrumental gas analyzers could be used if carbon monoxide was also measured. Calculations involving combustion gas composition and the estimation of excess air are also discussed in a later chapter. 3.12 Boiler Efficiency Efficiency is used as a measure of economic performance of any piece of equipment. There are several terms used to define efficiency when used in the context of a boiler. These include simply efficiency, combustion efficiency, thermal efficiency, boiler efficiency, and fuel-to-steam efficiency. Following are their definitions.
- 45. ENERCON, The National Energy Conservation Centre 31 3.12.1Combustion Efficiency Combustion efficiency is the effectiveness of the burner only and relates to its ability to completely burn the fuel. The boiler has little bearing on combustion efficiency. A well- designed burner will operate with as little as 15 to 20% excess air, while converting all combustibles in the fuel to thermal energy. Combustion efficiency equals the total heat released in combustion, minus the heat lost in the stack gases, divided by the total heat released in combustion. For example, if 1,000 kcal/h are released in combustion and 180 kcal/h are lost in the stack, then the combustion efficiency is 82%: 1,000 - 180 100 82% 1,000 3.12.2Thermal Efficiency Thermal efficiency is the effectiveness of heat transfer in a boiler. It does not take into account boiler radiation and convection losses - for example, from the boiler shell, water column piping, etc. 3.12.3Fuel to Boiler Efficiency (Fuel-to-Steam Efficiency) The term "boiler efficiency" is often substituted for combustion or thermal efficiency. True boiler efficiency is the measure of fuel-to-steam efficiency as discussed in this section. Fuel-to-Steam efficiency is the most important, because it is a measure of the energy that is converted to steam. Fuel-to-Steam efficiency is equal to combustion efficiency less the percent of heat losses through blowdown, radiation and convection. For example, as in the example above, 20 kcal/h are lost to blowdown, and convection and radiation then these losses are 2%: 20 Convection and Ratiation Losses 100 2% 1,000 If the combustion efficiency for this same case is 82% then the Fuel-to-Steam efficiency is 80%: Fuel to Steam Efficiency 82% - 2% 80%, or 1000 - 180 20 Fuel to Steam Efficiency 100 2% 1,000 Fuel-to-steam efficiency is the correct definition to use when determining boiler efficiency. In this manual, the term boiler efficiency is used in place of fuel-to-steam boiler efficiency calculated under steady operating conditions. (Note: When comparing efficiencies it is important to know if the efficiency is based on the Gross calorific value {high heat value (HHV)} or Net calorific value {low heat value (LHV)} of the fuel. Both are essentially "correct" but comparing an efficiency based on HHV to one based on LHV value would not be correct. In the United States boiler efficiencies are, typically, based on the HHV. In Europe they are, typically, based on the LHV and result in a higher value than when based on HHV. The general relationship is: For natural gas: % Efficiency based on LHV 1.11 % Efficiency based on HHV For diesel fuel oil: % Efficiency based on LHV 1.06 % Efficiency based on HHV
- 46. ENERCON, The National Energy Conservation Centre 32 Typical efficiencies of various types of boilers are: Type of boiler Net Efficiency (%) Packaged, three pass 87 Water-tube boiler with economizer 85 Two pass, economic 78 Lancashire boiler 65 Lancashire boiler with economizer 75 3.13 Computing Boiler Efficiency and Losses The efficiency of a boiler is defined as the ratio of heat gained by the feed water as it is turned into steam to the total energy available from the fuel supplied. In other words, it is a measure of the ability of a given boiler to efficiently generate the required amount of steam with minimum heat losses from a given fuel supply. To build a boiler that had little or no heat loss would be extremely expensive and practically impossible. Therefore, boiler efficiency is always less than 100%. However, many of the heat losses can be minimized through proper operating and maintenance practices. Energy losses are sorted principally in five categories: ● Heat carried out of the stack by hot flue gases, excluding water vapor ("dry flue gas loss") ● Heat carried out of the stack by hot water vapor, including both sensible and latent heat ● Unburned fuel and products of incomplete combustion, including solid combustibles in ash and carbon monoxide in flue gas ● Heat lost from the boiler structure through the insulation (radiation and convection losses from the outside surface) ● Heat carried away with the boiler blowdown Improvements in boiler efficiency result primarily from reductions in waste heat energy losses in the combustion gases, by ensuring that the boiler is well insulated, and by controlling boiler blowdown (with or without heat recovery from the blowdown). 3.13.1Computing Boiler Efficiency The following two methods can be used to compute overall boiler efficiency: 3.13.1.1 "Direct Method" Boiler efficiency simply relates energy output to energy input, usually in percentage terms. It is represented as: Heat Exported in Steam Boiler Efficiency % 100 Heat Provided by the Fuel The terms 'heat exported in steam' and 'heat provided by the fuel' are covered in detail in the subsequent two Sections. Heat Exported in Steam This is calculated (using the steam tables) from availability of following information: ● Feedwater rate and temperature ● Pressure of exported steam ● Steam flow rate