SlideShare ist ein Scribd-Unternehmen logo
1 von 2
Suezmax Rate 2016:
 Suezmax rates faced a tough time till the months of 2016 gone so far (graph below is a mere
reflection of the same)
Suezmax Rates (WAF-USG) - 2013 to 2016ytd
Source: Poten
 The most noticeable Suezmax trade development in 2016 was the comeback of North
American imports from West Africa
 The WTI/Brent spread narrowed due to a combination of
a) declining shale oil production and reduced logistical constraints and
b) the lifting of the U.S. crude export ban,
making the crude oil imports that are priced on Brent (such as West African crudes), become
competitive again
 Though during the first 7 months of 2016, Suezmaxes performed 157 voyages from West
Africa to North America, 95 more that over the same period in 2015, West African exports
being affected by attacks on Nigerian oil infrastructure, causing production to decline by
about 250 thousand barrel per day (Kb/d) in July, compared to a year earlier put a pressure
on Suezmax trade
 The lifting of the Iran sanctions helped Suezmax demand; India also increased crude oil
imports from Iran, resulting in 40 Suezmax shipments in 2016 ytd compared to 16 over the
comparable period in 2015
 Over the first 7 months of the year, the total number of Suezmax cargoes increased to
3,501 from 3,452 in 2015. The total number of voyages with discharge ‘East of Suez’
increased by 5.4%, while the number of voyages with destinations in the Atlantic basin
decreased by 0.8%, continuing the diversification of Suezmax trades from the Atlantic Basin
to the Pacific
 Growth in Suezmax voyages from South America to the Far East added significantly to ton-
mile demand, even though the number of voyages is relatively modest
 Majority of the new vessels were delivered earlier this year, which might explain the gradual
decline in rates as the year progressed
It can be expected with the return of normal winter market and recovery of Nigerian
production Freight Market for Suezmax may improve, however new deliveries will increase the
supply level which may ultimately turn out to be a hindrance for rate improvement.

Weitere ähnliche Inhalte

Andere mochten auch

Qué paradigma estoy rompiendo al estudiar el doctorado
Qué paradigma estoy rompiendo al estudiar el doctoradoQué paradigma estoy rompiendo al estudiar el doctorado
Qué paradigma estoy rompiendo al estudiar el doctoradoantoniozorrilla1
 
Formación complementaria
Formación  complementariaFormación  complementaria
Formación complementariamagalisiri
 
The Outcome Economy
The Outcome EconomyThe Outcome Economy
The Outcome EconomyHelge Tennø
 

Andere mochten auch (6)

Qué paradigma estoy rompiendo al estudiar el doctorado
Qué paradigma estoy rompiendo al estudiar el doctoradoQué paradigma estoy rompiendo al estudiar el doctorado
Qué paradigma estoy rompiendo al estudiar el doctorado
 
Formación complementaria
Formación  complementariaFormación  complementaria
Formación complementaria
 
Yasuní
YasuníYasuní
Yasuní
 
Palancas
PalancasPalancas
Palancas
 
Rss
RssRss
Rss
 
The Outcome Economy
The Outcome EconomyThe Outcome Economy
The Outcome Economy
 

WRITE UP ON SMAX RATE '16
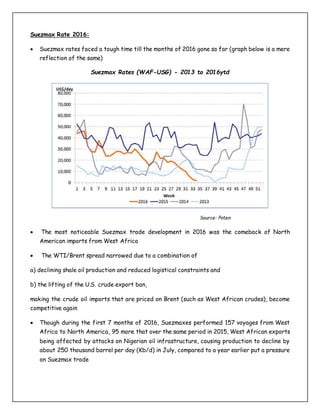
  • 1. Suezmax Rate 2016:  Suezmax rates faced a tough time till the months of 2016 gone so far (graph below is a mere reflection of the same) Suezmax Rates (WAF-USG) - 2013 to 2016ytd Source: Poten  The most noticeable Suezmax trade development in 2016 was the comeback of North American imports from West Africa  The WTI/Brent spread narrowed due to a combination of a) declining shale oil production and reduced logistical constraints and b) the lifting of the U.S. crude export ban, making the crude oil imports that are priced on Brent (such as West African crudes), become competitive again  Though during the first 7 months of 2016, Suezmaxes performed 157 voyages from West Africa to North America, 95 more that over the same period in 2015, West African exports being affected by attacks on Nigerian oil infrastructure, causing production to decline by about 250 thousand barrel per day (Kb/d) in July, compared to a year earlier put a pressure on Suezmax trade
  • 2.  The lifting of the Iran sanctions helped Suezmax demand; India also increased crude oil imports from Iran, resulting in 40 Suezmax shipments in 2016 ytd compared to 16 over the comparable period in 2015  Over the first 7 months of the year, the total number of Suezmax cargoes increased to 3,501 from 3,452 in 2015. The total number of voyages with discharge ‘East of Suez’ increased by 5.4%, while the number of voyages with destinations in the Atlantic basin decreased by 0.8%, continuing the diversification of Suezmax trades from the Atlantic Basin to the Pacific  Growth in Suezmax voyages from South America to the Far East added significantly to ton- mile demand, even though the number of voyages is relatively modest  Majority of the new vessels were delivered earlier this year, which might explain the gradual decline in rates as the year progressed It can be expected with the return of normal winter market and recovery of Nigerian production Freight Market for Suezmax may improve, however new deliveries will increase the supply level which may ultimately turn out to be a hindrance for rate improvement.