CanadaHelps Infographic - November 2012
•
0 gefällt mir•509 views

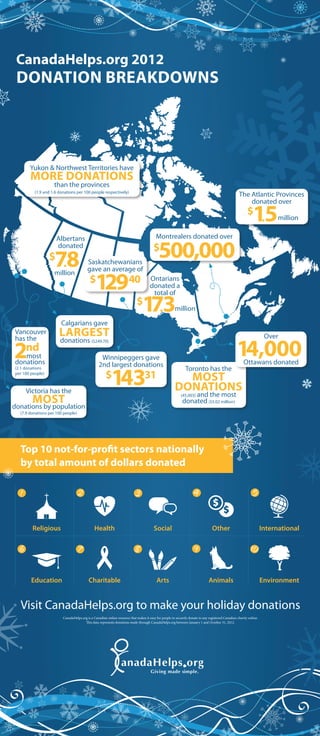
As we are nearing the end of 2012, CanadaHelps.org has looked back at the year and compiled a breakdown by geography and sector of charitable donations from Canadians who donated through the CanadaHelps.org website. Which regions are the most charitable? Which charitable sectors received the most donations? Check out the infographic for some of the figures and trends that CanadaHelps.org has uncovered for 2012 (so far).

Empfohlen
Weitere ähnliche Inhalte
Andere mochten auch
Andere mochten auch (17)
Mehr von CanadaHelps / MyCharityConnects
Mehr von CanadaHelps / MyCharityConnects (20)
CanadaHelps Infographic - November 2012
- 1. CanadaHelps.org 2012 Donation Breakdowns Yukon & Northwest Territories have more donations than the provinces (1.9 and 1.6 donations per 100 people respectively) The Atlantic Provinces donated over $ 1.5 million Albertans Montrealers donated over $ donated 7.8 Saskatchewanians $ 500,000 gave an average of 129 million $ 40 Ontarians donated a total of $ 17.3 million Calgarians gave Vancouver largest Over 14,000 has the 2 donations ($249.70) nd most Winnipeggers gave donations 2nd largest donations Ottawans donated 143 (2.1 donations Toronto has the per 100 people) $ 31 most Victoria has the donations and the most most (45,003) donated ($5.02 million) donations by population (7.9 donations per 100 people) Top 10 not-for-profit sectors nationally by total amount of dollars donated 1 2 3 4 5 Religious Health Social Other International 6 7 8 9 10 Education Charitable Arts Animals Environment Visit CanadaHelps.org to make your holiday donations CanadaHelps.org is a Canadian online resource that makes it easy for people to securely donate to any registered Canadian charity online. This data represents donations made through CanadaHelps.org between January 1 and October 31, 2012.